SOLANA (SOLUSD): Bullish Reversal Confirmed
It looks like Solana is ready to return to a bullish trend.
We see multiple strong price action confirmations after
a test of a significant daily support.
The price formed the ascending triangle on that, and violated
both its neckline and a resistance line of a falling wedge pattern.
Looks like the market can reach 180 level easily soon.
❤️Please, support my work with like, thank you!❤️
Solana

SOLANA ( SOLUSDT ) | 1H | BULL Hi Guys;
My Solana target level is 145 with corrections. Even if it corrects, it will reach 145 in the near future.
I will update here after I reach my target level. Please don't forget to press the like button so you don't miss the updates.
Best regards

$125 buy target for Solana$125 buy target for Solana
My previous analysis came to play. The green TL acted as resistance zone despite the false breakout.
I see this baby coming down to kiss the blue TL as a support level before another push up.
I have a buy entry for $125.
Trade with caution as crypto market is a volatile one.
Please share your thoughts, like and follow for more charts.

Solana Bearish oversold bounce back capped by 136.68Solana price action exhibits a bearish sentiment, driven by the prevailing downtrend. The recent price movement appears to be an oversold bounce back, forming a bearish sideways consolidation pattern. This indicates that bearish pressure remains dominant despite a temporary upward correction.
Key Level (136.68):
The critical trading level to monitor is 136.68, which marks the previous intraday consolidation zone. An oversold rally approaching this level could face bearish rejection, reinforcing the continuation of the downtrend. A failure to break above this resistance level would likely prompt further downside movement.
Support Levels:
If the bearish sentiment prevails and the price is rejected from the 136.68 level, the downside targets include:
119.80 - Immediate support level.
105.21 - Secondary support.
97.71 - Long-term support level.
Bullish Scenario:
Conversely, a confirmed breakout above the 136.68 resistance level, followed by a daily close above it, would negate the bearish outlook. This breakout could initiate further upward momentum, targeting:
142.24 - Initial resistance after the breakout.
149.90 - Subsequent resistance level.
Conclusion:
The overall sentiment for Solana remains bearish, with 136.68 acting as the pivotal resistance level. An oversold bounce approaching this level may face rejection, signaling a continuation of the downward trend. However, a breakout and daily close above 136.68 could shift the sentiment to bullish, opening the path for further gains toward 142.24 and 149.90. Traders should remain cautious and watch for confirmation signals at the critical resistance level.
This communication is for informational purposes only and should not be viewed as any form of recommendation as to a particular course of action or as investment advice. It is not intended as an offer or solicitation for the purchase or sale of any financial instrument or as an official confirmation of any transaction. Opinions, estimates and assumptions expressed herein are made as of the date of this communication and are subject to change without notice. This communication has been prepared based upon information, including market prices, data and other information, believed to be reliable; however, Trade Nation does not warrant its completeness or accuracy. All market prices and market data contained in or attached to this communication are indicative and subject to change without notice.

Solana’s Cup-and-Handle Setup: A Bullish Trap or Opportunity?Recent analysis suggests Solana (SOL) is forming a large cup-and-handle pattern, with a potential false breakout on the fifth wave before a flash crash in mid to late April. Some traders believe this correction could set the stage for a stronger breakout on the seventh wave, possibly pushing SOL past its current pattern high and toward the upper boundary of a broadening wedge formation. Despite short-term volatility, this multi-year structure supports a long-term bullish outlook.
In the near term, market structure remains uncertain, with SOL facing downward pressure despite bouncing from $120. While this level has historically been strong support, the depth of the correction and multiple broken levels suggest caution. Analysts remain divided on the next move—some expect consolidation between $120 and $180, while others warn of a potential drop to $80 if market conditions worsen. Monitoring key support and resistance levels will be crucial for traders navigating the next phase.

JUST IN: First Solana ETFs to Launch in The US TomorrowThe highly functional open source project that banks on blockchain technology’s permissionless nature to provide decentralized finance (DeFi) solutions is set to debut its First Spot ETFs in the US tomorrow.
Price of Solana ( CRYPTOCAP:SOL ) surged 5% today amidst Solana ETFs set to to be launch tomorrow. A news that made Solana reclaim the $130 zone. With build-up momentum and RSI barely overbought at 53 CRYPTOCAP:SOL is set to break the 38.2% Fibonacci retracement point a level that aligns with $150- 160.
A break above this pivot point could send solana on a bullish course with eyes set on the $200- 270 price points.
Similarly, in the case of a reprieve, CRYPTOCAP:SOL might find support in the 78.6% Fibonacci retracement point before picking momentum up.
Solana Price Live Data
The live Solana price today is $130.00 USD with a 24-hour trading volume of $2,966,846,344 USD. Solana is up 5.12% in the last 24 hours, with a live market cap of $66,305,695,632 USD. It has a circulating supply of 510,033,072 SOL coins and the max. supply is not available.

An overall look at SOL with my April flash crash thesis embeddedSOL is forming a massive cup-and-handle pattern overall. However, when zooming into the short-term pattern currently unfolding, I believe we will see a false breakout leg on the fifth wave, leading to a 'flash crash' in mid to late April. After this occurs, the true breakout will likely happen on the seventh wave, taking out the pattern high and running to the top of the broadening wedge pattern—or perhaps even higher—given the bigger picture of a massive cup-and-handle formation that has been developing for over three years.
Good luck, and always use a stop-loss!

The handle is now forming on a massive cup & handle on SOL.SOL is now forming the handle of a massive cup-and-handle pattern that has taken over three years to develop. If SOL breaks out of this pattern in the coming months, we could very well see a four-digit price moving forward.
Keep your eyes on this.
Good luck, and always use a stop-loss!

SOL Looks Bearish (1D)A major trendline has been lost despite positive news, and SOL is prone to further drops towards the green box.
A large liquidity pool exists below the price, which is likely to be taken out, pushing the price toward the marked zone.
The price structure has turned bearish with a CH on the chart.
A daily candle closing above the invalidation level will nullify this analysis.
For risk management, please don't forget stop loss and capital management
Comment if you have any questions
Thank You

BTCUSD Daily Updated Outlook and V-Shape Recovery
🏆 BTC Market Update
📊 Technical Outlook
🔸Mid-term: BEARISH OUTLOOK
🔸Status: 40% correction in progress
🔸Potential V-shape recovery
🔸Similar fractal to 2021
🔸105 000 - 68 000 40% correction
🔸68 000 - 118 000 - 80% gains
🔸Price Target Bears: 68 000 USD
🔸Price Target BULLS: 118 000 USD
📉 Market Dynamics:
💰 BTC Pulls Back – Bitcoin corrects 🔻22% from its all-time high, but analysts see a potential rebound ahead. 📊📈
🏦 Institutional Power Play – MicroStrategy holds nearly 500K BTC at an average price of $66K, planning to buy more with a $21B stock issuance. 📉💎
🌎 Global Bitcoin Developments:
🇧🇹 Bhutan's Secret Stash – The country holds $750M in BTC, making up 28% of GDP, powered by hydro-mining. ⚡⛏️
⚖️ U.S. Crypto Regulations – Stricter rules under President Trump aim to integrate crypto into traditional finance. 📜🏦
🕵️♂️ Satoshi Mystery Continues – New theories emerge about Bitcoin's anonymous creator. 🤯🔍

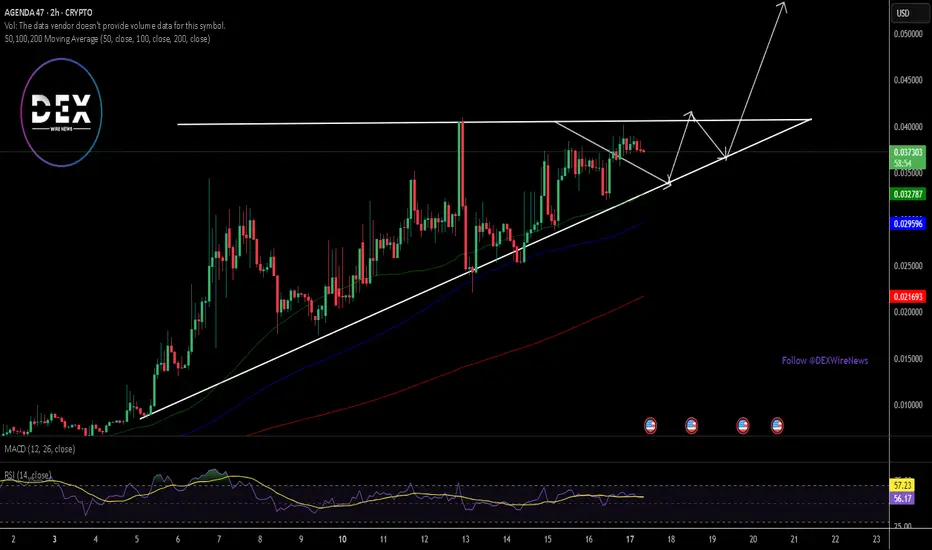
$A47 Coin Set for Breakout Amidst Bullish Symmetrical TriangleAgenda 47 ($A47) a token built on the Solana blockchain that aims to be a movement for patriots, degens, and meme enthusiasts who believe in financial freedom and fun. Inspired by Trump’s vision of economic empowerment, combining the power of memes and blockchain technology to build a decentralized financial ecosystem is set for a massive breakout amidst a bullish symmetrical triangle formed on the chart.
Since the last week of February, 2025 Agent 47 coin consecutively saw an uptick in price leading up to a massive 21,000% in just 20 days. While still trading above key Moving Averages and the Relative Strength Index (RSI) sitting at 56, a 50% surge isn't far fetched given the Symmetrical triangle pattern.
With momentum gradually increasing, a breakout above the ceiling of the symmetrical triangle will be the spark Agent 47 coin needs to spark a renaissance.
AGENDA 47 Price Live Data
The live AGENDA 47 price today is $0.037771 USD with a 24-hour trading volume of $946,453 USD. AGENDA 47 is up 5.78% in the last 24 hours, with a live market cap of not available. The circulating supply is not available and the max. supply is not available.
SOL: Current SituationYou asked, and we delivered:
Solana (SOL) is trading at $129, navigating a volatile phase amid a broader crypto market downturn, with the total market cap down 4.4% in the last 24 hours. Sentiment is mixed: some traders eye a potential cup-and-handle pattern for a bullish breakout, while others flag oversold conditions and bearish signals. Rumors of a Solana ETF add speculation, though unconfirmed. For now, SOL’s price action hinges on key support and resistance levels.
Technical Indicators and Key Levels
Short-Term (1-Hour Chart):
Support: $125 (critical), $110
Resistance: $140, $150
Indicators: RSI near oversold (~30), MACD bearish. A break above $140 with volume could target $150, but a drop below $125 risks $110.
Long-Term (Weekly Chart):
Support: $125, $90
Resistance: $140, $180
A hold above $125 could set up a rally to $180 if the cup-and-handle pattern confirms. Below $125, a deeper correction to $90 is possible.
Potential Scenarios
Bullish Case: Hold $125, break $140 with volume → target $150 (short-term), $180 (long-term).
Bearish Case: Break below $125 → test $110 (short-term), $90 (long-term).
Volume is key, watch for spikes to confirm moves.
Broader Context and Tips
SOL’s long-term outlook is promising due to its fast blockchain and ecosystem growth, but short-term risks loom. External factors like US inflation data or ETF news could sway the market. Traders should use tight stops, focus on $125 support, and stay flexible. Long-term investors should monitor $125 as a critical floor for bullish continuation.

Solana ($SOLUSD) - Monthly Demand InboundQuick TA for Solana $SOL. Many cryptos are at inflection points and will likely break higher or roll over from current prices (I think a move down is more likely, per long-term charts, and am hoping this happens for the sake of buying opportunities). Solana, like many other cryptos, has failed to develop meaningful 1D bullish momentum (RSI holding below 50). Should COINBASE:SOLUSD get another leg down, I'll be watching its behavior as it enters lower demand zones. 101.75-78.87 = monthly demand; 74.85-51.37 = weekly demand, but there are also buy areas higher. If Solana trades lower and approaches the aforementioned levels, use LTFs for signs of exhaustion/downtrend reversal. Personally, I wouldn't use "set-and-forget" buy limit orders; higher-beta cryptos may keep selling off until majors bottom/reverse and/or prices might not trade low enough to hit your limit price. I prefer more of a "hands-on" approach to trading, but to each their own.
On the road, so truncated analysis. Will update when I can. Thank you for your interest and let me know what you think!
Jon
@JHartCharts

SOLUSD Potential UpsidesHey Traders, in today's trading session we are monitoring SOLUSD for a buying opportunity around 123 zone, SOLUSD is trading in an uptrend and currently is in a correction phase in which it is approaching the trend at 123 support and resistance area.
Trade safe, Joe.

SOL Trading Plan: Stacking Entries Like a ProSolana (SOL) has been in a slow uptrend over the past five days, after hitting the low at $112. The current price action looks like an ABC corrective pattern, which could mean we’re setting up for lower prices.
To get the best trade execution, we'll use a laddered entry approach, meaning we’ll scale into positions gradually instead of going all in at once. This helps us get a better average entry price while managing risk effectively. By placing orders at key levels, we increase our chances of catching the right move without overcommitting too early.
Resistance Zone ($136 - $143.80)
A major resistance zone has formed between $136 - $143.80, where price is likely to struggle. This area contains multiple technical confluences that suggest a potential reversal or strong reaction:
$136 – 0.618 Fibonacci Retracement
$140.09 – 1:1 Trend-Based Fibonacci Extension
$141.40 – Anchored VWAP from the $179.85 swing high
$143.80 – Point of Control (POC) from the 19-day Fixed Range Volume Profile
This makes $136 - $143.80 a prime area to consider short positions, especially if price starts showing weakness.
Support Zone ($102.1 - $98.50)
On the downside, a major demand zone is forming between $102.1 - $98.50, where buyers are likely to step in aggressively. This zone has multiple technical confluences, making it a high-probability long entry area:
$102.1 – 2024 Yearly Open & Monthly Support
$100 – Bullish Monthly Order Block & Anchored VWAP Support
$98.50 – Final key demand zone
This zone presents a solid long opportunity, allowing for gradual scaling into positions as price moves deeper into support.
Short Trade Setup – Laddered Entry Approach
Instead of entering all at once, we’ll ladder into the short position gradually, starting small and increasing size as price moves deeper into resistance.
Short Entry Levels & Position Sizing
Trade Details
Average Entry Price: $140.12
Take Profit Target: slightly above $102.10 (Monthly Level)
Stop Loss: slightly above $146.70 (Above POC)
Risk-Reward Ratio (R:R): ~6:1
Long Trade Setup – Laddered Entry Approach
For the long setup, we start with small entries at higher prices and increase size as price moves deeper into support, ensuring a better average entry in a key demand zone.
Long Entry Levels & Position Sizing
Trade Details
Average Entry Price: $102.72
Take Profit Target: slightly below $120.00
Stop Loss: slightly below $95.00
Risk-Reward Ratio (R:R): ~2.45:1
Market Outlook
Short Bias: Until price reclaims $143.80, this remains a strong resistance zone for potential short trades.
Short Setup: Laddering into resistance ensures better risk management and higher average entry efficiency.
Long Setup: Starting small at $112 and increasing position size down to $98.50 ensures strong positioning in a high-confluence demand zone.
By scaling into trades rather than committing at a single price, we increase flexibility, improve trade execution, and adapt better to price movements. 🚀
Weekly Timeframe - 200 EMA Support
$100 coincides with the 200 EMA on the weekly timeframe, adding confluence to this area as strong support.
If Solana decisively breaks above $144, it would invalidate the short thesis and suggest a potential move higher toward $150. Conversely, a strong rejection from the resistance zone would likely accelerate the move toward $112 to test demand at swing low.

TON Go to $4.5?Durov was finally released, he returned to Dubai, and #TON perked up by +16% in a day.
That's it, now people will love the CRYPTOCAP:TON Ecosystem again, a bunch of new tapals will come out.
The key resistance level will be at $4.5
We can also go to $2.7
The break of the global triangle upwards may be in Seb-Oct
Correction time The TON Ecosystem was used wisely, they identified weak points, protected their market from Competitors with protectionism, mini apps in Telegram should only use TON, now Liquidity will accumulate more inside Telegram, and not go to Solana.
The game starts again)) and we are ready for it.

SOLANA; Heikin Ashi Trade IdeaBINANCE:SOLUSD
In this video, I’ll be sharing my analysis of SOLUSD, using my unique Heikin Ashi strategy. I’ll walk you through the reasoning behind my trade setup and highlight key areas where I’m anticipating potential opportunities.
I’m always happy to receive any feedback.
Like, share and comment! ❤️
Thank you for watching my videos! 🙏

SOL/USD "Solana vs U.S Dollar" Crypto Market Heist Plan🌟Hi! Hola! Ola! Bonjour! Hallo!🌟
Dear Money Makers & Robbers, 🤑 💰🐱👤🐱🏍
Based on 🔥Thief Trading style technical and fundamental analysis🔥, here is our master plan to heist the SOL/USD "Solana vs U.S Dollar" Crypto Market. Please adhere to the strategy I've outlined in the chart, which emphasizes short entry. Our aim is the high-risk Green Zone. Risky level, oversold market, consolidation, trend reversal, trap at the level where traders and bullish robbers are stronger. 🏆💸Book Profits Be wealthy and safe trade.💪🏆🎉
Entry 📈 : "The heist is on! Wait for the breakout (160.00) then make your move - Bearish profits await!"
however I advise placing Sell Stop Orders below the breakout MA or Place Sell limit orders within a 15 or 30 minute timeframe. Entry from the most recent or closest low or high level should be in retest.
Stop Loss 🛑:
Thief SL placed at the recent / nearest low level Using the 1D timeframe (200.00) swing trade basis.
SL is based on your risk of the trade, lot size and how many multiple orders you have to take.
Target 🎯:
1st Target - 125.00 (or) Escape Before the Target
Final Target - 90.00 (or) Escape Before the Target
🧲Scalpers, take note 👀 : only scalp on the Short side. If you have a lot of money, you can go straight away; if not, you can join swing traders and carry out the robbery plan. Use trailing SL to safeguard your money 💰.
📰🗞️Fundamental, Macro, COT, Sentimental Outlook:
SOL/USD "Solana vs U.S Dollar" Crypto Market is currently experiencing a bearish trend,., driven by several key factors.
⚡⭐Fundamental Analysis
Blockchain Trends: Solana's blockchain growth is expected to slow down, driven by increasing competition from other blockchain platforms.
Smart Contract Activity: Smart contract activity on Solana's blockchain is expected to decrease, driven by growing competition from other blockchain platforms.
Mining Difficulty: Solana's mining difficulty is expected to decrease, driven by decreasing network hash rate.
Transaction Volume: Solana's transaction volume is expected to decrease, driven by decreasing demand for cryptocurrency transactions.
⚡⭐COT Data
Non-Commercial Traders (Institutional):
Net Short Positions: 55%
Open Interest: 100,000 contracts
Commercial Traders (Companies):
Net Long Positions: 30%
Open Interest: 50,000 contracts
Non-Reportable Traders (Small Traders):
Net Short Positions: 15%
Open Interest: 20,000 contracts
COT Ratio: 0.6 (indicating a bearish trend)
⚡⭐Sentimental Outlook
Institutional Sentiment: 40% bullish, 60% bearish.
Retail Sentiment: 35% bullish, 65% bearish.
Market Mood: The overall market mood is bearish, with a sentiment score of -50.
⚡⭐On-Chain Analysis
Network Hash Rate: Solana's network hash rate has decreased by 10% over the past month, indicating a decline in mining activity.
Transaction Volume: Solana's transaction volume has decreased by 20% over the past month, indicating a decline in network activity.
Active Addresses: Solana's active addresses have decreased by 15% over the past month, indicating a decline in network adoption.
⚡⭐Market Data Analysis
Order Book Analysis: The SOL/USD order book is showing a significant imbalance, with more sell orders than buy orders, indicating a bearish market sentiment.
Liquidity Analysis: Solana's liquidity has decreased by 10% over the past month, indicating a decline in market participation.
Volatility Analysis: Solana's volatility has increased by 20% over the past month, indicating a more unpredictable market.
⚡⭐Positioning
Long Positions: 30% of total positions
Short Positions: 70% of total positions
Neutral Positions: 0% of total positions
Leverage: 2:1 (average)
⚡⭐Next Move Prediction
Bearish Move: Potential downside to 140.00-125.00.
Target: 125.00 (primary target), 90.00 (secondary target)
Next Swing Target: 80.00 (potential swing low)
Stop Loss: 190.00 (above the 30-day high)
Risk-Reward Ratio: 1:2 (potential profit of 30.00 vs potential loss of 15.00)
⚡⭐Overall Outlook
The overall outlook for SOL/USD is bearish, driven by a combination of fundamental, technical, and sentimental factors. The expected slowdown in Solana's blockchain growth, decreasing smart contract activity, and bearish market sentiment are all supporting the bearish trend. However, investors should remain cautious of potential upside risks, including changes in global economic trends and unexpected regulatory developments.
⚠️Trading Alert : News Releases and Position Management 📰 🗞️ 🚫🚏
As a reminder, news releases can have a significant impact on market prices and volatility. To minimize potential losses and protect your running positions,
we recommend the following:
Avoid taking new trades during news releases
Use trailing stop-loss orders to protect your running positions and lock in profits
📌Please note that this is a general analysis and not personalized investment advice. It's essential to consider your own risk tolerance and market analysis before making any investment decisions.
📌Keep in mind that these factors can change rapidly, and it's essential to stay up-to-date with market developments and adjust your analysis accordingly.
💖Supporting our robbery plan will enable us to effortlessly make and steal money 💰💵 Tell your friends, Colleagues and family to follow, like, and share. Boost the strength of our robbery team. Every day in this market make money with ease by using the Thief Trading Style.🏆💪🤝❤️🎉🚀
I'll see you soon with another heist plan, so stay tuned 🤑🐱👤🤗🤩

Solana SOL Will Bounce, But Then Scam!Hello, Skyrexians!
Couple of weeks ago we told you that BINANCE:SOLUSDT will reach $110 in the wave 5 inside the major wave A. You can find this analysis here . Exactly from this zone we have seen the bounce. This bounce is a major correction and those who listen this analysis could already be in the great profit. But anticipated bounce is not the bull run continuation and finally Solana will drop hard because its era is finished.
Let's take a look at the weekly time frame. Here we can see that 5 Elliott waves with the Awesome Oscillator's divergence. After that the major correction has been started. Wave A has been finished at $110 with the green dot at the Bullish/Bearish Reversal Bar Indicator and now we will see wave B, which will reach the Fibonacci 0.5 approximately at $200. From there we will see the scam drop in wave C. It will likely break the major Fibonacci 0.61 support. In this case game is over and Solana can fall for a years or even scam.
Best regards,
Skyrexio Team
___________________________________________________________
Please, boost this article and subscribe our page if you like analysis!

Solana defended the crucial 120-125 zoneCOINBASE:SOLUSD managed to defend the super important 120-125 support zone. As long as it stays above it, we can hope it would climb higher. On the contrary, if Solana breaks down below this then it can go much much lower.
Keep an eye.

How far can $125 support SOLANA from fallingSolana (SOL) Price Analysis and Forecast: Can the $125 Support Hold?
Solana (SOL) recently experienced a sharp dip to the $110 zone before rebounding swiftly. From a technical analysis (TA) perspective, the $125 support level is currently a key defence zone for the asset.
If SOL maintains its position above $125, we could see a continuation of bullish momentum. However, a decisive break below this level could expose the cryptocurrency to further downside, with the next major psychological support resting at $100.
For long-term investors, the current price action presents potential accumulation opportunities.
Maintaining a strategic approach with proper risk management will be crucial as market volatility persists.

SOLUSDT: Strong Bounce from Major Support!!BINANCE:SOLUSDT has shown a strong recovery after hitting a major support zone around $110. This bounce is accompanied by good trading volume, indicating growing interest. Investors who missed the previous rally are now accumulating, which adds further strength to the bullish sentiment.
As market conditions improve, the entry of bigger players could push SOL towards higher highs. If momentum continues, there’s potential for SOL to breach its previous all-time high, with a long-term target of $500 in sight.
For investors, this presents a solid buying opportunity to hold for the long term. Traders, however, should manage their risk carefully and always set a stop loss to protect their capital.
BINANCE:SOLUSDT Currently trading at $132
Buy level: Above $110
Stop loss: Below $90
Target : $500
Max Leverage 3x
Always keep Stop loss
Follow Our Tradingview Account for More Technical Analysis Updates, | Like, Share and Comment Your thoughts

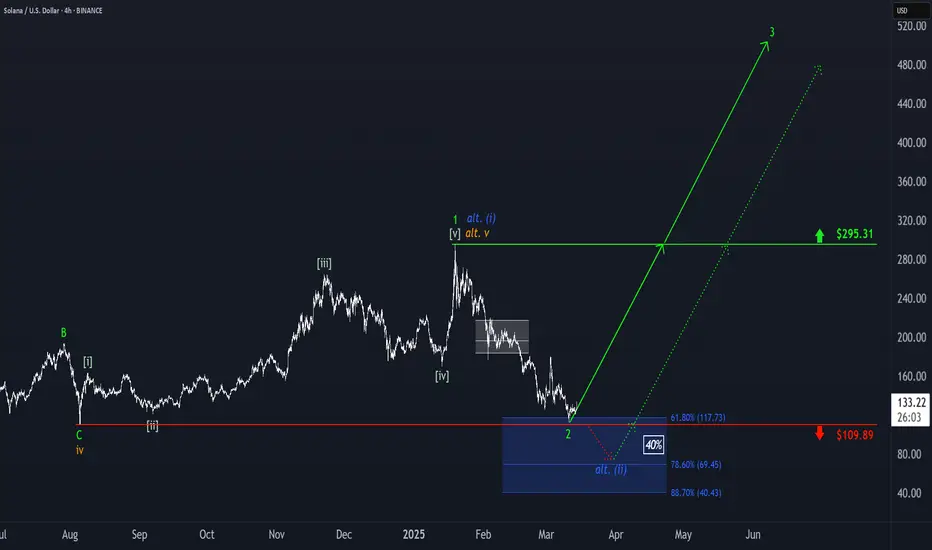
Solana: Precision Landing?!Solana extended its sell-off and reached our blue long Target Zone between $117.73 and $40.43. The price then reacted right at the $109.89 support level, indicating that the low of the green wave 2 has been settled. Thus, the next step should involve a strong rally driven by the green wave 3, ultimately pushing SOL well beyond the $295.31 resistance and past its current all-time high. However, our Target Zone remains active, as there is a 40% chance that the price could revisit this range to complete the blue alternative wave (ii) below the $109.89 mark.