Solana (SOL/USDT) Showing Bearish Signs – Further Downside 1DSolana (SOL) is currently displaying bearish price action on the charts. After failing to hold key support levels, the price has started trending downward, signaling potential further downside.
Large market participants appear to be interested in accumulating Solana at lower price levels. Current price action suggests that smart money is patiently waiting for a deeper pullback before stepping in with significant buy orders.
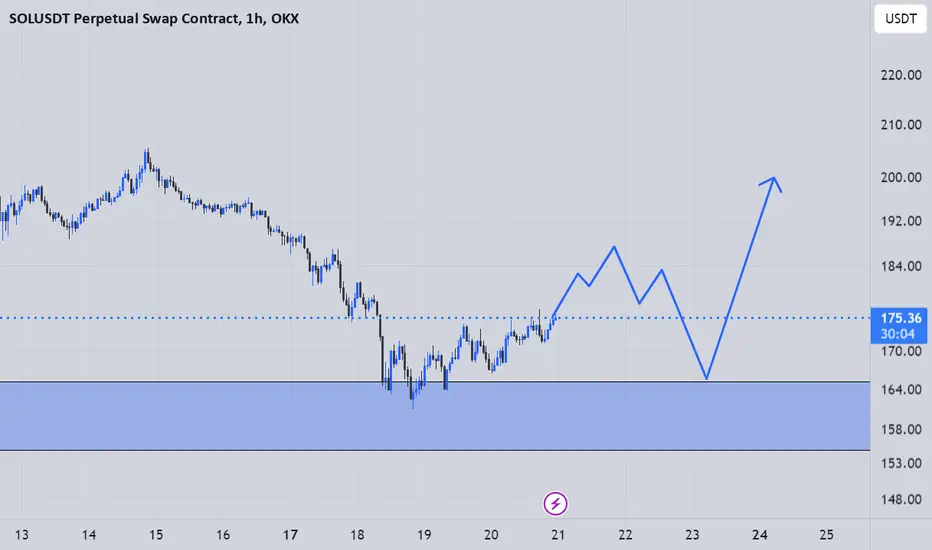
Potentially interesting entry points for Solana could be approaching very soon. With the current bearish price action, the market may offer attractive opportunities for buyers looking to enter at discounted levels.
Solana

SOLANA SHORT OPPORTUNITY Possible Solana short (5m TF)
Solana is still trending down on the higher timeframes, down on the very low intra day TF's and ranging on the mid intra days so good confluence all round for a short position.
Pull back on the fib would line up nicely with a previous LL which is now a resistance level which would create a nice rejection and push to the downside. Also not this area of rejection would also align nicely with the 50 EMA which would be an additional level for price to reject.
Overall many good confluences which could align nicely for a short entry. Let's see how this plays out. Again 1:3 RR on this as normal with the possibility to take partials and let 25% run to a further downside target of the major lows at $160
Will set a Limit sell for this, no need for manual entry on confirmation as all criteria should align nicely.

I must warn you SOLANAThis coin has a very similar structure to BTC, and the risks are very high since it has been sold at highs for a long time. It's obvious that this is a selling zone for large capital. But can it go higher? Yes, but the risk of being stuck with an asset for years that no one will need later is significantly higher

SOL Spot Long Trade Re-entry
When the price breaks below the trendline and support, retail traders typically enter short trades.

(SOL) solana "big gulp"The price of Solana is looking like it is going to go into a big gulp phase with a potential for a bottom (buying zone) and a recovery (ramp up) out of the big gulp moment.

Using The Screener + My Indicator To Find Market Direction CluesTrading Family,
In this week's market update, we'll look for some clues as to where both our crypto and stock markets are headed using a combo of my proprietary indicator in conjunction with some basic filters for TradingView's stock and crypto screener tool. We'll talk about what this combo is showing us and we'll also discuss some of the lessons I have learned from trading with my newly implemented AI-created indicator tool. Hope you enjoy.
✌️ Stew

SOLUSD Megaphone bottomed. $205 min and $340 max Targets.Solana (SOLUSD) has been trading within a Megaphone pattern, which technically had the price bottomed on its Lower Lows 3 days ago. That bottom was also a 1D RSI oversold barrier (30.00) test, which is exactly where the December 22 2024 Low was priced.
Being below both the 1D MA200 (orange trend-line) and the 1D MA50 (blue trend-line), the natural short-term Target is again the 1D MA50 at $205.00, similar to the January 03 test.
On the longer term, if SOL makes a 1W candle closing above the 1D MA50, we can resume buying and target the top (Higher Highs trend-line) of the Megaphone at $340, which is where the 1.236 Fibonacci extension is, exactly where the January 19 High was priced.
-------------------------------------------------------------------------------
** Please LIKE 👍, FOLLOW ✅, SHARE 🙌 and COMMENT ✍ if you enjoy this idea! Also share your ideas and charts in the comments section below! This is best way to keep it relevant, support us, keep the content here free and allow the idea to reach as many people as possible. **
-------------------------------------------------------------------------------
💸💸💸💸💸💸
👇 👇 👇 👇 👇 👇

SOLANA - Potential Reversal on the Horizon?SOLUSDT – Potential Reversal on the Horizon?
The market's direction remains uncertain, but a closer look at the chart reveals some key insights:
1️⃣ Previous volume candles have been completely wiped out.
2️⃣ A higher low formation is a possibility.
If you're not in a trade yet, consider waiting for a pullback and confirmation of a higher low before entering. However, if the price flips without a pullback, you may either take a position immediately or wait for a retracement before committing.
Always ensure you set a stop loss when entering a trade to manage your risk effectively.
REMARKS: DYOR
• This advice is NOT financial advice.
• We do not provide personal investment advice and we are not a qualified licensed investment advisor.
• All information found here, including any ideas, opinions, views, predictions, forecasts, commentaries, suggestions, or stock picks, expressed or implied herein, are for informational, entertainment or educational purposes only and should not be construed as personal investment advice.
• We will not and cannot be held liable for any actions you take as a result of anything you read here.
• We only provide this information to help you make a better decision.
• While the information provided is believed to be accurate, it may include errors or inaccuracies.
Good Luck and have fun,
The CryptoSignalScanner Team

$SOL RSI Fully Reset! Could Very Well Have Seen the BottomI’ve been waiting a few days before posting an update on CRYPTOCAP:SOL to see if it forms a cluster that mimics the fractal before the Trump Pump.
So far it has been playing out perfectly.
I still think we might have a wick at the very least to retest $155, but it does not necessarily have to happen as we’ve already have some confirmed price action in that region.
Main target is reclaiming the DMA9 and then prior Trend.
The RSI has FULLY RESET, so we could very well have seen the bottom here.

Solana Bullish Megaphone PatternKey backtest of the previous bullish symmetrical triangle now which could be forming a bullish megaphone pattern.
ETF coming, staking on ETF coming, bullish crypto regs, SOL remains # 1 chain. See you at $450 target of this pattern.

solusdt long setup solana"🌟 Welcome to Golden Candle! 🌟
We're a team of 📈 passionate traders 📉 who love sharing our 🔍 technical analysis insights 🔎 with the TradingView community. 🌎
Our goal is to provide 💡 valuable perspectives 💡 on market trends and patterns, but 🚫 please note that our analyses are not intended as buy or sell recommendations. 🚫
Instead, they reflect our own 💭 personal attitudes and thoughts. 💭
Follow along and 📚 learn 📚 from our analyses! 📊💡"
Drop to $160?Solana’s teetering on the 4H at $172.24, rebounding from $165 in early February after a brutal drop from $250 in January. I’m bullish, SOL’s market cap (~$85B) and 162% YTD growth make it the next crypto king, powered by DeFi, NFTs, and meme coins like $WIF/$BONK. But can it reclaim its glory, or is this another bear trap?
Technically, we’re consolidating in a tight range near $165-$170, forming a bullish flag or triangle, breakout potential to $250 if we flip $180-$182 (50 EMA). RSI’s at ~55 and rising, showing buyers gaining steam, while volume’s spiked since mid-Feb, hinting at accumulation. The 50/200 EMAs tell a rollercoaster story: Golden Cross at $200 (Jan 18) hinted at a pump but got crushed, Death Cross at $220 (Feb 4) triggered the dump, and now they’re diverging (50 EMA at $182, 200 EMA at $209), watch for a new Golden Cross above $200 if price holds. Trump’s pro-crypto push and Solana’s ETF rumors could blast us to $300, but bears argue $160’s the floor if $165 cracks. I’ve seen similar patterns in 2021 lead to 35%+ pumps, history repeating?
What’s your take?
SOL to $250 by March or back to $160, where’s the real target?
Is Solana the next BTC/ETH, or just meme coin hype from $WIF/ SEED_DONKEYDAN_MARKET_CAP:BONK ?
EMA divergence now, Golden Cross ahead, or death spiral? Bullish or bearish?
Trump’s policies + ETF buzz, pump to $300, or noise leading to a crash?
Drop your targets, indicators, or contrarian views.
I’ll reply to every comment and debate!

Could Solana be finally reversing on the upside?COINBASE:SOLUSD has been a nightmare and has fell significantly in past few days, much more than #BTC and #ETH relatively.
But I can see a potential leading diagonal (3-3-3-3-3) rise. It the retracement of it holds above/around 61.8% which also happens to be the wave 4 low (165.945) then the next leg up should start which would give more insight into whether this is really an impulse up in progress or just another corrective leg.

SOL on the Slide: Is a Bounce from $150 in the Cards?Solana has been in a downtrend for over 30 days after reaching its ATH at $295.83. For the past two weeks, SOL was stuck in a trading range that formed a descending triangle (a bearish pattern) which eventually broke down, confirming the downtrend. Additionally, SOL lost its yearly support level at $189.31. Where is SOL heading next? Let's find out!
Key Support Zone
Our main long opportunity is around the $150 level, where several confluences align:
Fibonacci Levels:
The 0.5 fib retracement of the entire 5-wave structure sits at $151.92.
The 0.786 fib retracement from the 5th wave is at $149.77.
A fib extension 1.618 of the descending triangle is at $148.65, which is very close to the $150 mark.
Volume Profile:
The Point of Control (POC), highlighted by the red horizontal ray, is around $144, adding another layer of support.
Trade Setup
Currently waiting for SOL to reach the support zone between $152 and $144. An alarm is set when price nears these levels for a long opportunity.

Solana’s Silent Crisis: Why Addresses Diminish While Price HoldsSomething unusual is happening in the Solana ecosystem. While SOL’s price has climbed from $161 to $197, its active user base has dropped by more than 50%. Just a few months ago, in October 2024, Solana’s network saw 18.5 million active addresses, a sign of robust engagement. But fast forward to February 2025, and that number has plunged to 8.4 million.
This raises an important question: Why is Solana’s price rising while user participation is falling?
The Disconnect Between Price and Network Activity
At first glance, a price increase would suggest growing interest and adoption. But here’s the twist: SOL’s value appears to be driven by fewer, but more committed investors, rather than broad-based usage growth.
🔹 Declining Engagement – Fewer transactions, less activity, and a shrinking user base.
🔹 Rising Prices – A sign that major investors and institutions, rather than retail traders, could be accumulating SOL.
The Technical Picture: A Market at a Crossroads
Beyond network activity, technical indicators reveal a market in limbo.
📊 RSI at 32.16 – Just above the oversold threshold (30), meaning buyers could step in soon.
📊 Money Flow Index (MFI) at 39.98 – Money isn’t aggressively leaving SOL, but it isn’t pouring in either.
📊 Open Interest Down 2.23% – Fewer traders are taking new positions, suggesting hesitation.
Key Price Levels to Watch
Solana’s next moves will depend on how it interacts with these crucial levels:
📌 Resistance: $180 and $200 – A sustained move above $180, especially if RSI crosses 40, could signal a recovery.
📌 Support: $170 and $160 – If selling pressure intensifies, SOL could retest these lower zones.
Where Does Solana Go From Here?
Is Solana becoming a blockchain for whales and institutions rather than everyday users? Or is this just a temporary lull before a fresh wave of adoption?
For now, SOL’s price remains resilient, but without renewed on-chain activity, the rally may not last. If open interest and network participation rebound, Solana could be setting up for its next major move.

SOL/USDT Trading Scenario UpdateThe overall negative sentiment in the altcoin market, along with the beginning of the FTX customer repayment process, is putting downward pressure on the price of Solana (SOL). Currently, the asset's value has declined by more than 45% from its local peak and has dropped below the 300-day moving average.
From a volume profile perspective, market participants' interest in SOL remains high within the current broad price range. At its current price level, the asset appears attractive for long-term investments.

SOLANA: $1,000 Incoming?This chart shows how Solana (SOL) follows market cycles, long periods of low prices (accumulation) before big price spikes (breakouts).
- We’re in a similar phase to 2021, just before SOL’s last huge rally.
- $500 and $750 are key resistance levels—breaking them could send SOL much higher.
- Alt & Meme Season matters—when memes pump, demand for SOL rises.
- Bitcoin’s bull run is key, when BTC moves up again, SOL will likely follow fast.
- Price could rise quickly past $1,000 once key levels break.

SOL dropped 40% after big volume. What's next?SOL dropped 40% after big volume. What's next?
in a previous video i warned you that we are close to a TOP
what should we do now?

SOL - after 45% drop time for some riseSOL - after 45% drop time for some rise
best place for long is at 164 area
wit a target 1st VWAp dev

Solana Market Analysis according to current market ( SOL )
Timeframe: 4 Hours
As observed over the past few days, Solana has experienced a significant downward move, which was expected. If you look at the chart, a pennant pattern had formed, which was squeezing and eventually broke to the downside. This breakdown led to a complete fulfillment of the supply zone, with Solana’s price moving toward the 155–165 range, which acted as a strong order block and support zone.
This move confirms two key points:
Strong Order Block: The 155–165 zone is a robust support area and order block.
BTC Correlation: Bitcoin has also been moving toward its strong support zone (89k–92k), which aligns with Solana’s price action.
Two Possible Scenarios for Solana
Scenario 1: Demand Creation at Current Levels (Higher Probability)
Solana is likely to create demand from its current levels, with two strong zones to watch:
$195 Zone: A key level where demand could materialize.
$230 Zone: A secondary target if the price gains momentum.
This is the more probable scenario, where Solana stabilizes and creates demand, either at
195 or 230, leading to a potential upward move.
Scenario 2: Further Downside (If BTC Breaks Support)
If Bitcoin breaks its strong support zone (89k–92k), which seems increasingly likely, Solana could experience another significant downward move. In this case, Solana might break below the 150–140 range, leading to a further decline. This would mirror the previous supply-driven move, potentially taking Solana much lower.
Summary
Current Support Zone: Solana has found support in the 155–165 range, which is a strong order block.
Scenario 1 (Higher Probability):Demand creation at 195 or 230, leading to an upward move.
Scenario 2 (If BTC Breaks Support): Further downside, potentially breaking the 150–140 range.
Note
My goal is to simplify the chart and help you understand the price action clearly. I avoid overloading the chart with unnecessary indicators or creating confusion. My analysis focuses on keeping the chart clean and straightforward.
Thank you!

ICT TA Daily view, we are in a Fib golden zone + OB!We have reached a Golden Fib retracement Zone , With a an OB in that Zone too + VFG1 . and thar happened after positive BOS!
We need to see a strong reaction there, with good volume to go up!
Internal structure is showing reversals, but waiting for External Structure to confirm .
Over all, we are still in a bullish bias, this is a good area to start buying, but confirming a stronger signal is better to wait a daily candle closes above 209$ .
We can buy from here, and if continued to go down, the second buy Zone is between (82 to 105$)
Keep in mind this is daily analysis, don't leverage or over leverage!
and this is Technical Analysis, however Crypto could not follow over TAs, spicily if market updates on Fundamentals showed something.

Phemex Analysis $60: How to Trade SOL Amidst the FTX UnlockThe FTX’s decision to unlock 11.2 million SOL tokens (worth around $2 billion) at March 1st has sent shockwaves through the market. Fear of a potential sell-off has triggered panic among investors, leading to a sharp decline in SOL’s price from $200 to the $160 area.
With uncertainty in the air, traders are now asking: Will SOL continue its downward spiral, consolidate, or stage a strong comeback? In this analysis, we’ll explore three possible scenarios and how to trade them like a pro.
Possible Scenarios
1. Continued Downward Trend – More Selling Pressure Ahead?
Currently, SOL has dropped into the $165-$155 support zone, but if fear continues to dominate and selling pressure increases, further downside is possible. Key support levels to watch:
• $135-$126 – A critical demand zone where buyers may step in.
• $110 – A strong historical support level that could serve as a bottom.
For long-term investors, this could be an opportunity to accumulate SOL at a discounted price. However, for those who entered near $200, this scenario is less favorable.
Pro Tips:
• Use scaled orders to gradually enter the market instead of going all-in at once.
• Set limit buy orders around key support zones to secure an optimal entry.
• Monitor volume and Relative Strength Index (RSI)—if SOL becomes oversold on high volume, it could signal a potential reversal.
2. Bouncing Between $155 & $210 – A Range-Bound Market
While some traders fear a deeper decline, institutional buyers and long-term holders may step in to absorb the selling pressure. This could lead to a sideways trading range between strong support at $155 and resistance at $210.
Pro Tips:
• Use grid trading bots to capitalize on price swings:
• Start a long grid bot near the $155 support level to profit from rebounds.
• Start a short grid bot near the $210 resistance level to take advantage of pullbacks.
• If SOL repeatedly tests $210 but fails to break through, consider taking partial profits.
• Stay cautious—if the $155 support fails, be ready to adjust strategy for a deeper correction.
3. Breakout Rally – A Surprise Upside Move?
While less likely, a major bullish catalyst—such as the approval of a Solana ETF—could spark a breakout. If SOL gains regulatory or institutional backing, it may defy expectations and surge past resistance levels.
Pro Tips:
• Watch for a breakout above $210 with strong volume—this could signal a move toward $250+.
• Consider momentum trading strategies, setting stop-loss orders below $200 to manage risk.
• Stay updated on ETF-related news and broader crypto sentiment.
Final Thoughts
All eyes are on March 1st, when FTX’s SOL unlock event could bring heightened volatility. Whether SOL drops further, consolidates, or stages a breakout, traders need to stay alert and adjust their strategies accordingly.
• For bulls: Look for accumulation zones and wait for a confirmed reversal.
• For range traders: Take advantage of price swings between support and resistance.
• For breakout traders: Keep an eye on volume and fundamental catalysts.
No matter which scenario plays out, staying disciplined, managing risk, and reacting to market conditions is key to trading SOL like a pro.
🚀 How are you planning to trade SOL during this event? Drop your thoughts below! 🚀
Pro Tips:
Trade Smarter, Not Harder with Phemex. Benefit from cutting-edge features like multiple watchlists, basket orders, and real-time strategy adjustments. Our unique scaled order system and iceberg order functionality give you a competitive edge.
Disclaimer: This is NOT financial or investment advice. Please conduct your own research (DYOR). Phemex is not responsible, directly or indirectly, for any damage or loss incurred or claimed to be caused by or in association with the use of or reliance on any content, goods, or services mentioned in this article.

I am buying spot at this levelMy overall bias for Solana is bullish.
Solan price is dropping significantly at the moment probably due to Libra token. (just my guess).
I have set buy orders at $130-145 area. I don't usually buy the dip, but this might be worthwhile buy the dip opportunity.
