Solana Breaks Through $32 Resistance! $40 Next Target?
I have some exhilarating news to share with you today that will surely put a smile on your face. Solana has just made a groundbreaking move by surging past the $32 resistance level, signaling a strong bullish trend for our favorite cryptocurrency.
But that's not all! The momentum is building, and experts in the field are now eyeing the next target for Solana: $40! Yes, you heard it right. With the recent surge in value, Solana is on the verge of hitting this significant milestone, and the excitement is palpable.
Why is this such a big deal, you may ask? Well, Solana's impressive performance is a testament to its growing recognition and adoption in the crypto space. Its lightning-fast transaction speeds, low fees, and robust ecosystem have captured the attention of investors and developers alike. As a result, Solana's value has been steadily climbing, making it one of the hottest cryptocurrencies to watch.
Now, here comes the exciting part: I invite you to join the Solana revolution and seize this incredible opportunity. By going long on Solana, you can potentially reap the rewards of its upward trajectory. With the $40 target in sight, now is the perfect time to consider adding Solana to your investment portfolio.
Here's a quick call-to-action for you:
1. Research: Dive deeper into Solana's technology, its partnerships, and the latest developments. Understanding the fundamentals will help you make informed decisions.
2. Strategize: Evaluate your investment goals and risk tolerance. Consider consulting with a financial advisor or doing your own analysis to determine the best approach for your unique situation.
3. Take Action: Once you have gathered all the necessary information, take the leap and start your journey with Solana. You can purchase Solana on popular cryptocurrency exchanges like Binance, Coinbase, or Kraken.
Remember, investing in cryptocurrencies involves risks, but it also offers the potential for significant rewards. So, why not ride the wave of optimism surrounding Solana and potentially benefit from its upward momentum?
Solanaanalysis

📈Solana analysis, Weekly insight into price behavior📉BINANCE:SOLUSDT
COINBASE:SOLUSD
Hello Traders, please check out my previous ideas.
In the next few days, Solana is expected to stabilize between near the red area.
If the price breaks below the mentioned area, the price will drop to the level of 14$ (probably price receive support here) and then 13-12 area.
✌💥If you are satisfied with my analytical content, please share my ideas💥✌
✍🐱👤Otherwise, make sure you leave comments and let me know what you think.🐱👤✍
🤑🍾Thank you for your support. I hope you will gain profit by following my analyses.🍾🤑

Solana's Potential Breakout to $55 - It's Time to Long!
If you've been keeping an eye on the market lately, you might have noticed Solana's impressive performance. This blockchain platform has been making waves and gaining significant attention from both investors and traders alike. With its lightning-fast transaction speeds and low fees, Solana is proving to be a formidable competitor in the crypto space.
But what's got me truly pumped up is the recent price action and technical analysis surrounding Solana. The charts are indicating that SOL is ready to embark on a remarkable journey towards the upper target of $55. This breakout could be a game-changer for those who take advantage of the opportunity to long Solana at its current price levels.
So, why am I so confident about Solana's potential? Let's dive into the details:
1. Bullish Momentum: Solana has been exhibiting strong bullish momentum, with consistent higher highs and higher lows on the charts. This upward trend suggests that there is a growing demand for SOL, and the market sentiment is overwhelmingly positive.
2. Supportive Volume: The recent surge in trading volume for Solana is a clear indication of increased market interest. Higher trading volume often accompanies significant price movements, and it reinforces the likelihood of a breakout to the upper target.
3. Technical Indicators: Various technical indicators, such as moving averages and oscillators, are aligning favorably for Solana. These indicators suggest that SOL is currently undervalued and poised for a potential upward movement.
Now, here comes the exciting part - the call-to-action!
If you're as enthusiastic as I am about Solana's potential breakout, I strongly encourage you to consider taking a long position on SOL. By doing so, you'll be well-positioned to ride the wave of this anticipated price surge and potentially reap substantial profits.
However, as with any investment, it's crucial to conduct your own research and make informed decisions. Keep a close eye on the market, study the charts, and evaluate your risk tolerance before making any trading moves.
Remember, timing is key when it comes to seizing opportunities in the crypto market. So, don't delay! Take action now and position yourself for a potentially rewarding journey with Solana.
Feel free to reach out if you have any questions or if you'd like to discuss further trading strategies. Let's make the most of this exciting opportunity together!

Another Bolish position for Solana ...Another head and shoulders pattern on Solana's chart...and the possibility of another rally for Solana to around $32.20 .
In the previous analysis, Solana reached exactly the predicted growth with a similar pattern...
Everything is ready to increase the price of Solana.

Solana Looking for Rise in its Price! {22/10/2023}Educational Analysis says SOLUSDT may go Long according to my technical.
This is not an entry signal. I have no concerns with your profit and loss from this analysis.
Why Long?
Broker Binance
Although the SOLUSDT Market is in a downward trend on a daily time frame, On 4 hours it is making higher lows and higher highs.
So one trade is already on with RR is 1:4.85
Disclaimer
I HAVE NO CONCERNS WITH YOUR PROFIT OR LOSS.
Happy Trading, Fxdollars.

SOL's Potential Rise of 50% - Let's Ride the Wave Together!I hope this idea finds you in high spirits and ready for some exciting news! I couldn't wait to share with you the potential rise of SOL (Solana) that experts predict could reach an incredible 50% surge in the near future. It's time to buckle up and ride this wave of opportunity together!
SOL has been making waves in the crypto market lately, gaining significant traction and capturing the attention of traders worldwide. With its innovative blockchain technology and a growing ecosystem of decentralized applications, SOL has positioned itself as a serious contender in the cryptocurrency space. Now, with the potential for a 50% rise on the horizon, we have an opportunity to make some serious gains!
So, why should you consider going long on SOL? Here are a few key reasons:
1. Impressive Performance: SOL has shown remarkable resilience and consistent growth, outperforming many other cryptocurrencies in recent times. Its upward trajectory is a testament to its strong fundamentals and the growing confidence of investors.
2. Expanding Ecosystem: Solana's ecosystem is rapidly expanding, attracting various developers and projects. This growth indicates a promising future for SOL, as more applications and use cases are being built on its blockchain, driving demand and adoption.
3. Scalability and Speed: Solana's blockchain boasts impressive scalability and transaction speeds, making it an attractive choice for developers and users alike. This technological advantage positions SOL as a strong player in the race for mainstream adoption.
4. Positive Market Sentiment: Experts and analysts are buzzing with optimism about SOL's future potential, with many predicting a significant surge in its value. This positive sentiment can help propel the price even further, creating a favorable environment for traders.
Now that you're aware of SOL's potential, it's time to take action and seize this opportunity. I encourage you to consider going long on SOL, capitalizing on its upward momentum. However, as with any investment, it's essential to conduct your own research and make informed decisions based on your risk tolerance and investment strategy.
Remember, timing is crucial in the world of trading, so don't miss out on this potentially lucrative ride. Let's join forces and make the most of SOL's upward surge!

#sol #solana Mid/Long Term StrategyI like #solana as a powerful blockchain but my strategy is to buy #sol at discounted prices.
I must remind: THIS IS NOT A SHORT TERM STRATEGY.
+ Rising wedge in mid term (Bearish)
+ Elliott' s correction wave is not accomplished.
Breaking the upper box with weekly closings and volume is the INVALIDATION.
NOT FINANCIAL ADVICE.

SOL CHIEFbest time
The best place
The best area
the best candle
Currency performance
The best crypto
And this currency has always been the leader of all currencies with potential growth
Buy and enjoy

Solana SOLUSDT Analysis: On the MoveThe BINANCE:SOLUSDT pair currently finds itself ensnared within a firm downtrend channel, signaling a potential pullback from the channel's resistance line. However, the market remains on a precipice; a breakout from this confining channel could herald a significant upward move.
At its current price at $21.9, the asset stands at a crucial juncture. In the event of an upward surge, key resistance levels to watch out for include $22.0, $24.0, and $26.0. Conversely, if the price maintains its downtrend momentum, anticipated support levels lie around $21.0 - $20.5 or perhaps slightly lower.
Monitor the price closely, exhibiting patience and vigilance. Any breakout or breakdown from the current channel could yield noteworthy trading opportunities.
Stay tuned for further updates. 📈💹

SOL - 10/10/23SOL retraced right near the DEMAND $16 and then ran up to the SUPPLY at $24, now its making its way back to $20.77 area, I will be looking for a bounce here to move back up with it the chart is still bullish till $14 is broken!

Solana and the next climb...Solana and the next climb...
Solana prepares for the next move. Market conditions are more likely to rise. The next move up to the price of around $29...
In the previous analysis, Solana moved as predicted...

SOL forming a descending wedge to $29SOL made a a new high and now consolidating and getting ready for the new legup.Each rectangle has 3 points where are important, above the mid line , mid line and below the mid line. holding above it is bullish. midline is 50/50, below mid line is leaning towards bearish and more downside.
Cya guys at $29

Solana Skyrockets: Breaking Through Resistance with $30 TargetSolana, the blockchain platform known for its lightning-fast transaction speeds and low fees, has been making waves in the crypto market lately. Its recent surge in popularity is not without reason - Solana's innovative technology and impressive ecosystem have caught the attention of both investors and developers alike.
But let's talk about the breakthrough that has everyone buzzing. Solana's price has been on an unstoppable upward trajectory, and it has now successfully broken through the resistance level that has been holding it back. This is a significant milestone that signals a potential bullish trend ahead!
With this new target of $30, Solana is poised to continue its meteoric rise in the coming days and weeks. The market sentiment surrounding SOL is overwhelmingly positive, and this breakthrough could be just the beginning of an even greater surge.
So, what does this mean for you as a trader? It's time to seize this golden opportunity and consider going long on Solana! By taking a long position, you can potentially profit from Solana's upward momentum and ride the wave of its success.
Don't miss out on this exciting chance to be part of Solana's incredible journey. Here's your call-to-action: consider opening a long position on Solana (SOL) today and position yourself for potential gains. Remember, as with any investment, it's important to conduct your own research and make informed decisions.
Reach out to me with any questions or concerns you may have by commenting below. We're dedicated to supporting you on your trading journey and helping you make the most of this thrilling market opportunity.
Stay tuned for further updates on Solana and other exciting developments in the crypto space. The world of cryptocurrency is constantly evolving, and there's never a dull moment!

Solana to 7.Solana forming Bullish Flag and could make lower low. Our main target will be 7 but remember there are few area Solana still need to check before the bull run which are 3 red lines below 6.88.

SOLUSDT - Ready for big up move!SOLUSDT (4h Chart) Technical analysis
SOLUSDT (4h Chart) Currently trading at $19.50
Buy level: Above $19.40
Stop loss: Below $18.70
TP1: $19.8
TP2: $20.40
TP3: $21.20
TP4: $22
Max Leverage 3x
Always keep Stop loss
Follow Our Tradingview Account for More Technical Analysis Updates, | Like, Share and Comment Your thoughts

Solana (SOL) -> New Altcoin SeasonMy name is Philip, I am a German swing-trader with 4+ years of trading experience and I only trade stocks , crypto , options and indices 🖥️
I only focus on the higher timeframes because this allows me to massively capitalize on the major market swings and cycles without getting caught up in the short term noise.
This is how you build real long term wealth!
In today's anaylsis I want to take a look at the bigger picture on Solana.
During the year 2021 we saw a crazy rally of more than 25.000% on Solana and since the beginning of 2022 Solana perfectly dropped more than 90% towards the downside.
Following this overall long term pump and dump trend I do expect another crazy pump after Solana broke out of the current triangle formation.
- - - - - - - - - - - - - - - - - - - -
I know that this is a quite simple trading approach but over the past 4 years I've realized that simplicity and consistency are much more important than any trading strategy.
Keep the long term vision🫡

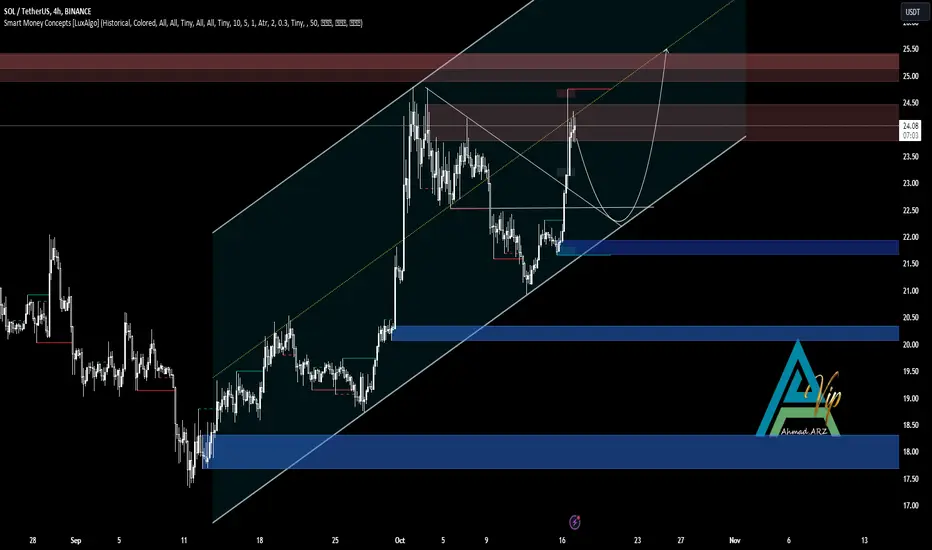
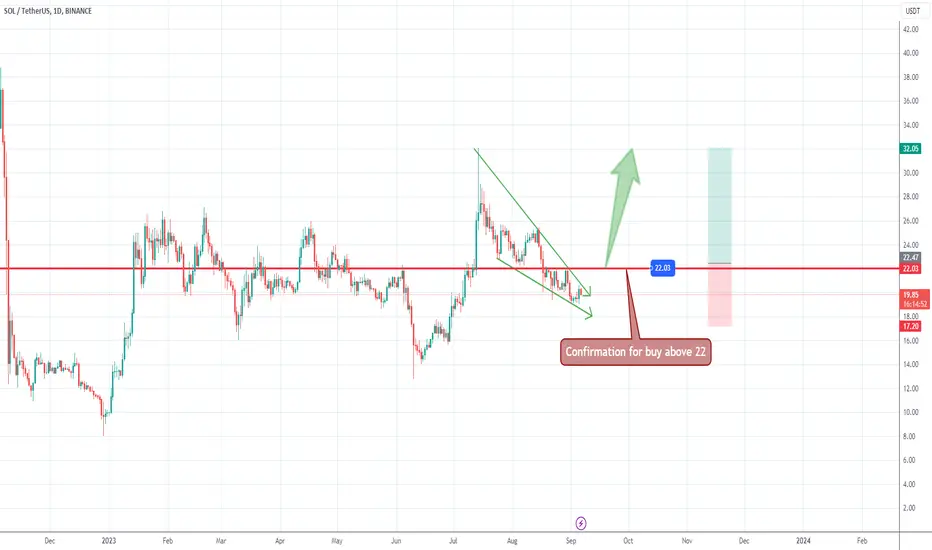
Solana- Steep falling wedge, but bulls need confirmationSince the high of the year above 30, SolUsdt started to drop and lost 30% of its value.
Now the coin is sitting on 20usd support and, considering yesterday's bullish engulfing and the steep falling wedge, it could reverse.
However, a clear confirmation comes only with the price above 22, in which instance, a rise to the 30 zone high becomes very probable.
SOL to the 27-28USDcIn the current scenario, where SOL/USDT (Solana against USDT) is forming a "bull flag" pattern, there has been observed a positive price movement that suggests a potential increase to the range between 27 and 28 dollars per SOL. The bull flag pattern is typically seen as a continuation pattern within the existing trend, which in this case could be an ongoing upward movement in Solana's price.
It is anticipated that the breakout from this bull flag pattern could lead to testing resistances at higher levels. This way, SOL could move towards the target range of 27 to 28 dollars per SOL. It's crucial to monitor whether this upward trend is supported by sufficient trading volume and investor interest.
In the event that the ascending trendline is breached, and SOL/USDT falls below this level, there is a risk of another downward move. This could result in disrupting the current upward trend and initiating another corrective phase downward. Therefore, it's important to keep an eye on price levels, trading volume, and technical indicators that might indicate the strength or weakness of the market movement.

Solana could drop to supportFrom the 7.5 back in December last year to the 32 high in mid-July, Solana has has a very good run with a gain of more than 400%.
However, after this recent high, the coin started to roll back down and now is trading at 21.32.
I believe more losses will come and we can see a test of 15 zone support.
I'm looking to sell rallies with negation above 27

SOLUSDTBINANCE:SOLUSDT SHORT
"Daily crypto market analyses I provide are personal opinions & not financial advice. Trading carries risks, so do your own research & seek advisor's help."
Don't forget to like and comment

Sol short scalp#sol will go down to retest blue line. Short scalp exists. This idea will become invalid if price goes above the redline

SOL/USDTThe price moves in a valid resistance range between bears and bulls. Considering the weakness in the CCI, I expect the price to drop to the $18 range and form a twin bottom pattern for the bottom of the channel and restore energy to reach the first target. DYOR
