Bullish Wedge on SolanaA bullish wedge breakout happening in Solana.
Also the price broke out from the channel as well.
If the price established above the 50MA and the trend line we can see further growth.
Targets are in the chart.
Solanaanalysis

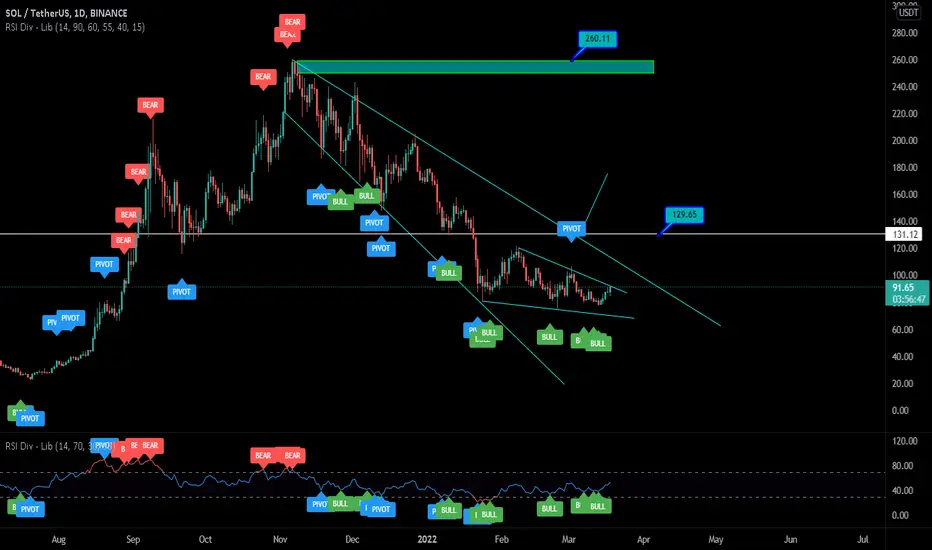
Solana (SOL) to $310 in Q3-2023 (continuation 2)This is an extension post about my previous idea that was well received. I'll post the initial idea down below as a related idea, for easy reading.
The bear pattern is officially broken and we have officially entered the bull market. The current trading at $109 is following my initial idea of a variation of the bullish falling wedge pattern. Using the Fibonacci Retracement indicator we can clearly see the that the 1.272 level of Fibonacci is our goal, that would be exactly $310.
The idea is that we'll see another long triangle stretch of a variation of a bullish falling wedge, that is if we break through the current bear pattern (which we just broke through as we speak).
As everyone knows, the war between Ukraine and Russia is bringing a lot of tension on the markets. These are uncertain times, and with uncertainty comes indecisiveness.
We're still in the phase of resistance, the very first step into the journey of acceptance. Google it, it's worth a read and applies to many concepts like crypto.
Believing that the cryptocurrency will grow in the future like it is doing now, people will keep on holding their cryptocurrencies with staking.
Banks and governments will ultimately have to bend and shape into the new era of digital economy, you see this happening everywhere.
Let me know what you think, thanks for reading.
Thumbs up to this post are sincerely appreciated.
~ Murkemur

SOL recovery 📈 SolanaSolana with a bounce at support @78. Strong bullish confirmation. Looking for upside with my next 3 targets listed.

Solana possible LONG target $127.5/$128Folks,
Here is the chart for Solana..
A possible buy around $109.. depending on how price action unfolds.
There is this possibility of a reversal because of the resistance we hit.. (double top)
The 1st reversal was minor and was bought up immediately and followed with 2 bull bars.
That is buying pressure. But still I want confirmation of higher probability and at least price to close around or above $109.
Always do your own due diligence.
Feel free to comment, share and hit the like and follow..

Emphasising last SOLUSD post
this chart emphasizes the above chart, we have been in a position like this before (purple rectangles)
Growth for Solana should be huge
A new indicator that im trying

SOL chart from a different perspective / Plan HNeedless to say, with this chart you can make millions of dollars

SOLANA LONGS ACTIVE 📉📉📉📉 Expecting bullish price action on SOLANA as price rejected an important area of institutional figure somewhere around 80.00 zone, a risk long entry should be from there. But a more conservative entry would be if price will go above the last highs that will shift the strucutre from bearish into bullish. BITCOIN is very bullish meaning altcoins could go higher because of that, fear/greed index and market seasonality tells us its the best time of the year to enter TRADES.
We also have a lot of bearish imbalances aka price inefficicency somewhere around 133 / 166 and price should be magnetized there
What do you think ? Comment below..

SOLUSDT FOR A BULL RUN!Looking at past data on Solana, we might be up for a bull run. Why?
Before the last bullish wave, price created a bull flag for a couple of weeks. With a continuous bounce at the $25 support level, the bullish impulse was aided until price got to the ATH at $260.
Now, price has continued to face bearish movements in this bear market. Lower highs and lower lows continued to form, showing us a clear downtrend since November 2021. We now have Solana bouncing off the $80 level. Price has now formed a double bottom, and this support level could really be holding. Logically, this looks like a good dip. Picking up Solana at $80-$90 is a huge discount before the next bull run, as we could see a new ATH at $600. I'm longing Solana here, and I think you should too.

sol looking for a breakoutsol is looking great to accumulate down here,
could potentially be close to breaking the down trend
hope u got in when i posted a week earlier
did solana get to 500 $ ?Solana now in Goood price for investing
this is an irreplaceable opportunity

Solana SOL Long Setting After A Long Time In My Calculation Solana Can Bounce Back From Here. Remember this Chart is Valid Only If BTC stay Stabile..
I am Not A Financial Adviser. And All Cherts Are Just My Study. So Please Do Your Own Search before open Any Trade.
If You Like My Work Just Come and Join Me.

SOL Trade Idea 15 minSOL trade Idea, Low volume due to it being Saturday however breakout potential. Looking to play retest of the breakout. Higher time frames gonna push this trade bullish. Posted this idea before but bulls were weak af and we got 2 big 15 min wicks so its gonna keep playing out side ways for now. Could breakout either way.

SOL 30 Min PennantSOL trade Idea, Low volume due to it being Saturday however breakout potential. Looking to play retest of the breakout. Higher time frames gonna push this trade bullish.

SOLANA Daily Analysis Update🟢 SOLANA broke out from long-term downward resistance and confirmed it as support. now price touched the ascending support. if the price holds the current support and heads up it can shape a reverse head and shoulders to reach a resistance zone between110$ and 120$.
in long term, it is possible to reach 0.5 and 0.618 fib levels of Fibonacci from swing low.
breaking down from ascending support, can drop the price to next supports around 70$ and even 45$.
⚠ This Analysis Will be Updated.
📆0.3.05.2022
✍ Analyzed By Amirhossein
⚠ DYOR

SOLANA PERP Well on this idea I'm looking to go Long only if two resistance don't get take out..but for now I'm just neutral

Solana (SOL) to $310 in Q3-2023Hello everyone,
I've been studying the market for a long time, about 15 years now. Cryptocurrencies have been in my portfolio since 2015.
In my time of analysis I've noticed multiple trends in long term, they seem to be reoccurring through all cryptocurrency. They're either different styles of bear/bull wedges or flags .
Lately I've been thinking about the possibility of another bull wedge or bull flag in the long term, the shape is merely beginning, hence the possibility of this idea.
The idea is that we'll see another long triangle stretch of a variation of a bullish falling wedge , that is if we break through the current bear pattern.
I've calculated that we by Q3-Q4 of 2023 we'll see a new ATH of Solana, around $310 .
As everyone knows, the war between Ukraine and Russia is bringing a lot of tension on the markets. These are uncertain times, and with uncertainty comes indecisiveness.
We're still in the phase of resistance , the very first step into the journey of acceptance . Google it, it's worth a read and applies to many new concepts like crypto.
Believing that the cryptocurrency will grow in the future like it is doing now, people will keep on holding their cryptocurrencies with staking.
Banks and governments will ultimately have to bend and shape into the new way of digital economy, you see this happening everywhere.
Let me know what you think, thanks for reading.
~ Murkemur

SOLANA (SOL) | Let's Try To Use Psychological Break!Hi,
Not much a criterion or something but the odds should be in our favor. A full Daily close above the round number/above the psychological number $100.
The break occurred with a kind of low volume so, do not go all-in :)
Considering current situations then the major target is TP1 and the invalidation area is marked with red - Daily candle close inside or below the marked zone will gut the trade.
Do your own analysis and trade cautiously.
Regards,
Vaido

SOL. 15 Feb. 13, 14 - Watching fed Meeting Reaction15 min chart of SOLUSD looking at the FEB 14 Valentines day FED meeting anticipation and reaction. Good day trading day.

SOL Solana: 1D Chart ReviewHello friends, today you can review the technical analysis idea on a 1D linear scale chart for Solana (SOLUSD).
The chart is self-explanatory. The price is in a Descending Channel and very close to the multi-month Support Line. There was a recent Death Cross (50/200 SMA cross) on the 1D Chart, which is bearish. The RSI and MFI are moving upwards on the support line. Volume is decreasing. Keep a close eye on the RSI and MFI support and resistance line. If price moves up, there may be resistances of the EMA Ribbons and Ichimoku Cloud.
Included in the chart: Trend line, Support and Resistance Lines, Ichimoku Cloud, Volume, RSI, MFI (Money Flow Index), Descending Channel, EMA Ribbons, and 50 and 200 Simple Moving Average.
If you enjoy my ideas, feel free to like it and drop in a comment. I love reading your comments below.
Disclosure: This is just my opinion and not any type of financial advice. I enjoy charting and discussing technical analysis. Don't trade based on my advice. Do your own research! #cryptopickk

SOLUSD Solano - 24 full chart pattern -i tried the Publish video idea and recorded the whole process but i must have done something wrong. I saw someone yesterday who had used it successfully so i will try again. This is the chart i created for that video. Im going to zoom in and try the video again at smaller levels. Im interested in buying more of this coin. I am just curious about its sustainability. The internet seems mixed. Any ideas out there please join in. Yes i chart weird. I am an artist, this is a process i sed to examine closely the details and patterns emerging. Right now i am marking the anticipation of the FED, I want to see what pattern they create, if they are smart they are making money on their own waves. But that remains to be seen, technically their current solution is spend more and devalue the dollar with inflation . Archaic systems are not changing properly, the correction may need to be physical shifts.

SOL inside parallel channel#SOL/USD
$SOL is trading inside ascending parallel channel, and rejected from upper line of channel.
🐻 there is a support zone that is the same with middle line of parallel channel around $110, that price possible to head down to touch it.
🐻🐻 break down from middle line will drop price to lower line of channel around support of $100.
🐮 if price success to break out from upper line it will head up to touch resistance zone between $130 and $135.

Solana can rise to 130-135 resistanceAfter dropping from November's 260 high to 80 low at the end of January, Solana, like all crypto market, has started to recover and now is trading above 100 important figure.
I expect this rebound to continue and we can see SolUsd challenging 130-135 resistance.
I'm bullish as long as 100 holds and dips towards this zone should be bought in search of a good r:r.
A drop under 90 would negate this scenario

SOLANA short- a lot of coins look bearish and are due a move down after a small rally today
- POI & TPs all marked on chart
- do what you will with this...
any feedback appreciated
