TradeCityPro | JUP Eyes Breakout as Altseason Momentum Builds👋 Welcome to TradeCity Pro!
In this analysis, I want to review the JUP coin for you. It’s one of the projects in the Solana ecosystem, currently ranked 59 on CoinMarketCap with a market cap of $1.65 billion.
📅 Daily Timeframe
On the daily timeframe, this coin is currently sitting below a very important resistance zone at 0.6312. This is a strong resistance area and serves as the main trigger for a trend reversal in this coin.
✔️ The main support floor for JUP is located at 0.3409, a level price has tested twice before. Now it has returned to 0.6312, and we can see increased market volume at this level, which indicates tension between buyers and sellers.
✨ A breakout of 0.6312 would be a good trigger for a long position, and I plan to open a long if this level breaks. This could potentially be a long-term position with a high risk-to-reward ratio.
🔔 The next major resistance zones are at 0.7858 and 1.1435, which we can use as targets for this position.
🔽 If the price gets rejected from the top and moves down, breaking 0.4186 and 0.3409, we can look to open a short position.
🧩 The break of 0.3409 would confirm the start of a downtrend, and it's one of the key zones where I’ll definitely look to hold a short position if it breaks.
📝 Final Thoughts
This analysis reflects our opinions and is not financial advice.
Share your thoughts in the comments, and don’t forget to share this analysis with your friends! ❤️
Solanaecosystem

20:1 R:R for SolanaTaking a chance on this super high-risk setup with a 20:1 R:R before it takes off.
Entry: 177.78
Stop Loss: 173
Target: 260

KAMINO: looks like is a breakoutThis breakout on daily timeframe looks pretty clean although the volume isn't picking up much.
Even on higher timeframe the compression of the price over the last weeks and the current breakout are visible:
So far KAMINO has done well during the "bad times" of the cycle, I expect great things once the liquidity starts to flow into crypto and alts starts flying.
I hope anyone has a bag of this. Thank me later.
Good luck!

Breaking: $PENGU Spike 33% Today Gearing For Another Leg UpThe price of Pudgy Penguins ( CSECY:PENGU ) a solana based NFT platform similar to Magic Eden saw notable uptick of 33% today, reclaiming $600 million market amidst breaking out of prolong oversold levels.
About
PENGU is the official coin of Pudgy Penguins.
Pudgy Penguins has become the face of crypto with one of the most influential communities in the industry. From large companies wearing the Penguin, to being featured in ETF commercials, to garnering millions of followers and over 50 billion views, the Pengu has become a cultural icon.
Technical Outlook
Since listing, CSECY:PENGU has seen a notable uptick of +2,000% before sharply consolidating losing about 94% of market value. Present market metrics hints at a possible move to the $0.0266 resistant point and a break above the ceiling of that pivot would spark a move to the ATH recorded.
With the RSI at 73, CSECY:PENGU is looking to capitalize on the dip and make a comeback, with all present metrics hinting at a bullish reversal to the ATH territory.
Pudgy Penguins Price Data
The Pudgy Penguins price today is $0.008763 USD with a 24-hour trading volume of $379,038,248 USD. Pudgy Penguins is up 31.78% in the last 24 hours. The current CoinMarketCap ranking is #107, with a market cap of $550,838,659 USD. It has a circulating supply of 62,860,396,090 PENGU coins.

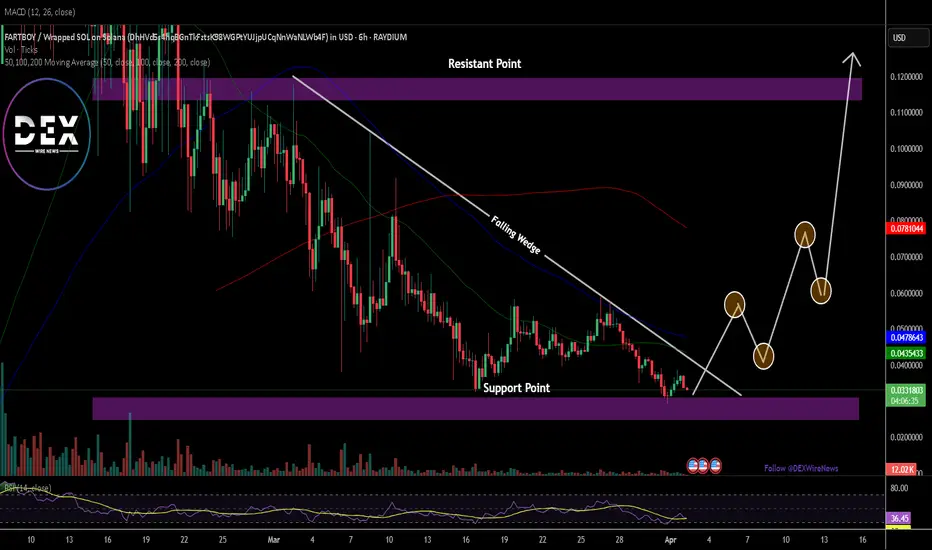
Breaking: $FARTBOY Gearing for 250% Surge Amidst A Falling WedgeThe price of Fartboy coin ($FARTBOY) a token created on the Solana ecosystem is set to go parabolic surging more than 250% amidst breaking out of a falling wedge pattern. The asset is currently looking poised to breakout of the support point range it is currently trading at.
Since listing, $FARTBOY has peaked to as high as $189 million in market cap before retracing to the $33.4 million market cap. With build up momentum, $FARTBOY is set to pull out this same stunt in the long term.
Further solidifying this bullish thesis is the Relative Strength Index (RSI) at 36.68, this metric gives credence to our bullish speculation giving Fartboy more room to capitalize on the oversold nature and weak momentum to pick liquidity up.
About Fartboy
Project is CTO'd by big community over 100k people. X is on 2k followers in 2 days. In talks with some big exchanges hope to get listed everywhere.
This coin was called out via a call out group. People were loving it and then one of the guys who were invested before we even knew about it dumped on us. If you check the chart im sure youll see we made a heck of a comeback!
Fartboy Price Live Data
The live Fartboy price today is $0.033473 USD with a 24-hour trading volume of $669,858 USD. Fartboy is up 0.92% in the last 24 hours, with a live market cap of $33,454,631 USD. It has a circulating supply of 999,440,457 FARTBOY coins and a max. supply of 999,440,457 FARTBOY coins.
Breaking: Solana Tanking HardSolana often referred to as the Ethereum killer is tanking hard albeit Bitcoin also dipped to the $79k zone. Designed to facilitate decentralized app (DApp) creation, aiming to improve scalability by introducing a proof-of-history (PoH) consensus combined with the underlying proof-of-stake (PoS) consensus of a blockchain, SOL has been building a scalable network with massive growth noticeable in its ecosystem.
With Selling pressure increasing, Solana could be on the brink of a massive selling spree with support pegged to the $110-100 pivot points.
However, should Solana bounced back and break pass the 78.6% Fibonacci retracement point, a trend reversal is inevitable. With the RSI at 35, a little shift to a 45 point in RSI could be all what Solana needs to catalysed a bullish breakout.
Solana Price Live Data
The live Solana price today is $124.43 USD with a 24-hour trading volume of $4,578,943,167 USD. Solana is down 6.54% in the last 24 hours, with a live market cap of $63,337,175,317 USD. It has a circulating supply of 509,018,387 SOL coins and the max. supply is not available.

JUPITER ($JUPUSD)—SOLANA’S DEFI STAR SHINES?JUPITER (JUP)—SOLANA’S DEFI STAR SHINES?
(1/9)
Good morning, X! Jupiter (JUP) is buzzing 💸 $ 3.7B Nov ‘23 volume, $ 1.07 price 🌍 Q1 ‘25 let’s unpack this crypto contender!
(2/9) – VOLUME HUM
• Nov ‘23: $ 3.7B—Solana DEX lead 💡
• Jan ‘25: $ 3M revenue—fees stack 📊
• Supply: 1.35B JUP—$ 1.45B cap 🌟
JUP’s hauling—Solana’s DeFi engine!
(3/9) – CASH GLOW
• Fees: 500K−650K daily—Ultra Mode 🚀
• Buyback: 50% fees snag JUP—locked 🌞
• Price: $ 1.07—down 65% from $ 1.85 💎
JUP’s cash flows—steady grind!
(4/9) – BIG MOVES
• Buyback: 16M+ JUP/mo.—supply shrinks 📈
• Sanctum: SOL debit card—real spend 🌐
• Features: DCA, futures—DeFi zip 🚗
JUP’s stretching—crypto’s toolbox!
(5/9) – RISKS ON TAP
• Delay: Mainnet lags—Q1 ‘25 wobbles ⚠️
• Control: Team grips—central snag 🔒
• Comp: Uniswap bites—tight race 📉
Hot buzz—can it dodge the traps?
(6/9) – SWOT: STRENGTHS
• Lead: $ 3.7B vol.—Solana champ 💪
• Cash: $ 3M Jan—fee beast 🏋️
• Tools: Swap, futures—steady juice 🌱
JUP’s a DeFi hauler—built tough!
(7/9) – SWOT: WEAKNESSES & OPPORTUNITIES
• Weaknesses: Token lock, 65% drop—eek 🙈
• Opportunities: Buybacks, Solana lift—zing 🌏
Can JUP vault past the snags?
(8/9) – JUP’s $ 1.07 buzz—what’s your take?
1️⃣ Bullish—$ 3+ stacks up 😎
2️⃣ Neutral—Solid, risks linger 🤷
3️⃣ Bearish—Dips below $ 0.63 😕
Vote below! 🗳️👇
(9/9) – FINAL TAKEAWAY
JUP’s $ 3.7B vol and $ 1.07 price pile up—Solana hauler 🪙 Buybacks spark, risks loom—gem or bust?

TradeCityPro | WIF: Diving into the Dynamics of a Popular Meme👋 Welcome to TradeCityPro!
In this analysis, I want to examine the coin WIF, which you requested in the comments. This project is one of the famous meme coins in the crypto world, operating on the Solana network, and it has a market cap of $655 million, ranking it 105th on CoinMarketCap.
📅 Daily Timeframe
In the daily timeframe, we are witnessing a downward trend that started from a high of 3.9560 and has continued down to 0.5852. The market volume has also converged with the trend, indicating that the selling pressure has been much stronger than buying.
❌ If you previously purchased this coin, you should have set a stop-loss after the price stabilized below 1.3886. However, if you haven’t done this yet, I cannot specify a stop-loss area for you now because there's a significant support area at 0.4464, and we need to see how the price reacts to this area.
🛒 If you're looking to buy this coin, first of all, I should mention that purchasing meme coins is very risky, and I personally neither buy meme coins nor recommend buying them. But if you want to buy this coin, you should wait for a trend reversal. For a trend change, we need a new structure to form and a suitable trigger to confirm the trend change.
🔼 If the price breaks 0.5852 and the RSI enters the oversold area, we could open a very good long-term position. A break of 34.36 in this indicator gives us the first confirmation of entering bullish momentum, but this confirmation is not reliable at all and only serves to confirm futures triggers.
⏳ 4-Hour Timeframe
In the 4-hour timeframe, I want to specify the futures triggers for you. We also have an interesting ascending channel, to which the price has reacted very well so far, and breaking this channel from any side could provide a good position.
🔍 Currently, it seems there's a range box between 0.5734 and 0.7803, which has timed the price's move from the box's floor to its ceiling.
📈 For a long position after the channel break, you can enter with a trigger of 0.7803 targeting 1.0411 and 1.345, but keep in mind that we've had a very strong downtrend, and this position is against the trend.
🔽 For a short position, our trigger is very clear, and if 0.5734 is broken, you can enter, and your target could be the bottom of the channel.
📝 Final Thoughts
This analysis reflects our opinions and is not financial advice.
Share your thoughts in the comments, and don’t forget to share this analysis with your friends! ❤️

Solana Analysis Solana Analysis
Solana is currently finding robust support on the daily chart, as indicated by the significant impact of the recent bearish trend that has dominated the cryptocurrency market over the past week. A rebound towards a bullish trend is anticipated, as the asset has recently bounced off this strong support level.
Please note that this is my personal analysis and should not be construed as financial advice to invest in or purchase this asset. It is crucial to exercise your own judgment and conduct thorough research and analysis prior to making any investment decisions.
Trade cautiously and ensure you fully understand the associated risks before executing any trades
Cheers!!

TradeCityPro | HNT: Key Support & Potential Breakout Levels👋 Welcome to TradeCity Pro!
In this analysis, I will review the HNT coin. This project is part of the Web & IoT sector and operates within the Solana ecosystem.
📅 Weekly Timeframe
In the weekly timeframe, we can see a consolidation box that formed after a strong upward leg. The bottom of this box is at $3.007, while the top is at $9.696.
🔍 A curved trendline is also visible, which previously supported the price from $1.226 to $9.696. However, this trendline was broken, triggering a downward move. As a result, selling pressure increased, leading to a decline towards the bottom of the consolidation box.
🔽 Currently, the price is at a critical support level that could determine the trend for the coming months. If RSI stabilizes below 36.52, it would indicate strong bearish momentum, increasing the likelihood of a break below $3.007.
⚡️ If this support level is broken, the market structure will change, and the price could drop further to the $1.226 support level.
📈 If the price rebounds from this support and starts forming a bullish structure, the most important breakout trigger will be at $9.696. If this level is broken, the next upward leg could begin, with a target of $30.787.
📅 Daily Timeframe
In the daily timeframe, we can observe the latest price movement in greater detail.
💥 After reaching the $9.210 resistance and facing rejection, bearish momentum intensified, causing the price to decline sharply in a waterfall pattern, dropping to $3.177.
🔑 In waterfall declines, a trendline usually forms, and breaking this trendline typically ends the move, leading to a range-bound phase. Therefore, if the price breaks this trendline, I expect the downward leg to end. Confirmation could also come from RSI breaking above 43.18.
📉 For short positions, an entry can be considered if the $3.177 support breaks. If this happens, stronger bearish momentum could push the price toward the $2.104 support level. However, I believe that if the price ranges and consolidates above $3.177 before breaking down, the short setup would be more reliable.
🔼 For long positions, no clear structure has formed yet. We need to wait for price action to develop and provide valid entry triggers.The first potential trigger is at $4.220, followed by $5.474.However, these levels could shift if a new price structure forms, so I recommend waiting for updated triggers before entering a long position.
📊 Market volume analysis shows that selling volume dominates, with large red candles exceeding the size of green candles during corrections. This suggests that sellers currently control the market momentum.
📝 Final Thoughts
This analysis reflects our opinions and is not financial advice.
Share your thoughts in the comments, and don’t forget to share this analysis with your friends! ❤️

TradeCityPro | RAY: Key Levels and Market Scenarios Unfolding👋 Welcome to TradeCity Pro!
In this analysis, I’ll be reviewing the RAY coin, which belongs to the Raydium project—one of the leading DEXs on the Solana network, processing a significant volume of transactions on the chain.
📅 Weekly Timeframe
On the weekly chart, we observe a strong uptrend that began at 0.162. The first leg of this rally pushed the price to 2.724, followed by a correction, and then another leg extending to 7.215. Currently, the price is consolidating near this resistance level.
🔍 The 7.215 level coincides with the 0.618 Fibonacci Extension, making this a crucial Potential Reversal Zone (PRZ). If this level is broken, the next bullish leg could begin, with a minimum target of 15.803. The next major resistance aligns with the 1.0 Fibonacci level at 21.995. If the uptrend continues beyond this point, further targets will be identified in future analyses.
🕯 On the downside, considering the declining volume and shrinking candlestick size, the probability of a correction is notable. The first support level to watch is 2.724. Additionally, the RSI is hovering near a critical support at 58.34—if this level breaks, the likelihood of a correction increases.
🔽 The next and most significant support level is 0.94. If the price falls below this point, it could signal a shift in the high-wave cycle, leading to a significant downtrend.
📅 Daily Timeframe
On the daily chart, the latest bullish leg started at 1.399 and extended to 6.363. The price is currently ranging between this resistance and the 4.352 support level, which also aligns with the 0.236 Fibonacci retracement, making it a key PRZ in this timeframe.
✨ Yesterday’s candlestick showed a sharp downward move accompanied by panic selling, followed by a recovery back toward the 6.363 resistance.
🔼 For a long position, the first breakout trigger would be 6.363, which I consider the primary trigger. The next breakout level is 8.090, but this was formed due to a fake move. If you miss the breakout above 6.363, you could consider entering upon the breakout of 8.090.
📉 However, yesterday’s volatility liquidated many long positions, causing significant fear among buyers. As a result, there are currently fewer buy orders in the support zones, which could allow the price to continue its downward move.
📝 Final Thoughts
This analysis reflects our opinions and is not financial advice.
Share your thoughts in the comments, and don’t forget to share this analysis with your friends! ❤️
If the RSI breaks below 38.94, the probability of a corrective move increases. In such a scenario, the price could retrace to key Fibonacci levels such as 0.382, 0.5, and 0.618. A deeper correction could lead to the 2.724 support level, and if this level breaks, the market trend could turn bearish for an extended period.

We're off to a great start SOLANAWe're off to a great start SOLANA
🚀 Trade with the professionals of THS - Wave Theory!
🔹 All trades are based on wave analysis.
🔹 Fixed stop loss and take profit for risk management.
🔹 100% automation: copy trades through CopyFX service.
🔹 Reliability and transparency: the results are confirmed by the market.
📈 Don't miss the chance to earn steadily!
👉 Connect to CopyFX with THS and start copying profitable trades right now!
💡 Details on our channel and in the app!
BUYThe price retraced to $0.009 at Fib 0.5 level and consolidated for 10 days. Yesterdays daily candle closed above Fib 0.236 which is the last line of defence for the bear. Today, the price is moving up decisively. Daily momentum indicators also support the bullish momentum.
I bought some when the price broke above the previous month high.
I like both the fundamentals and technical setting of Kwant at the moment. I plan to hold it until the daily MACD or RSI start to form negative divergence.

Solana Ideathis pair has formed a descending channel and broke it
now has retested it so we're entering a buy position
follow us or more ideas and analysis

SOLANA - 900% profit?main idea:
An upward momentum is forming.
At the moment we are in the corrective 4 wave, if we look at the daily candlestick signal, we can assume that we have completed it.
Further I expect growth and formation of the 5th wave, which completes the whole impulse.
The growth target is the area of 656.00 - 1380.00$.
In percentage ratio 400 - 900%. Quite impressive figures.
I'm going in to buy.
I'm targeting maximum targets
As it approaches the designated area, I will keep a close eye on it, so as not to miss the reversal and fix the profit.
Stop - below 121.81
SL/TP ratio - 1/70.
P.S. - who is with me, click on the rocket and subscribe.

$me magic eden $MEUSDmoving forward i am bullish on magic eden... we are traveling in a nice uptrend in a nice channel.... we currently have a fib resistence at $3.77 which i personally think we will retest before the weekend is over...the channel support line is in the low 3.20's if you are looking to add on a pullback...as we approach the $3.776 range keep an eye on !total to see what the marketcap is doing.... if btc dominence is going down and money is flowing into alts, i expect volume to pick up as we push thru the resistence area. if marketcap starts to drop though i can see the price here coming back down to retest the $3.12 current swing low that was created last week. Price for this token dumped hard after an initail luanch of the token sent out 1,000s to some holders, which where dumped onto the market....a lot of investors into this project tho are staking as many coins as possible to maximize the sites rewards. lockup period is thru mid march to end of march....Stay tuned as i will keep you updated on this chart. Give me a like and follow....Share on X.com also if you like my TA and have found it helpful. Thanks

Solana (#SOL): current situation and future prospectsSolana (#SOL): current situation and future prospects
Current Price: The SOL price level remains volatile, reflecting the overall market sentiment.
Trading volume: After a period of low activity, volumes are starting to gradually recover.
Technical Analysis: The price is approaching key support and resistance levels. It is important to keep an eye on the areas around TSXV:XX (depends on the current price) to confirm further direction.
📈 Outlook:
Solana continues to grow the ecosystem and attract new projects. Several factors could influence the future of the cryptocurrency:
Fundamental potential: The Solana network is actively used in DeFi, NFT and other areas. An expanding ecosystem will keep interest in the token alive.
Updates and improvements: Constant updates to the network make Solana competitive with other blockchains.
Investor interest: Increased institutional interest in Solana could be a driver of price appreciation.
⚡ Trading strategy:
Short-term: Given the volatility, SOL is suitable for active traders. Keep an eye on support/resistance level breakouts and trading volumes.
Long-term: For investors with a 1-2 year horizon, Solana remains a promising asset, especially if the cryptocurrency market enters a growth phase.

TradeCityPro | JUP : Prepping for a Breakout👋Welcome to TradeCityPro!
In this analysis, I’ll be reviewing the JUP coin. This token is the native token of the Jupiter project, part of the Solana ecosystem, and operates in Solana’s DeFi space.
📅 Daily Timeframe: Breakout from the Box?
In the daily timeframe, we see a long-term box pattern ranging from a bottom at $0.6818 to a top at $1.2542, with the price currently at the upper limit of the box.
🧩 A rising trendline is also visible, with the price touching it three times so far, each time being pushed upwards.
📊 Buying volume has been increasing from the bottom of the box, and now, after reaching the resistance at $1.2542, the reducing volume during the correction indicates the strength of the trend.
🔼 If $1.2542 is broken, the next resistance level will be at $1.7463. Upon breaking $1.7463, it is highly likely that a new all-time high (ATH) will be achieved.
✨ The RSI indicator also shows a rising trendline, and as long as the price remains above this line, the momentum is considered bullish. If 63.41 on the RSI is broken, stronger bullish momentum is likely to enter the market.
📉 In a correction scenario, if the price trendline and the RSI trendline are broken, the first target will be $1.0289, and the second will be $0.8625.
⏳ 4-Hour Timeframe: Futures Triggers
In this timeframe, we can observe the price action in more detail.
📈 If $1.2542 is broken, the price can move towards $1.4619. This trigger looks highly favorable, and I will personally attempt to open a long position if the price stabilizes above this level.
🔽 For short positions, you can consider entering after the trendline and $1.0441 are broken, although I personally avoid opening short positions in the current market conditions.
🔑 As long as the RSI remains above 50, the likelihood of breaking $1.2542 increases.
📝 Final Thoughts
This analysis reflects our opinions and is not financial advice.
Share your thoughts in the comments, and don’t forget to share this analysis with your friends! ❤️

WEN: another awakening patternIf you follow me "somewhere else" you saw all those other alts on which I've identified an ascending triangle. Such pattern forms when chart prepares for a break out after a period of dumping/ranging.
I don't believe in memecoins, at least I think they're on the same level of betting which makes them a bad investment. However this one is the only I have faith into. He has been fairly distributed to JUP users, it can count on a community which is alive and is accomunated by JUP, it's in the Solana Ecosystem which is currently the #1 for alts (alts and meme). I've read somewhere the token doesn't have many whales but I'm not sure about this.
However, I got airdropped some and I bought some more. I tried buying 3 more meme in the past and it always went bad. I hope this one, considering the FA it'll go well.
Meanwhile I think FA is on our side. Still a good buy IMO.
Good luck!

PYTH still hasn't awakenedPYTH has not awakened yet despite the entire Solana ecosystem has been pumping following SOL itself. It's weird because we all expect it to be the new LINK. I wanna believe it will start late but will catch up.
I drawed the trendline and the resistance zone to show you that price is currently into a sort of ascending triangle. I'll consider this alts awakened when price will break out that resistance zone up there.
As you can see from weekly chart the recently closed candles was a bullish engulfing one, hopefully this is a sign price will hit the resistance soon although to be honest, on daily timeframe there's a clear bearish DIV on RSI
With current market cap around 1.5 bn PYTH can easily do 10x from here and this is a conservative target. I have a small bag already but I it's still in buy zone.
NOTE: this is a mid to long term TA.
Good luck

Solana Surpasses ETH in Daily Fees What’s Fueling SOL’s MomentumIn a significant milestone, Solana ( CRYPTOCAP:SOL ) has overtaken Ethereum in daily transaction fees, raking in over $4.1 million. The driving force behind this surge is the newfound popularity of AI meme coins, which have spurred a wave of network activity on Solana ( CRYPTOCAP:SOL ), positioning the blockchain for further growth.
AI Meme Coin Craze Propels Solana to New Heights
The meme coin frenzy, spearheaded by tokens like Goatseus Maximus (GOAT) has been the key catalyst for Solana’s recent surge. GOAT has skyrocketed by 40%, reaching an all-time high of $0.7009, with its market cap soaring past $700 million in just two weeks. GOAT, which gained popularity through promotions by AI bot ‘Truth Terminals,’ highlights how AI and meme coins have captivated the crypto community.
This trend is not isolated, as more AI-driven tokens like MEW, POPCAT, PYTH, and RAY are also showing strong performance. These five tokens have gained traction on Solana, with double-digit percentage increases in just a short time. This surge in popularity has made Solana the go-to platform for launching these new-age meme coins, significantly boosting its network revenue.
Solana’s Rise to the Top
Solana’s success isn’t limited to AI meme coins alone. Over the past month, Solana ( CRYPTOCAP:SOL ) has consistently outperformed other top cryptocurrencies like Bitcoin (BTC) and Ethereum (ETH), with SOL gaining 18% in value. At press time, SOL is trading at $174, with a market cap of $82 billion, firmly securing its place among the top five cryptocurrencies according to CoinMarketCap.
Analysts are bullish on Solana’s future, with some predicting a parabolic rally that could push the SOL price toward its all-time high of $2,000. Data from Coinglass shows that open interest in Solana ( CRYPTOCAP:SOL ) has surged by 13.7%, reaching $3.4 billion, while derivatives trading volume has increased by 25% to $9.54 billion in the past 24 hours. These figures suggest that more institutional money is flowing into Solana, setting the stage for a continued price rally.
Technical Outlook: A Bullish Run for SOL?
From a technical perspective, Solana’s price action shows bullish momentum, with CRYPTOCAP:SOL up by 2% at the time of writing, trading above key moving averages. The daily candlestick chart displays a bullish engulfing pattern, a strong indicator that the uptrend could continue. However, the RSI stands at 70.87, signaling that CRYPTOCAP:SOL is approaching overbought territory, which warrants caution. A consolidation phase could see CRYPTOCAP:SOL pull back to the support level of $145.
Nevertheless, market sentiment remains positive, with many analysts pointing out that Solana, like most altcoins, often mirrors Bitcoin’s performance. If BTC shows strength in the coming weeks, CRYPTOCAP:SOL could test the $200 resistance level, potentially paving the way for new highs.
Conclusion
Solana’s ability to surpass Ethereum in daily fees underscores its growing importance in the crypto ecosystem. As the blockchain continues to dominate the AI meme coin space, it is likely to attract more developers and projects to build on its platform. With robust technical indicators and a supportive fundamental outlook, Solana ( CRYPTOCAP:SOL ) is well-positioned for sustained growth, making it one of the top contenders in the Layer-1 blockchain space.
Solana’s recent surge and the attention it’s receiving from traders, developers, and investors alike could mark the beginning of a new era for the blockchain. While caution is warranted due to its current overbought levels, the long-term potential remains significant. As the AI meme coin craze continues, Solana ( CRYPTOCAP:SOL ) is set to remain in the spotlight, with its price action likely to captivate the market in the weeks ahead.

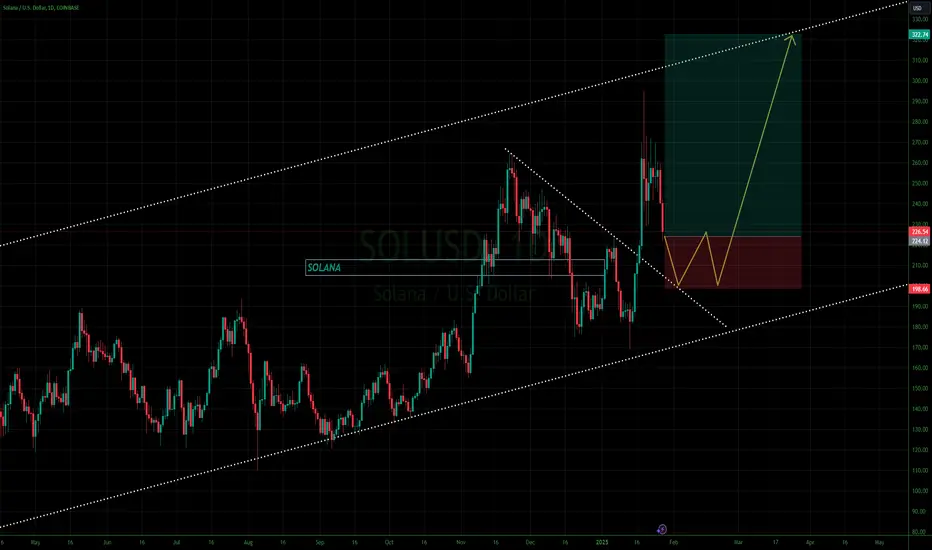
SOL is attempting to break outCurrently SOL is trying to break out from a big asymetrical triangle that could also be some sort of handle of a giant cup. The weekly close is still far from closing so we have to wait to be sure but in a red market this is a good sign.
Weekly chart:
If the break out happens the final target for this leg should be 300 USDT with resistances at 205 and 260.99. When this happens the entire Solana ecosystem should follow.
Good luck

BONK’da Heyecan Verici Simetrik Üçgen!BONK grafiğinde gözlemlerime dayanarak potansiyel bir simetrik üçgen formasyonu var. Fiyatlar daralan bir aralıkta hareket ediyor gibi görünüyor ve bu, yakında heyecan verici bir kırılma yaşanabileceğini gösteriyor! 🚀 Eğer kırılma sırasında hacimde ciddi bir artış olursa, bu hareketin gücünü artırabilir.
Eğitim Çalışmasıdır, Yatırım Tavsiyesi Değildir!
