Solana to $260?SOL is testing previous resistance as support around $180.
Reclaiming $184 could signal a test of last week's highs around $206.
Claiming $206 as support could signal a push towards $260.
Losing $180 could signal a retracement towards $165 or 1D 200MA.
Solanaprice

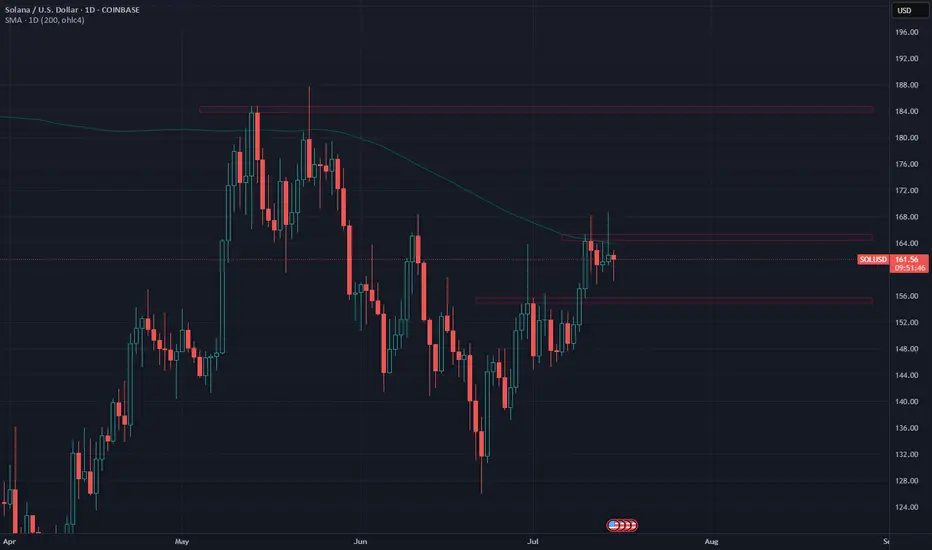
Solana's battle continues. But for how long?The battle for Solana to overcome the 1D 200MA continues.
A daily closed above $166 could signal a push towards May Hs around $185.
The last time SOL traded above 1D 200MA was in Feb. Since then, the daily 200MA has been acting as resistance.
If Solana can finally start trading above the 200MA and reclaim $185, it could signal higher prices and a test of January Hs around $270.
In the short term, support can be expected around $156 should price start to show some weakness... Losing it wouldn't be nice...
What do you expect from Solana in the short term?
SOL TO 167?Good morning folks
so it looks like we are correcting down possibly down to 153 then seeing a drive up to 167. What are your thoughts on the market for Solana
Looks like things are heating up for Solana
Kris/Mindbloome Exchange
Trade Smarter Live Better

Solana looks scary. I don't like this rejection from the 1D 200MA.
Looking at the the weekly chart, it is very easy to see the similarity to 2022.
Maybe we should brace for impact?

Is there hope for Solana?After a retest of support around $142, SOL is testing previous support as resistance around $152.
A strong break and retest of the $153 area could signal price reclaiming support and heading towards $166.
Failing to do so could lead to a retest and confirmation of $140 as support. Of course, losing support would signal further weakness towards $136 before a reversal potentially taking place.
As mentioned before, price is still trading below 1D 200MA, which could either be signaling weakness or the potential for more upside.
Considering the downward direction of the 1D 200MA could also be a bearish signal, however, this also usually happens before a reversal.

How low can Solana go?SOL is potentially creating a local low around $150. If buyers step in and price holds these levels, we could see a reversal, reclaiming previous support around $160.
A rejection from $160 and breaking this week's lows ($150) could signal a retest of previous levels from $130 - $140.
My personal instinct is still weary of the fact that price has been rejected twice from the 1D 200MA, potentially signaling even further weakness for SOL.

A weak start for SolanaSOL starts the week trading below local support around $165. Continued weakness could lead to a retest of $155.
Failing to hold $155 could signal further weakness and the possibility of entering it's previous range with support around $142.
If prices reclaims $155, it could signal strength and potential to turn local resistance around $182 into support, reclaiming the 1D 200MA, setting the stage for the next leg up.

Solana: Below ResistanceOur primary scenario for Solana is that the coin is already close to the top of the green wave 4. Therefore, we expect a bearish trend reversal below the resistance at $192.33, followed by a move toward our blue Target Zone (coordinates: $56.56 – $29.87) with the green wave 5. Down there, we see an opportunity for long trades with the low of the blue wave (ii), which should be followed by a fresh upward impulse. According to our alternative scenario (probability: 38%), however, we may have already seen the low with wave alt.(ii) in blue prematurely. To validate this alternative scenario, the price would have to rise directly above the resistance at $192.33 from here and extend the blue wave alt.(iii) .

Solana to hit $180?SOL starts the week with bullish momentum from local support around $147. Reclaiming local highs or a solid candle above $155 could signal a push towards $179 or 1D 200MA around $181.
A close below $147 could signal short term weakness.

SOL/USD "Solana vs U.S Dollar" Crypto Heist Plan (Swing / Day)🌟Hi! Hola! Ola! Bonjour! Hallo! Marhaba!🌟
Dear Money Makers & Robbers, 🤑 💰💸✈️
Based on 🔥Thief Trading style technical and fundamental analysis🔥, here is our master plan to heist the SOL/USD "Solana vs U.S Dollar" Crypto Market. Please adhere to the strategy I've outlined in the chart, which emphasizes long entry. Our aim is to escape near the high-risk Blue ATR Line. Risky level, overbought market, consolidation, trend reversal, trap at the level where traders and bearish robbers are stronger. 🏆💸"Take profit and treat yourself, traders. You deserve it!💪🏆🎉
Entry 📈 : "The vault is wide open! Swipe the Bullish loot at any price - the heist is on!
however I advise to Place buy limit orders within a 15 or 30 minute timeframe nearest or swing low or high level for pullback entries.
Stop Loss 🛑:
📍 Thief SL placed at the recent/swing low level Using the 4H timeframe (120.00) Day/Swing trade basis.
📍 SL is based on your risk of the trade, lot size and how many multiple orders you have to take.
🏴☠️Target 🎯: 168.00 (or) Escape Before the Target
🧲Scalpers, take note 👀 : Only scalp on the Long side. If you have a lot of money, you can go straight away; if not, you can join swing traders and carry out the robbery plan. Use trailing SL to safeguard your money 💰.
💰💵💸SOL/USD "Solana vs U.S Dollar" Crypto Market Heist Plan (Day / Swing Trade) is currently experiencing a bullishness,., driven by several key factors.☝☝☝
📰🗞️Get & Read the Fundamental, Macro, COT Report, On Chain Analysis, Sentimental Outlook, Intermarket Analysis, Future trend targets.. go ahead to check 👉👉👉🔗
⚠️Trading Alert : News Releases and Position Management 📰 🗞️ 🚫🚏
As a reminder, news releases can have a significant impact on market prices and volatility. To minimize potential losses and protect your running positions,
we recommend the following:
Avoid taking new trades during news releases
Use trailing stop-loss orders to protect your running positions and lock in profits
💖Supporting our robbery plan 💥Hit the Boost Button💥 will enable us to effortlessly make and steal money 💰💵. Boost the strength of our robbery team. Every day in this market make money with ease by using the Thief Trading Style.🏆💪🤝❤️🎉🚀
I'll see you soon with another heist plan, so stay tuned 🤑🐱👤🤗🤩

SOLANA - 900% profit?main idea:
An upward momentum is forming.
At the moment we are in the corrective 4 wave, if we look at the daily candlestick signal, we can assume that we have completed it.
Further I expect growth and formation of the 5th wave, which completes the whole impulse.
The growth target is the area of 656.00 - 1380.00$.
In percentage ratio 400 - 900%. Quite impressive figures.
I'm going in to buy.
I'm targeting maximum targets
As it approaches the designated area, I will keep a close eye on it, so as not to miss the reversal and fix the profit.
Stop - below 121.81
SL/TP ratio - 1/70.
P.S. - who is with me, click on the rocket and subscribe.

SOL/USD "SOLANA" Crypto Market Heist Plan on Bearish Side🌟Ola! Bonjour! Hi! Hallo!🌟
Dear Money Makers & Robbers, 🤑 💰
Based on 🔥Thief Trading style technical analysis🔥, here is our master plan to heist the SOL/USD "SOLANA" Crypto market. Please adhere to the strategy I've outlined in the chart, which emphasizes short entry. Our aim is the high-risk Green Zone. Risky level, oversold market, consolidation, trend reversal, trap at the level where traders and bullish robbers are stronger. 👀 So Be Careful, wealthy and safe trade.💪🏆🎉
Entry 📉 : You can enter a trade anywhere,
however I advise placing sell limit orders within a 15 or 30 minute timeframe. Entry from the most recent or closest high level should be in retreat.
Stop Loss 🛑: Using the 2H period, the recent / nearest high level.
Goal 🎯: 192.00
Scalpers, take note : only scalp on the Short side. If you have a lot of money, you can go straight away; if not, you can join swing traders and carry out the robbery plan. Use trailing SL to safeguard your money 💰.
Warning⚠️ : Our heist strategy is incompatible with Fundamental Analysis news 📰 🗞️. We'll wreck our plan by smashing the Stop Loss 🚫🚏. Avoid entering the market right after the news release.
Take advantage of the target and get away 🎯 Swing Traders Please reserve the half amount of money and watch for the next dynamic level or order block breakout. Once it is resolved, we can go on to the next new target in our heist plan.
💖Supporting our robbery plan will enable us to effortlessly make and steal money 💰💵 Tell your friends, Colleagues and family to follow, like, and share. Boost the strength of our robbery team. Every day in this market make money with ease by using the Thief Trading Style.🏆💪🤝❤️🎉🚀
I'll see you soon with another heist plan, so stay tuned 🫂

Solana Full Analysis Everything You Need to Know Afternoon Traders
So I break down Solana for you today as its shaping up our first tp is 189 that we are heading to however if we break past that 195 is a great next tp to get to.
In this video I go through the levels and why behind it to make sure you understand what levels to look out for when trading.
If you found this video helpful let me know with a comment, follow or boost. I appreciate it
Mindbloome Trading/ Kris
Trade What You See

Is there enough juice for SOL?SOL trades around $132, just above 4HR 50MA, however, failing to stay above $135. If price stays within the current range and reclaims $135, that could be bullish. Otherwise, assuming the move to $135 was a fakeout, SOL could head back to $120.

At what price you are ready buy SOLANA in your invest portfolio?Probable wave analysis on the #SOLUSDT chart
The bottom of wave 4 has either already been formed or is yet to come.
Therefore, we have marked three points where you need to be as careful as possible when deciding whether to buy CRYPTOCAP:SOL or whether it is too early.
1️⃣ $120 - if the price does not go lower, further growth will be quite rapid, as buyers will show their strength.
2️⃣ $90 - a stop of the falling in a strong liquid zone, which can be "considered a prudent buy zone".
3️⃣ $70 - this is where the price can reach on panic sales, liquidations, and stop losses.
Interestingly, the calculations show that wherever the #SOLUSD price falls, t he chance of growth to $650-670 is the same from the three points, it's just a matter of time.
So, what price will you choose to buy #SOLANA?

Solana Weekly Analysis Here's the corrected version:
Solana has demonstrated its strength in this bullish market, showcasing a long accumulation phase from Mon 30 May '22 to Mon 30 Oct '23. Subsequently, the price began breaking highs directly to $200, marking a 2500% increase from Mon 26 Dec '22. It's been quite a volatile market, and I believe Solana has the potential to become one of the leading blockchains in the next few years.
In the technical analysis, we observe the price starting to drop as buyers from the accumulation phase begin taking their profits. Additionally, there's market anxiety due to geopolitical tensions and rising inflation. However, this decline is healthy, as it provides an opportunity for new buyers to accumulate Solana and potentially drive it to new all-time highs.
The optimal price point to buy Solana is in the sweet spot below the 50% Fibonacci level, indicating a discount area for accumulation.

SOL → Which Way Solana? Let's Answer That Question With a Chart.Solana is at a crucial decision point; fail to break resistance or rocket to the next level? Right now it's failing to get back into the bull channel, but hasn't yet broken to the downside.
How do we trade this?
If you're not already in a trade, wait to enter one! For a long, we need a test of Support at the 30EMA, or a break of the Previous Resistance line followed by a support test and confirmation. To short, we need a failed breakout attempt of Previous Resistance and preferably, a confirmation bear candle closing on or near its low below the 30EMA.
Until then, let's see where the price action goes. FOMO (Fear of Missing Out) is your worst enemy. You're making more money by not falling for the seduction of market profit.
Trade Idea
Short Entry : $48.00
Stop Loss: $54.15
Take Profit: $35.70
Risk/Reward Ratio: 1:2
Long Entry : $73.00
Stop Loss: $107.00
Take Profit: $61.65
Risk/Reward Ratio: 1:3
Key Takeaways
1. Bull Channel, Bias to Long.
2. Bear Breakout, Watch for Sell Signal.
3. Still Above 30EMA, Watch for Support.
4. Do not Long until we break Previous Resistance.
5. RSI at 61.00, below Moving Average. Supports Short.
You are solely responsible for your trades, trade at your own risk!
If you found this analysis helpful, click the Boost button and let us know what you think in the comment section below!

Solana Getting Ready for a Dump? Here's How to Trade This!Solana pulled back to the bull channel support after ripping to $68.00. We're seeing some strong bull channel support at $51.00, but is it enough to continue the trend? There are a few ways we can look at this chart, let's explore.
How do we trade this?
Entering a trade at this level is weak. Bull channel support and the previous resistance levels are very close to the current price and we don't have a strong signal either way. It's reasonable to be biased toward a long since we're in a bull channel, but we have not seen a strong confirmation bar. Bitcoin, as a leading indicator, is also failing to break Weekly resistance and is signaling a pullback, which may impact Solana's ability to go up. RSI is also around 60 and while not a strong indicator, gives us *some* bias toward the downside.
We need a sell signal at resistance, or a strong buy signal on bull channel support with follow-through before entering a trade. A reasonable stop loss for a long is below the bull channel support or below the 30EMA and above the previous resistance if we're shorting. The bottom line, we need a little more price action before rushing into a trade.
Key Points
1. Bull Channel, Look for Long Entry.
2. Near Previous Resistance.
3. Wait for a sell signal at Bull Channel Resistance.
4. Wait for a breakout of Previous Resistance.
5. RSI is near 60, Bias toward the downside.
You are solely responsible for your trades, trade at your own risk!
Let us know what you think in the comment section below!

SOL 4HR Analysis - Will the Bull Channel Breakout Continue!?Solana has broken out of the 4HR bull channel and is beginning to pull back to the channel top. Contact with the channel top is a crucial moment in deciding which direction the price is likely to go. A bull signal bar followed by a 4HR confirmation bar (bull bar closing near its top) is what we're looking for to remain long. A bear bar closing near its low below the channel top gives us the inverse indication, that the price will pull back into the channel.
Key Points:
1. Bull Channel means we should Always be Long.
2. The channel breakout needs to be confirmed
3. There is a gap between current price and 30EMA/200EMA
4. Bitcoin has touched Weekly Channel Resistance
5. RSI is overbought. A weak indicator on its own, but supports #2-#4
Wait for the confirmation in either direction before trading this. We need more information before we can adequately manage a trade with good probability.
As always, trade at your own risk, you are responsible for your trades. I hope this analysis was insightful and useful.
Trade wisely and let us know what you think in the comment section below!

Another Bolish position for Solana ...Another head and shoulders pattern on Solana's chart...and the possibility of another rally for Solana to around $32.20 .
In the previous analysis, Solana reached exactly the predicted growth with a similar pattern...
Everything is ready to increase the price of Solana.

Solana: Off you go! 🙌Quite commendably, Solana has placed the low of wave ii in orange in our target zone and has started the expected ascent. Now, the altcoin should keep up this trend to make it above the resistance at $26.55. This should provide our crypto friend with further upward momentum, which should help Solana to reach the next goal: the orange zone between $46.05 and $64.63, where wave iii in orange should end.

Solana: Check! ✔️✏️As planned, Solana has worked its way through the turquoise zone between $22.45 and $17.82 and completed wave 2 in green. Now that this to-do is checked off, our crypto-friend should gather some upwards momentum, which should propel it out of the turquoise zone and further northwards to finish wave 3 in green. However, there is a 20% chance that Solana might not be able to activate the necessary drive and thus slips below the support at $16.01. In that case, we would expect the altcoin to develop a new low in the form of wave alt.ii in orange first before heading upwards.

Solana (SOLUSDT) Price AnalysisPrice has been consolidating near the support level for a few days. The support level of $19.65 also represents Fib 0.618 level. If price breaks above the consolidation zone with Volume greater than Volume-21MA, we might see price moving to HKEX:27 which is also Fib 1.0 level. If the price breaks above HKEX:27 , we can see it moving to $38.65 (Fib 1.618).
If price breaks below, the support level of $ 19.74, next support level is $17.5.
Note:
Studies are for educational purposes only.
We will not be responsible for any of your Profits & Losses.
Please trade with a proper risk management strategy to avoid huge capital loss.
