Solana Analyze (Road Map)(update)!!!🗺️Solana moved as I expected in my previous Idea👇✅.
Finally, Solana broke the support line to verify the end of the main wave 4 at the top of the descending channel.
I expect that Solana will go down at least to the last Bottom, even probably it will touch zones where I specified in my chart about the end of main wave 5.
Solana Analyze Analyze (SOLUSDT) Daily Timeframe ⏰ (Log Scale)
Do not forget to put Stop loss for your positions (For every position you want to open).
Please follow your strategy, this is just my idea, and I will be glad to see your ideas in this post.
Please do not forget the ✅' like '✅ button 🙏😊 & Share it with your friends; thanks, and Trade safe.
Solanausd

Solana HTFSolana chart is very clean on HTF, respecting levels very well, I think it will go slightly below 20$, would be good price to pick up for long term in my opinion. (NAFA)

SP500 INDEX PERSONAL ANALYSIS IN THE LONG TERM (DUMP)Noodle party? Well not exactly, its a solana chart spilling spaghetti everywhere! The total evaluation for this asset is extremely bearish and I could not even begin to become so engrossed in bear costumes all year round because who could possibly blame us? The cycle has ended just as it has always ended in previous cycles -- it almost always returns to where it started and considering how we just got resisted from the SP500 and NASDAQ on a monthly resistance trendline (you can check this out in my profile) , there's no guarantee that the current supports that HELD us in a bull market will even be strong enough in a bearmarket.
The SOLANA chart has now been confirmed with a bearflag that we had been suspecting from since we dropped here in this range for months, a validated bearflag WILL create lower lows and its much stronger in a bear market obviously and especially in a macro-time frame (4H, 8H, 12 H, 1D, 1W).
Never underestimate panic selling, always be mindful of your risks and make sure to enlighten yourself everyday with what is happening around the world so that maybe one day, huge positive fundamentals or catalysts would support
a possible reversal towards our brand new all time high.
-----
You like this chart? Give it a boost, a comment or share it with your friends. Bookmark it, save it, its yours for free!

SOL/USD (NEW)The price is in the ascending channel. Currently there´s no low risk entry for long therefore we recommend to wait for a pullback as we expect the price to retest the lower boundary of the channel and from there continue its mid-term uptrend.

SOLUSDT Raising Wedge Pattern!SOLUSDT Technical analysis update
Short level: $40.70 - $41.30
Stop loss : $45.00
TP 1 : $37.00
TP 2 : $33.50
TP 3 : $29.00
Max leverage: 1x
Always keep stop

SOLana nearest targets according to the forecast!#SOL
▪️The price is shrinking before the explosion, indicated several immediate targets that Solana can reach!
Subscribe to tradingview!. stay tuned for ideas! Links below👇


SOL @ 18 days TFTell me what you think about it
- Inverted
- Forming a setup for a breakout to 50 ~ 80 SOL price range

solusdt is placed in the corner of the trianglesolusdt is placed in the corner of the triangle and has to choose whether to break the resistance or correct downwards. All the evidence points towards the breaking of the dynamic resistance, which, if realized, will rise to the expected level.

Solana (SOL) formed bullish Cypher for upto 11.50% pumpHey dear friends, hope you are well, and welcome to the new trade setup of Solana (SOL) coin with Bitcoin pair.
Recently I shared a long-term trade plan for SOL, which is still in play:
Now on a daily time frame, SOL has formed a bullish Cypher pattern.
Note: Above idea is for educational purpose only. It is advised to diversify and strictly follow the stop loss, and don't get stuck with trade.

SOLUSDT 12h Medium-term trade - our target $79Last week, we published the idea of the SOLUSDT trading pair, where we highlighted the main liquidity zones for the last 2 years.
Over the past week, the SOLUSD price has been consolidating above the important price zone $30-31. Even yesterday, when they tried to spill prices in the entire cryptocurrency market, the buyers of the Solana token were able to hold the SOL price.
This behavior of buyers and sellers at SOLUSDT chart price allows us to take a medium-term long position under the following conditions:
Entry 33,11-33,51
Stop 27,84
TP1 - 58,80
TP2 - 78,84
By the way, yesterday we already published the conditions for the selection of two medium-term long positions:
AVAXUSDT:
SANDUSDT:
_______________________________
Since 2016 , we have been analyzing and trading the cryptocurrency market.
We transform our knowledge, trading moods and experience into ideas. Each "like under the idea" boosts the level of our happiness by 0.05%. If we help you to be calmer and richer — help us to be happier :)

SOLUSDT 12h Solana +35% growth in 6 days and this is not the endToday we will update info about our medium-term SOLUSDT trade.
After an 8-10 month downward trend, it is hard to believe in growth, but the fact is that in just 6 days the Sol price increased by 35%
The first strong resistance level of $50 is very close.
We assume that consolidation may begin below it before continuing the upward movement.
Therefore, it is worth making a decision based on what type of trade you practice, whether the profitability is sufficient for you, how large the size of the position is, etc.
At the moment, it seems logical to partially fix the profit on the long position of SOLUSD, before the levels of $50, $59 and $79
The growth pattern is relevant if, the nearest days, buyers do not allow the Solana token price to fall below $41.
Subscribe to us and always receive timely updates on the technical analysis of cryptocurrencies.
_______________________________
Since 2016 , we have been analyzing and trading the cryptocurrency market.
We transform our knowledge, trading moods and experience into ideas. Each "like under the idea" boosts the level of our happiness by 0.05%. If we help you to be calmer and richer — help us to be happier :)

SOLANA (SOLUSDT) breakout or antoher dump?SOLANA has shown signs of strength recently, first by stopping its constant fall on a historic support level with significant volume (2nd biggest trading volume in SOL's history on Binance).
Also the descending channel of the past few weekshas been broken. While these are all bullish signs to me, another historically proven resistance area is just above the price and a long-term decending resistance line is very close too. If the price was to close above 60-61 USD, then I would start hoping for a longer-term uptrend - though not necessarily a new All-TIme High in one go ;-)
On the other hand, the aforementioned two resistance factors can justify a short positionif the price failsto holdabove 60 dollars.

SOLUSDT 1D Buy and sales levels of Solana in the descriptionBefore you is the global chart of SOLUSDT
For more than 8 months, the downtrend in SOLANA price continues, and the last 2 months the SOLUSDT price is in the lower part of the trend channel.
However, it seems that there is interest in the SOLANA project and there are both large and small buyers.
Buyers did not allow the SOLUSD price to fall below the liquidity area of $20-40. It was there in 2021 buyers was taken the final big long position before the pamp at x10.
Targets for SOLUSDT price growth in the coming weeks:
1) $42.50
2) $60-61
3) $79-80
If you see that the SOL price is trying to stabilize below $30-31 , then place an order to buy at $23 . Of course, you have to buy SOL if you believe in the bright future of the SOLANA project and know how to use the SOL token in your deposit.
(By the way, you can share your thoughts and experiences in the comments)
_______________________________
Since 2016 , we have been analyzing and trading the cryptocurrency market.
We transform our knowledge, trading moods and experience into ideas. Each "like under the idea" boosts the level of our happiness by 0.05%. If we help you to be calmer and richer — help us to be happier :)


Solana SOL DirectionI've set with red the support and resistance zones for Solana.
I Don't short this VC altcoin, too manipulated.
My next spot buy of SOL will be between 21$ and 18$, with a chance it goes even below 16$.
The RSI made a plateau of support, check the black line.
If BTC scam wicks up for a while now, SOL might retest 42$ first, before more down to come.
Have a nice day )

SOL bounce - Trendline touch confirmed
- Move down after run up was too fierce
- Strong resistance
Nice 2R:R setup

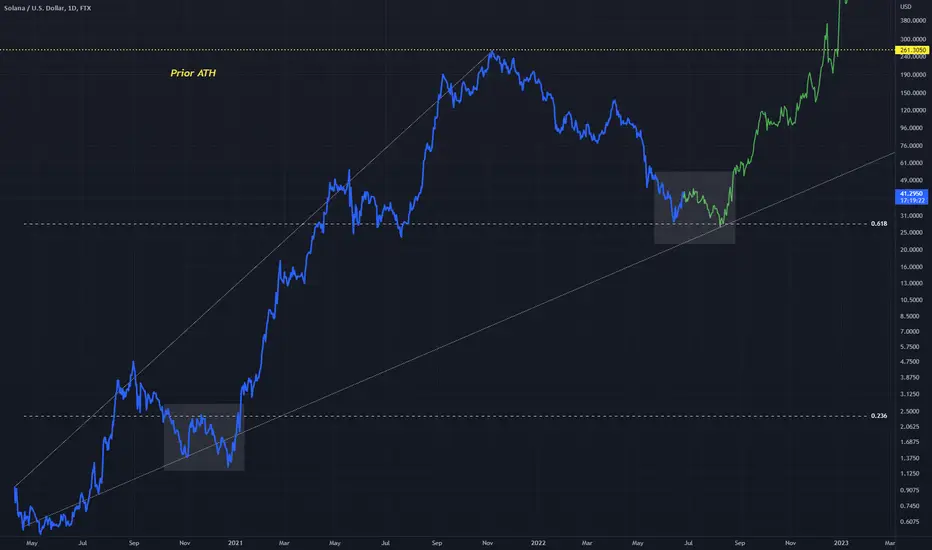
SOLUSD Recovery IdeaSOLUSD has formed interesting bear price action
0.618 is a possible support point for a reversal, it has been seen as a support level in history
I am suggesting a similar bottom to that seen at 0.236 (white box), and then the bulls take over again
Pullback now completed in daily chart. will SOL test 35$ again?In the daily time frame, the pull back has completed the downtrend line and the price is expected to decrease to the $ 38 area, and from there, it will start its uptrend up to the $ 60 area by forming a double bottom pattern.
My prediction is that with the price fluctuating in the range of $ 35 to $ 60, Solana will enter a triangle, which at the end of the triangle is expected to break the downtrend line to reach the important $ 80 range, which has very strong resistance.
Keep in mind that all of these behaviors also depend on the price trend of bitcoin.
These statements are only personal opinions and are not a signal to trade.


SOLANA SHORT TO THE BONE !!If this bear flag on the 4H completes, target will be about $16.
This scam ponzi project is on its road to the inevitable collapse just like LUNA did and will trigger panic.
Their only value lies on DeFi and NFTs.
NDA FYOR (not a typo).

SOL on the resistance zoneHello fellow traders! Currently SOL is on the verge of a possible break out of the month long downtrend channel.
The pros are;
the WEEKLY bullish divergence taking place. (shown on last chart)
The MFI has support at 70.
Price has support at 100 ma (4 hr)
*opinion* undervalued project
The cons are;
SOL is at the top of a month long resistance channel
RSI showing resistance at 60
Currently in downtrend
Let me know you're opinions :) Good luck and set stop losses!

Solana possible target - 0.618 FibI drafted this chart starting solana at about 1 usd.
if bitcoin continues its downtrend, i see solana going as low as 11$ which corresponds to its 0.618 fib.
As usual, no financial advice !
