$SOL chart' s bearish continuationWith the price declinations, #sol #solana price formed bearish double top in short term. Bearish continuation expected. Not financial advice.
Solanausd

Solana SOL Intraday Trade SetupSolana is struggling to break bullish $157, the key intraday resistance and needs support from SOLBTC chart.
A bullish break-out of $157 will offer more upside towards $169-175.
Another re-test of $150 followed by a bullish rejection and a break-out of $157 will lead to SOL price moving towards $169-175.
More details are in the signature.

Solana (SOL) Finds Support, Eyes Return to $203
The cryptocurrency market has seen its share of volatility recently, and Solana (SOL) has been no exception. However, when we zoom out and take a look at the weekly timeframe, a clearer picture emerges. This article dives into SOL's recent price action and explores the potential for its next move.
Solid Support at $149
A crucial observation from the weekly chart is the strong support level established at $149. Despite price fluctuations, SOL has managed to hold above this key area, even during periods where the price dipped momentarily below. This indicates significant buying pressure at this level, suggesting that many market participants view $149 as an attractive entry point.
Range Bound
The consistent bounce off the $149 support has led to the formation of a range between this level and $203. This price range reflects a period of consolidation, where buyers and sellers are temporarily reaching an equilibrium. The price action within this range suggests some indecision in the market, with neither bulls nor bears able to exert dominance.
Looking Ahead: Potential Move to the Upside
Given the presence of the established support level at $149, and the recent price holding within the defined range, there's a possibility that SOL might attempt a move back towards the upper range boundary of $203 in the coming days or weeks. This potential upswing could be fueled by several factors:
• Increased Buying Pressure: If more buyers are attracted to SOL, particularly at current levels, it could push the price higher. This buying pressure could stem from renewed confidence in the Solana project, positive news developments, or simply technical factors related to the range itself.
• Short Squeeze: If a significant number of traders are currently shorting SOL (i.e., betting on the price to decrease), a sudden shift in sentiment could lead to a short squeeze. This occurs when shorts are forced to buy back SOL to cover their positions, which can drive the price up rapidly.
• Overall Market Sentiment: The broader cryptocurrency market sentiment also plays a role in SOL's price movement. If the overall market sentiment turns bullish, it could lift all cryptocurrencies, including SOL.
Important Caveats
While the potential for a move towards $203 exists, it's important to consider some factors that could prevent this from happening:
• Failure to Hold Support: If the price breaks decisively below the $149 support level, it could signal a bearish trend and lead to further price decline.
• Negative News or Events: Any negative news surrounding the Solana project or the cryptocurrency market as a whole could dampen investor sentiment and hinder a price increase.
• Resistance at $203: Even if SOL reaches $203, it might face resistance at this level. Overcoming this resistance would require sufficient buying pressure to push the price through.
Conclusion
Solana (SOL) has found support at $149 and is currently trading within a range between $149 and $203. The coming days and weeks could see SOL attempt to move back towards the upper end of this range, potentially reaching $203. However, several factors could influence this possibility, and close attention should be paid to market sentiment, news developments, and price action around the support and resistance levels.
Disclaimer: This article is for informational purposes only and should not be considered financial advice. It's crucial to conduct your own research before making any investment decisions.

SOL: ny money management📊Analysis by AhmadArz:
🔍Entry: 134.97
🛑Stop Loss: 130.59
🎯Take Profit: 139.35 - 143.91
🔗"Uncover new opportunities in the world of cryptocurrencies with AhmadArz.
💡Join us on TradingView and expand your investment knowledge with our five years of experience in financial markets."
🚀Please boost and💬 comment to share your thoughts with us!

SOL Need to bounce nowSolana entered a key zone. It need to bounce now, otherwise it will be hard. Price crossed below main trendline, and it's entering daily support zone. If this level will not hold ($133-126) we could probably see the price to be traded again around $100

At what price you are ready buy SOLANA in your invest portfolio?Probable wave analysis on the #SOLUSDT chart
The bottom of wave 4 has either already been formed or is yet to come.
Therefore, we have marked three points where you need to be as careful as possible when deciding whether to buy CRYPTOCAP:SOL or whether it is too early.
1️⃣ $120 - if the price does not go lower, further growth will be quite rapid, as buyers will show their strength.
2️⃣ $90 - a stop of the falling in a strong liquid zone, which can be "considered a prudent buy zone".
3️⃣ $70 - this is where the price can reach on panic sales, liquidations, and stop losses.
Interestingly, the calculations show that wherever the #SOLUSD price falls, t he chance of growth to $650-670 is the same from the three points, it's just a matter of time.
So, what price will you choose to buy #SOLANA?

SOL: back to latest renge📊Analysis by AhmadArz:
🔍Entry: 143.96
🛑Stop Loss: 125.30
🎯Take Profit: 159.64 -190.98
🔗"Uncover new opportunities in the world of cryptocurrencies with AhmadArz.
💡Join us on TradingView and expand your investment knowledge with our five years of experience in financial markets."
🚀Please boost and💬 comment to share your thoughts with us!

SOL: sell in cycle📊Analysis by AhmadArz:
🔍Entry: 180.85
🛑Stop Loss: 187.18
🎯Take Profit: 175.44-169.76-163.92-156.88-150.02
🔗"Uncover new opportunities in the world of cryptocurrencies with AhmadArz.
💡Join us on TradingView and expand your investment knowledge with our five years of experience in financial markets."
🚀Please boost and💬 comment to share your thoughts with us!

Solana Weekly Analysis Here's the corrected version:
Solana has demonstrated its strength in this bullish market, showcasing a long accumulation phase from Mon 30 May '22 to Mon 30 Oct '23. Subsequently, the price began breaking highs directly to $200, marking a 2500% increase from Mon 26 Dec '22. It's been quite a volatile market, and I believe Solana has the potential to become one of the leading blockchains in the next few years.
In the technical analysis, we observe the price starting to drop as buyers from the accumulation phase begin taking their profits. Additionally, there's market anxiety due to geopolitical tensions and rising inflation. However, this decline is healthy, as it provides an opportunity for new buyers to accumulate Solana and potentially drive it to new all-time highs.
The optimal price point to buy Solana is in the sweet spot below the 50% Fibonacci level, indicating a discount area for accumulation.

SOL - Similar Re-Accumulation Last CycleLast cycle we had a re-accumulation that looked just like this, and it was from the exact same levels. Scroll left and go take a look. I pulled the fractal and overlaid it for comparison. This is how I'm expecting it to happen. It's also worth noting that BTC and ETH also have a re-accumulation that matches up with last cycle's fractal. This big dump was the spring and now we have hidden bullish divergences on the daily across all of the altcoins

Long SOLANA COINLong Solana coin here. 50% of position. Will scale in rest over next 1-3 hours. Solana double top was obvious but got distracted fishing. Think we test 200$ sol in next 2-8 days. Let's see what happens.

SOL (SOLANA) Technical Analysis and Trade IdeaThis video presents an in-depth examination of a technical analysis and trading strategy for SOL. Our evaluation indicates the possibility of a trading prospect. We conduct a detailed review of the prevailing price movements, examine the market's framework with precision, and take into account the market's forces. Given the positive circumstances, we pinpoint a prospective point of entry. Nevertheless, it is essential to emphasize the importance of applying strong risk management measures. It is important to remember that the content of this video is intended solely for educational purposes and should not be interpreted as investment advice.

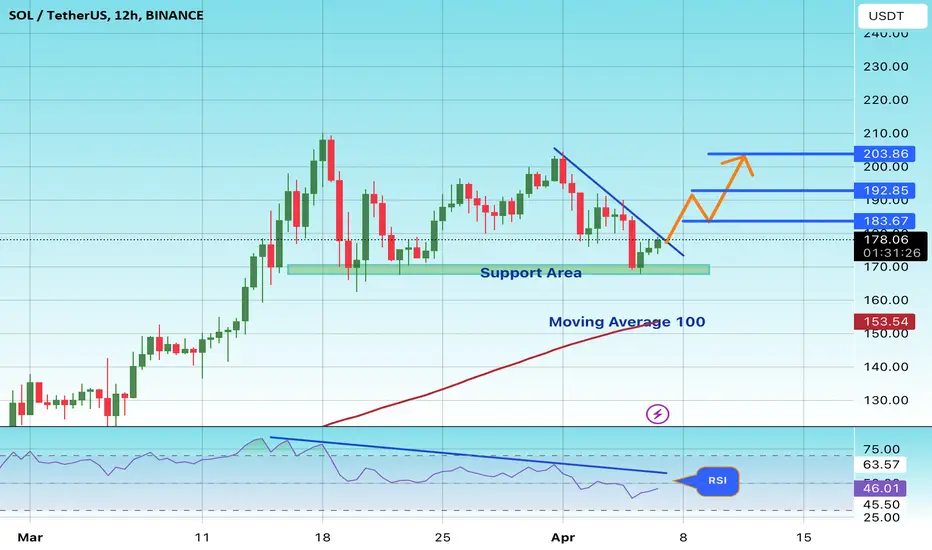
#SOL/USDT#SOL
We have a downtrend on a 12-hour frame, the price is moving within it and adhering to its limits well
We have a major support area at $170
We have a higher stability moving average of 100
We have a downtrend on the RSI that is about to break higher
Entry price is 177
First goal 183
Second goal 192
Third goal 203
Why Solana Could Boom in the World of dApps! I am bullish on Solana's future due to its potential dominance in the dApp space. Here's a breakdown of the key points and some additional considerations:
Key Points:
• dApp Growth: Solana's fast transaction speeds and low fees make it attractive for developers building dApps.
• Potential Price Increase: Increased demand for SOL tokens due to dApp development could drive up the price.
• Strong Contender: Solana's performance suggests it could be a major player in the dApp market.
• Call to Action: I would consider to buy SOL tokens (long SOL) to potentially profit from this growth.
Additional Considerations:
• Technology Risk: While Solana's technology is promising, it's still relatively new and evolving. There could be unforeseen technical challenges.
• Competition: The dApp market is competitive with other platforms like Ethereum. Solana's success depends on attracting developers and users.
• Investment Risk: Cryptocurrencies are volatile, and there's no guarantee SOL will increase in value.
Before Investing:
• Research Solana's technology and its competition in the dApp space.
• Understand the risks involved in cryptocurrency investments.
• Only invest what you can afford to lose.
Overall:
This idea highlights Solana's potential as a dApp platform, but be aware of the associated risks. Do your own research before investing and prioritize a long-term strategy over short-term hype. Consider consulting a financial advisor for personalized guidance.

SOL - UPDATE - old eth vs sol now ideaSOL - update old eth vs sol now
just an update of the old attached idea with more data now on the macro momentum.
looking like that final push coming here, the spike before the biggish pull back before ultra moon mission alpha.
or we are about to get gutted like that earlier 'fake' pump. full retrace hell.
the momentum doesnt quite look right overall for that option to me. i think first option is more likely above.
anyway keeping a close eye on all this. would like to catch a big pull back but that is notoriously difficult. :)
gl

SOL Expecting more downsideSolana looks ready to make a retrace. I am expecting a little bounce here till 189.34 where i placed my sell limit order. The target for my short is the h4 support zone on $176

SOL: Re-Accumulation After Decline (Decline already happened)Comparing Solana price action to this Wyckoff schematic known as "Re-accumulation After Decline" and it matches up beautifully. We should currently be in the LPS stages right before the next markup. Be careful with your entry obviously, because crypto doesn't always follow the rules, however we are definitely in a bull market and I'm looking long all day until proven otherwise, especially after finding this re-accumulation.
Suggested entry: At the bottom of this local consolidation range, which is currently sitting on top of our "lower accumulation" range highs. This needs to hold for the markup to play out. If we lose those highs, this idea will be invalidated

SOL: trade by leg📊Analysis by AhmadArz:
🔍Entry: 190.15
🛑Stop Loss: 186.06
🎯Take Profit: 194.40-198.59-209.32
🔗"Uncover new opportunities in the world of cryptocurrencies with AhmadArz.
💡Join us on TradingView and expand your investment knowledge with our five years of experience in financial markets."
🚀Please boost and💬 comment to share your thoughts with us!

SOL - Lower High Here Will Mean DistributionIf SOL makes a lower high here, this is a distribution. Count the waves and compare. UT, 5 waves down, 9 waves up for a UTAD, lower high for a test will confirm it

Solana - IMPORTANT Support Zone will be TESTEDHi Traders, Investors and Speculators of Charts
Solana is frequently trending due to steep fees of ETH. Even after a large increase, there is still great upside potential for the future. However, for the short term, a retets of a prominent support zone is likely after a near parabolic increase on SOL.
SOLUSDT is one of the altcoins I was watching for 2024 Altseason, as per previous posts in early January. ✅
👉 Technical Indicator SHORT TERM is overbought indicating a correction is overdue
👉 Support zone at $153 is critical to hold
👉 Daily candles need to keep closing ABOVE this zone to avoid a potential H&S pattern.
Overbought indicates a correction is overdue:
If you found this content helpful, please remember to hit like and subscribe and never miss a moment in the markets.
_______________________
📢Follow us here on TradingView for daily updates📢
👍Hit like & Follow 👍
KUCOIN:SOLUSDT

$SOL Market Cap Long to $500B - '21 $ETH vs '24 $SOL2021 CRYPTOCAP:ETH
VS
2024 CRYPTOCAP:SOL
from: 10B Market Cap
to: 500B Market Cap
enjoy the ride, the cycle is young ✨
#SOLANA ⚡️
--- this is a study on fractals and market cycles. I have studied this '20-'21 ETH fractal in comparison with the '23-'24 CRYPTOCAP:SOL chart in great depth going back 2 years to when SOL was $8.
---REFERENCE my prior publishings to learn more. links to some of them are BELOW! GL HF NFA <3
TLDR - CRYPTOCAP:SOL is going to give CRYPTOCAP:ETH a run for its money. Enjoy the show. Been in since $8 and still just as bullish as before.
-@CryptoCurb

This SOL Chart Makes Me Want to Cry. Black Swan EventZoom out. Pull macro fib time. Pull a monthly supply at ATH. Pull a measured move from ATH to bear market low. Measure from current high. Look at the beginning of a Wyckoff Distribution Schematic. Cry myself to sleep. In that order
We're going into a bear market until April 14th, 2025

SOL Solana Trade IdeaSOL Solana is clearly trending bullish as we can see on the 4 hour time frame with consecutive higher highs and higher lows. We look for an entry on the Fibonacci retrace down into the 50 to the 61.8% level. We can see support on a previous high to the left of the current price swing which could provide support for an entry point. Target one is the current price swing high take partial profits and move stop loss to break even, target two would be a measured move above the current price swing. This analysis is for educational purposes only and not financial advice. Always trade with a solid risk management plan.
