Solana | SOL spot TRADE SETUP +65%Firstly, let's look at the SOL chart from a larger view to confirm the agreement for a bullish setup.
What we see above is a clear bullish bottom, followed by a sharp V-Shaped recovery in the daily timeframe.
From here, the ideal entry could be within this zone, either dollar-cost average or just one spot buy:
With the STOP-LOSS around here:
And THREE TP (take profit) points:
1️⃣
2️⃣
3️⃣
Naturally with the timeframe of your HOLD increasing as your target moves higher.
_________________________
BINANCE:SOLUSDT
Solanausdt

SOL/USDTHello, I hope you are well. I left you the analysis of Solana. Tell me your opinion. I saw that it is bullish and it may reach the target I set. If the white area breaks, we can buy again and go up.

SOL/USDT – Bearish Setup DevelopingSolana has broken its dynamic support and is currently in a pullback toward the broken support zone on the 4H timeframe.
This move confirms weakness, and we're watching closely for rejection signals to validate the short setup.
As long as the broken structure holds, the bias remains bearish.
🧠 Stay patient — let price complete the pullback before reacting.

A weak start for SolanaSOL starts the week trading below local support around $165. Continued weakness could lead to a retest of $155.
Failing to hold $155 could signal further weakness and the possibility of entering it's previous range with support around $142.
If prices reclaims $155, it could signal strength and potential to turn local resistance around $182 into support, reclaiming the 1D 200MA, setting the stage for the next leg up.

Solana (SOL) Rallies Above $162 Zone: Technical and FundamentalSolana (SOL) Rallies Above $162 Zone: A Technical and Fundamental Analysis of Its Path to $180 and Beyond
Solana (SOL), the high-performance blockchain network known for its lightning-fast transactions and scalable infrastructure, has once again captured the attention of cryptocurrency markets. After a fresh surge above the $162 psychological level, SOL price has entered a consolidation phase near $175, hinting at a potential breakout toward $180 and even $200. This article delves into the technical indicators, fundamental catalysts, and market sentiment driving Solana’s recent rally, while offering a balanced perspective on its short- and long-term prospects.
Technical Analysis: Rising Channel and Key Resistance Levels
1. Recent Price Action and Consolidation Phase
Solana’s price trajectory in recent weeks has been marked by volatility, but the broader trend remains bullish. On , SOL initiated a fresh upward move above the $155 and $162 zones, fueled by renewed investor confidence and macroeconomic tailwinds. The rally, however, faced resistance near $165, causing a temporary pullback.
SOL is trading near $175, consolidating gains after a 22% intraday surge. This consolidation phase aligns with the formation of a short-term rising channel on the hourly chart (data sourced from Kraken), with immediate support at $172. The channel’s upper boundary currently resides near $176, a critical resistance zone that, if breached, could trigger a fresh rally toward $180 and beyond.
2. Key Technical Indicators
• 100-Hourly Simple Moving Average (SMA): SOL price is currently trading below the 100-hour SMA, suggesting short-term bearish sentiment. However, a close above this level could signal a resumption of the uptrend.
• Relative Strength Index (RSI): The RSI on the hourly chart hovers near 50, indicating neutral momentum. A move above 60 would confirm bullish dominance.
• Volume Profile: Recent price spikes have been accompanied by elevated trading volumes, reinforcing the strength of the rally.
3. Bullish Scenario: Breaking $176 and Targeting $180
If Solana successfully clears the $176 resistance, the next immediate target would be the $180 psychological level, which coincides with the 200-day moving average. Analysts note that a sustained close above $180 could open the door to $200, driven by momentum traders and institutional inflows.
4. Bearish Scenario: Support at $172 and $165
Conversely, a breakdown below $172 would invalidate the rising channel pattern, exposing the $165 support zone. Further weakness could retest the $155 level, though this outcome appears less likely given the current bullish momentum.
________________________________________
Fundamental Drivers: 1inch Integration and Memecoin Frenzy
1. 1inch Network Integration: A Catalyst for Growth
One of the key fundamental catalysts behind Solana’s rally is its integration with 1inch Network, a decentralized exchange (DEX) aggregator and liquidity protocol. This partnership enhances Solana’s ecosystem by:
• Improving Liquidity: 1inch’s aggregation algorithms optimize trade execution on Solana-based DEXs, attracting traders and liquidity providers.
• Expanding Use Cases: The integration enables seamless cross-chain swaps, positioning Solana as a hub for multi-chain DeFi activity.
• Boosting Developer Activity: Increased infrastructure support could accelerate the launch of new decentralized applications (dApps) on Solana.
2. Memecoin Surge: The Role of Speculative Capital
Solana has emerged as a preferred platform for memecoin launches, driven by its low transaction fees and high throughput. Projects like SEED_DONKEYDAN_MARKET_CAP:BONK and NASDAQ:WEN have gained viral traction, drawing retail investors and creating a “fear of missing out” (FOMO). This speculative frenzy mirrors Ethereum’s memecoin boom in 2021–2022, with Solana’s faster and cheaper network offering a competitive edge.
3. Institutional and Retail Adoption
• Institutional Interest: Grayscale and other asset managers have added Solana to their crypto investment products, signaling growing institutional confidence.
• Retail Participation: On-chain data reveals a surge in small-cap wallet creations, indicating grassroots retail adoption.
________________________________________
Market Sentiment and Analyst Predictions
1. Bullish Outlook from Analysts
Technical analysts and on-chain experts have highlighted several factors supporting Solana’s bullish case:
• Accumulation by Whales: On-chain analytics firm Santiment reported a spike in large whale transactions, suggesting institutional accumulation.
• Network Activity Metrics: Solana’s daily active addresses and transaction volume have surged to 3-month highs, reflecting heightened network usage.
• Rare Chart Pattern: A “cup-and-handle” pattern on the daily chart implies potential for a 30–40% rally if resistance at $180 is cleared.
2. Skepticism and Risks
Critics argue that Solana’s rally is overextended, citing:
• Overbought RSI on Weekly Charts: The RSI currently resides near 75, signaling overbought conditions that could precede a correction.
• Competitive Pressure: Ethereum’s Layer 2 solutions (e.g., Arbitrum, Optimism) and rivals like Sui and Aptos continue to challenge Solana’s market share.
• Regulatory Risks: The SEC’s ongoing crackdown on crypto exchanges and tokens could dampen investor sentiment across the sector.
________________________________________
Future Projections: Path to $200 and Beyond
1. Short-Term Target: $180–$200
If Solana sustains its rally above $176, the next resistance zones to monitor are:
• $180: Psychological barrier and 200-day SMA.
• $190: Fibonacci extension level from the recent rally.
• $200: Historical resistance-turned-support from late 2023.
2. Long-Term Potential: $300+ in Q4 2024
Bullish scenarios envision SOL reaching $250–$300 by year-end, driven by:
• Spot SOL ETF Approvals: Regulatory greenlights in the U.S. could unlock billions in institutional inflows.
• AI and Web3 Integration: Solana’s partnership with AI projects (e.g., ChatGPT integration on Solana-based apps) could drive mainstream adoption.
• Bitcoin’s Bull Run: A broader crypto market rally, spurred by Bitcoin’s potential breakout above $80,000, would likely lift Solana’s price.
________________________________________
Risks and Challenges
1. Market-Wide Volatility
Cryptocurrencies remain highly correlated with macroeconomic factors, including U.S. interest rates and equity market performance. A sudden Federal Reserve pivot toward hawkish policy or a stock market crash could trigger a sector-wide sell-off.
2. Network Downtime and Security Risks
Solana has experienced periodic network outages and congestion during high demand. While the team has addressed these issues through upgrades, any future disruptions could erode trust.
3. Regulatory Uncertainty
The SEC’s classification of SOL as a security (vs. commodity) remains unresolved. Adverse regulatory rulings could impose restrictions on trading and staking.
________________________________________
Conclusion: Is Solana a Buy Ahead of the Next Leg Up?
Solana’s recent rally above $162 and consolidation near $175 underscores its resilience and growing appeal among traders and developers. Technical indicators, coupled with fundamental catalysts like 1inch integration and memecoin adoption, paint a bullish picture for SOL’s trajectory toward $180 and $200. However, investors must remain cautious of overbought conditions, competitive pressures, and regulatory risks.
For those considering exposure, a dollar-cost averaging (DCA) strategy could mitigate volatility risks, while close monitoring of on-chain metrics and macroeconomic trends will be critical. As with all investments in crypto, thorough research and risk management are paramount.
Disclaimer: This article is for informational purposes only and does not constitute financial advice. Cryptocurrency markets are highly volatile and speculative. Always consult a qualified professional before making investment decisions.

SOLANA - Tale of Two ExtremesOver the past ten months, Solana’s price action has swung from manic highs down to panic lows—and now into a disciplined base:
Euphoric Rally (Oct ’24 – Dec ’24)
SOL surged from ~$100 to a December peak near $290 on booming DeFi activity, NFT hype, and new network tooling.
The green‐shaded bars in late November/early December mark a near-vertical ramp, with “B” buy signals clustering as momentum supercharged itself.
Brutal Unwind (Jan ’25 – Mar ’25)
Once Bitcoin stalled and macro headwinds arrived, SOL gave back almost two-thirds of its value, plunging from $270 to a $96 trough by mid-March.
Red “S” sell markers at lower highs confirmed aggressive profit-taking and capitulation.
Disciplined Base Building (Mar ’25 – May ’25)
A clear single bottom at the P0 pivot around $96 (also last year’s low) drew in fresh bids each time price tested that floor.
Since early April, SOL has chopped sideways between $100–$140, tightening volatility and coiling like a spring.
2. Technical Anatomy of the Bounce
As of today, SOL sits at $175.43, flirting with short-term resistance and carving out a fresh up-move:
Level Price Role
Current (Monday’s High) $175.43 First line for breakout conviction
Year-Open Pivot (Y0) $189.50 Next hurdle—flip to support if cleared
Year-High (YH) $295.00 Measured target of the Dec rally
Dynamic Fib R1 $160.56 Prior falling-wedge resistance, now support
Dynamic Fib R3 $137.76 Secondary support on pullbacks
Volume & Momentum: Recent green candles have arrived on increasing volume, and fractal buy signals (“B” dots) cluster on each higher low—classic signs of renewed demand.
Pattern Resolution: What looked like a falling wedge from January has broken up through its upper trendline, validating the bullish bias.
3. Catalysts & Sentiment Drivers
Macro Tailwinds: Any dovish shift in Fed policy or a sustained Bitcoin rally above $70K will likely turbocharge altcoins like SOL.
On-Chain Upgrades: Watch for network announcements (e.g., new staking features, throughput improvements) that can reignite developer interest.
Event Flow:
FTX Claim Distributions: Final phases due in late May could return tokens into the ecosystem and fuel liquidity.
DeFi Incentive Programs: Fresh liquidity mining launches often spark sharp altcoin reprieves.
4. Strategic Playbook
Aggressive Entry:
Trigger: A daily close above $175.43 (Monday’s high) locks in the breakout.
Targets:
$189.50 (Y0 pivot)
$230–$250 (interim swing highs)
$295 (YH, the December peak)
Risk-Managed Longs:
Pullback Setup: A retrace to $160.56 (Dynamic Fib R1) offers a lower-risk entry with tight stops below $155.
Stop Loss: Under $137.76 (Dynamic Fib R3) keeps you clear of a retest of the March low.
Option Flavor:
Call Spreads: Consider a $180/$200 call spread into June expiries—defined risk with asymmetric upside if SOL breaks higher.
Caution:
A failure to hold $160 on a daily close exposes SOL back to the coiled range ($140–$100), so trim or hedge if that level cracks.
5. Conclusion: Coiled for Altseason
Solana’s collapse from $290 to $96 cleaned out weak hands. The subsequent wedge-style base and recent breakout attempt speak to a market that’s ready for its next leg up—provided it can conquer $175.43 and flip $189.50. Keep an eye on on-chain news and macro flows: if they align, SOL could sprint toward $230 and beyond, rejoining the next chapter of crypto’s broader altseason.

Solana Price Target: Expert Predicts $180–$200 BreakoutSolana Price Target: Expert Predicts $180–$200 BreakoutSolana (SOL), one of the most prominent blockchain platforms in the cryptocurrency market, has been on a tear recently, with its price rallying significantly. As of today, Solana’s bullish momentum has caught the attention of investors and analysts alike, with many predicting a breakout to the $180–$200 price range. This optimistic outlook comes on the back of strong technical indicators, increasing adoption, and improving fundamentals.
In this article, we’ll explore the key factors driving Solana’s price rally, analyze expert predictions, and assess whether SOL can sustain its upward trajectory to hit the $200 mark.
________________________________________
Solana’s Recent Rally: A Snapshot
Solana has seen a remarkable recovery in recent weeks, with its price climbing steadily after periods of consolidation and minor corrections. The blockchain platform, known for its high-speed transactions and low fees, is once again making waves as it captures investor interest.
Key Highlights of the Rally:
1. Price Momentum: Solana’s price surged by over 30% in the last week, breaking past key resistance levels and positioning itself for further gains.
2. High Trading Volumes: The rally has been accompanied by a significant increase in trading volumes, indicating strong market participation.
3. On-Chain Activity: Solana’s on-chain activity has also spiked, with rising transaction counts and growing usage of decentralized applications (dApps) on its network.
These developments underscore the growing confidence among investors and the sustained demand for Solana’s ecosystem.
________________________________________
What’s Driving Solana’s Price Surge?
The ongoing rally in Solana's price is being fueled by a combination of technical, fundamental, and macroeconomic factors. Let’s take a closer look at these drivers:
1. Strong Technical Indicators
Technical analysis suggests that Solana’s price is in a bullish breakout phase. Analysts have pointed to several key technical patterns that support the prediction of a move toward $200:
• Ascending Triangle Pattern: Solana’s price chart shows an ascending triangle formation, a bullish continuation pattern that typically signals a breakout to higher levels.
• Support and Resistance Levels: SOL recently broke through the $150 resistance level, which had previously acted as a key barrier. With this resistance now flipped into support, the path to $180–$200 becomes more feasible.
• Moving Averages: Solana’s price is trading well above its 50-day and 200-day moving averages, a classic bullish signal that indicates strong upward momentum.
2. Ecosystem Growth
Solana’s ecosystem has been expanding rapidly, with an increasing number of developers and projects choosing its blockchain for their applications. Key areas of growth include:
• DeFi Expansion: Solana has become a hub for decentralized finance (DeFi) projects, with platforms such as Raydium, Serum, and Marinade gaining traction.
• NFT Boom: The Solana blockchain has also emerged as a major player in the non-fungible token (NFT) space, hosting popular marketplaces like Magic Eden and SolSea.
• Gaming and Web3: Solana’s high-speed, low-cost infrastructure makes it an ideal platform for blockchain-based gaming and Web3 applications.
This growing ecosystem contributes to increased demand for SOL tokens, driving up their value.
3. Institutional Interest
Institutional investors have been steadily increasing their exposure to Solana. This trend is evident from the inflows into Solana-based investment products and the growing number of hedge funds and venture capital firms backing Solana projects.
Notably, Solana’s ability to process thousands of transactions per second at a fraction of the cost of Ethereum has made it an attractive alternative for institutional use cases.
4. Favorable Market Conditions
The broader cryptocurrency market has also been in a recovery phase, with Bitcoin, Ethereum, and other major cryptocurrencies rallying. This positive market sentiment has spilled over into Solana, amplifying its price gains.
Additionally, the macroeconomic environment—characterized by easing inflation concerns and renewed interest in risk assets—has created a conducive environment for cryptocurrencies to thrive.
________________________________________
Expert Predictions: $180–$200 Breakout
Several experts and analysts have weighed in on Solana’s price trajectory, with many predicting a move to $180–$200 in the near term. Here are some of the most notable predictions:
Technical Analysts See Bullish Patterns
Prominent cryptocurrency analysts have pointed to bullish technical patterns that suggest Solana could soon reach $200. For instance:
• Ascending Triangle Target: Based on the ascending triangle pattern, the measured move suggests a price target of $190–$200.
• Fibonacci Retracement Levels: Analysts using Fibonacci retracement levels have identified $180 and $200 as key levels of interest.
Institutional Analysts Eye $200
Institutional analysts have also expressed optimism about Solana’s price potential. A recent report by a leading investment firm highlighted the following factors supporting a $200 price target:
• Increasing adoption in the DeFi and NFT sectors.
• Strong developer activity on the Solana blockchain.
• Growing institutional inflows into Solana-based products.
Community Sentiment
The Solana community remains highly bullish, with many investors and enthusiasts sharing optimistic price targets on social media platforms. This positive sentiment often serves as a self-reinforcing mechanism, attracting more buyers and driving up the price.
________________________________________
Challenges and Risks
While the outlook for Solana appears promising, it’s important to consider the potential challenges and risks that could impact its price trajectory:
1. Competition from Ethereum and Layer-2 Solutions
Ethereum’s transition to Proof of Stake (PoS) and the rise of Layer-2 scaling solutions like Arbitrum and Optimism could pose challenges to Solana’s market share. These competitors are addressing scalability issues, reducing the competitive advantage that Solana has traditionally enjoyed.
2. Network Outages
Solana has faced criticism for network outages in the past, which have raised concerns about its reliability. Any future outages could undermine investor confidence and slow adoption.
3. Regulatory Uncertainty
The cryptocurrency market remains highly sensitive to regulatory developments. Unfavorable regulations targeting DeFi, NFTs, or blockchain technology could negatively impact Solana and the broader market.
4. Market Volatility
Cryptocurrencies are inherently volatile, and Solana is no exception. While the current rally is encouraging, sharp corrections are always a possibility, particularly if external factors such as macroeconomic events or market sentiment shift.
________________________________________
Can Solana Sustain Its Momentum?
For Solana to sustain its momentum and achieve the $200 price target, several factors need to align:
• Continued Ecosystem Growth: Solana must maintain its position as a leading platform for DeFi, NFTs, and Web3 applications. This requires ongoing innovation and developer support.
• Institutional Adoption: Increased participation from institutional investors will be critical to sustaining demand for SOL tokens.
• Positive Market Sentiment: The broader cryptocurrency market needs to remain in a bullish phase, providing a favorable backdrop for Solana’s price growth.
• Resolving Network Issues: Addressing concerns about network reliability and scalability will be key to maintaining investor confidence.
________________________________________
Conclusion
Solana’s recent rally and the expert predictions of a $180–$200 breakout highlight the growing confidence in its ecosystem and price potential. Driven by strong technical indicators, ecosystem expansion, institutional interest, and favorable market conditions, Solana appears well-positioned for further gains.
However, challenges such as competition, network reliability, regulatory risks, and market volatility remain. Investors should approach Solana with cautious optimism, balancing the bullish outlook with an awareness of the risks involved.
As Solana continues its upward trajectory, the $200 milestone could mark a significant achievement for the blockchain platform, solidifying its status as one of the leading players in the cryptocurrency space. Whether this rally leads to sustained growth or faces temporary setbacks, one thing is clear: Solana’s growing ecosystem and innovative technology make it a force to be reckoned with in the world of blockchain and decentralized applications.

Solana | BULLISH ON SOL | SOL Dominates Blockchain RevenueEven with a dip in activity particularly around memecoins, Solana has managed to hold its ground impressively when it comes to generating revenue.
While you might think fewer transactions would automatically mean less money coming in, Solana's performance shows otherwise. This ability points to the solid value being created by the different applications and uses on the network right now.
A big reason for this financial resilience is the continued strength of dApps on Solana. These apps have been really effective at bringing in fees and adding value to the network. It seems that while the hype around certain speculative tokens has died down significantly, the core utility and economic activity within Solana's dApps are still going strong. This shift towards more fundamental uses for generating revenue is a really positive sign for how the network can keep growing in the long run.
Looking ahead the future for SOL is bright imo as more projects are linking Artificial Intelligence with Solana, taking advantage of its speed and low costs to build new things. Plus, the introduction of Solana ETFs in Canada is a big step.
Other Solana-based alts including Official Trump (TRUMP), Jupiter (JUP), Raydium (RAY), and Bonk (BONK), have followed SOL with good price increases.
It seems like the focus is shifting towards building more lasting and useful applications. With ongoing support for developers and increasing interest from the traditional financial world, Solana seems well-positioned to handle market ups and downs and keep finding new ways to create value in the future. I'll definitely be watching to accumulate for the long-term.
______________________________
BINANCE:SOLUSDT

$136 Resistance Crumbles: Solana Bulls Take the Lead...Solana Breaks Key Resistance – Eyes Set on $150 and $180 Targets
Solana (SOL) has successfully broken through the strong resistance level at $136 after several failed attempts, signaling a potential continuation of its current uptrend. This breakout marks a significant technical milestone for SOL, which had previously struggled to maintain momentum above this price zone.
If Solana is able to hold above the $136–$137 level, it could open the door for further gains, with short- to mid-term price targets around $150 and $180. The breakout aligns with broader bullish sentiment in the crypto market and may attract new buyers looking to ride the trend.
For traders or investors interested in entering a position, the $136–$137 range could offer a potential entry point, provided the breakout holds and is supported by volume. As always, proper risk management is recommended, and watching for confirmation on the next few candles could be key.

SOL/USD "Solana vs U.S Dollar" Crypto Heist Plan (Swing / Day)🌟Hi! Hola! Ola! Bonjour! Hallo! Marhaba!🌟
Dear Money Makers & Robbers, 🤑 💰💸✈️
Based on 🔥Thief Trading style technical and fundamental analysis🔥, here is our master plan to heist the SOL/USD "Solana vs U.S Dollar" Crypto Market. Please adhere to the strategy I've outlined in the chart, which emphasizes long entry. Our aim is to escape near the high-risk Blue ATR Line. Risky level, overbought market, consolidation, trend reversal, trap at the level where traders and bearish robbers are stronger. 🏆💸"Take profit and treat yourself, traders. You deserve it!💪🏆🎉
Entry 📈 : "The vault is wide open! Swipe the Bullish loot at any price - the heist is on!
however I advise to Place buy limit orders within a 15 or 30 minute timeframe nearest or swing low or high level for pullback entries.
Stop Loss 🛑:
📍 Thief SL placed at the recent/swing low level Using the 4H timeframe (120.00) Day/Swing trade basis.
📍 SL is based on your risk of the trade, lot size and how many multiple orders you have to take.
🏴☠️Target 🎯: 168.00 (or) Escape Before the Target
🧲Scalpers, take note 👀 : Only scalp on the Long side. If you have a lot of money, you can go straight away; if not, you can join swing traders and carry out the robbery plan. Use trailing SL to safeguard your money 💰.
💰💵💸SOL/USD "Solana vs U.S Dollar" Crypto Market Heist Plan (Day / Swing Trade) is currently experiencing a bullishness,., driven by several key factors.☝☝☝
📰🗞️Get & Read the Fundamental, Macro, COT Report, On Chain Analysis, Sentimental Outlook, Intermarket Analysis, Future trend targets.. go ahead to check 👉👉👉🔗
⚠️Trading Alert : News Releases and Position Management 📰 🗞️ 🚫🚏
As a reminder, news releases can have a significant impact on market prices and volatility. To minimize potential losses and protect your running positions,
we recommend the following:
Avoid taking new trades during news releases
Use trailing stop-loss orders to protect your running positions and lock in profits
💖Supporting our robbery plan 💥Hit the Boost Button💥 will enable us to effortlessly make and steal money 💰💵. Boost the strength of our robbery team. Every day in this market make money with ease by using the Thief Trading Style.🏆💪🤝❤️🎉🚀
I'll see you soon with another heist plan, so stay tuned 🤑🐱👤🤗🤩

Solana SOL Reveals The Manipulator's Plan!Hello, Skyrexians!
It's time to update BINANCE:SOLUSDT analysis. We have already told about Solana dump when price was next to $300 where told about $110 and as usual did not count last wave, but anyway bounce from this area was anticipated. What is next?
Recent top was the wave 5 of higher degree, we have shown it many times, today no need to do it again. Now asset is in ABC correction. Wave A was 5 waves shaped. Last wave has been finished with the green dot on the Bullish/Bearish Reversal Bar Indicator and now we are in the wave B. It has the target at 0.5-0.61 Fibonacci which is somewhere next to $200. From there we expect the huge crash below $90 in the wave C. Solana potential dump is not cancelling potential altseason on OTHERS.D because it's in top-10 crypto cap assets. May be it's time to transfer money from overvalued SOL to undervalued crypto?
Best regards,
Skyrexio Team
___________________________________________________________
Please, boost this article and subscribe our page if you like analysis!

Many bullish signs for Solana longSolana is starting to look like building bullish momentum.
Bullish signs:
Daily:
The price broke out of a prolonged descending parallel channel, retested the top trendline of the channel and started to move up.
The price broke and closed above EMA21 (first hurdle of many!) and has been above it for several days.
The price is above the major support zone around 117.
RSI and MACD are both still in the bear zone, however, they are clearly pointing up and about to enter the bull zone.
4H:
MACD and RSI are both in the bull zone.
The price is above EMA 22.EMA 21 is above EMA55.
EMA 200 is traveling horizontally across the recent price range, but the latest candle was strongly bullish and closed above all EMAs.
While EMA200 is horizontally moving, the price will probably oscillate in the range bound. But once EMAs line up for the bullish set up (EMA21 > 55> 22) in 4H, I will consider open a long position based on the 4H chart.

Canada Approves First Spot Solana ETFs, Launch Set For 16th AprThe Ontario Securities Commission (OSC) has approved the world’s first spot Solana (SOL) exchange-traded funds (ETFs), marking a major step forward for crypto investment products in North America. Beginning April 16, 2025, several asset managers—Purpose Investments, Evolve ETFs, CI Global Asset Management, and 3iQ—will offer direct exposure to SOL on Canadian exchanges.
Unlike derivatives-based products, these ETFs will hold physical SOL tokens, giving both institutional and retail investors a regulated way to invest in the Solana blockchain ecosystem. Each provider will track a separate index, allowing for a range of strategies. In addition, these funds will feature staking options, providing a potential yield advantage over other crypto ETFs.
With this approval, Solana becomes the third cryptocurrency to receive spot ETF approval in Canada, following Bitcoin and Ethereum. The news has sparked increased whale activity and fresh speculation that the United States could follow with its own Solana ETF approvals in the future.
Technical Analysis
Solana’s price has been trading below $150, consolidating within a wider range. The key technical level to watch is $147, which marks an internal structure lower high. A strong break and close above $147 could signal a bullish shift in market structure, potentially triggering upward momentum. On the other hand, if the price fails to close above this level, it may drop below $120, reinforcing bearish pressure.
The ETF launch could become a catalyst for either outcome, depending on how the market reacts to the new inflows. At present, Solana continues to trade just below the critical threshold, awaiting a decisive move as April 16 approaches.

Breaking: Purple Pepe ($PURPE) Is Gearing Up For BreakoutPurple pepe ($PURPE) One of the OG Pepe coins on Solana. Originally created July 2023, the token sat dormant on the blockchain. A year later, liquidity was added and trading went live.
The memecoin is now gearing up for a breakout once it breaks the $0.000046 psychological resistant zone, a 60% price surge is feasible with increasing momentum as hinted by the RSI at 54.72.
The crypto market is still volatile with CRYPTOCAP:BTC swinging in between the $80,000 - $85,000 support points. The memecoin hype is moderate now, most especially the Solana memecoinomy but the price of CRYPTOCAP:SOL has taken a deja vu lately, surprising the crypto market by reclaiming the $130 pivot point.
Should CRYPTOCAP:SOL undergo a bullish continuation pattern, this same momentum might dissipate to the Purple pepe ($PURPE) coin and not only $PURPE coin, but almost all the coins in the Solana ecosystem.
However, On a bearish tone, if $PURPE should fail to pull the bullish stunt, there is a possibility of a break below the $0.000035 support point which will negate the bullish thesis previously given as it will resort to massive selling spree.
Purple Pepe Price Live Data
The live Purple Pepe price today is $0.000041 USD with a 24-hour trading volume of $788,837 USD. Purple Pepe is down 4.21% in the last 24 hours. With a live market cap of $17,071,104 USD. It has a circulating supply of 417,213,801,892 $PURPE coins and a max. supply of 420,690,000,000 $PURPE coins.

SOLANA (SOL/USDT) – TP: 170 - 252 & 295SOLANA (SOL/USDT) is currently trading at $130.17 after rebounding from a well-defined sell-side liquidity zone between $98 and $131. The recent weekly candle shows a strong bullish recovery (+22.93%), suggesting that liquidity has been swept and buyers are stepping in. This level has historically served as a key accumulation zone, and the bounce aligns with oversold conditions on the StochRSI, which is now curling upward — indicating growing bullish momentum. If price sustains above the $125–131 level, the next immediate upside target lies between $170 and $188, where prior supply and consolidation occurred. A confirmed breakout above this range opens the path toward a higher resistance zone between $254 and $295 — a region that aligns with unfilled inefficiencies and previous price distribution.
The ideal swing trade approach would be to enter on a pullback within the $110–125 range, set a stop loss below $98, and scale out at the $170 and $254 levels. This setup offers a favorable risk-to-reward ratio of approximately 1:3.5.
Trade Strategy Suggestion (Swing or Positional):
Entry: Ladder between $115–$125 on retrace
SL: $105–110 (below wick low)
TP1: $170–188
TP2: $254–295
Scaling Out: 50% at TG1, rest at TG2 or trail stops above $200
With macro tailwinds like renewed interest in Solana’s DeFi and meme coin ecosystems, institutional flow returning, and technical confirmation across multiple timeframes, this could be a high-conviction mid-term play for swing traders and positional investors alike.
🔮 Narrative & Fundamentals:
ETH L2 congestion → SOL gets transactional inflows
SOL’s DeFi, NFT, and memecoin activity resurging (e.g., SEED_WANDERIN_JIMZIP900:WIF , SEED_DONKEYDAN_MARKET_CAP:BONK ecosystem)
Institutional flow picking up (Grayscale SOL trust rallying)
SOL remains one of the fastest L1s with growing developer traction

Solana Surges Nearly 8% As Janover Pivots to Solana Treasury The price of Solana ( CRYPTOCAP:SOL ) famously known as the ethereum killer has surged nearly 8% today as Commercial property platform Janover pivots to Solana treasury strategy, stock surges 1,100% as investors rush in prior the news.
Janover has invested over $9.6 million into Solana (83,000+ SOL) as part of a new digital asset treasury strategy, with plans to stake its holdings and run validators to generate onchain revenue.
The move follows a $42 million funding round and has triggered a 1,100% surge in Janover’s stock price as the company positions itself as a transparent, publicly traded vehicle for crypto exposure.
Solana has lost grip of the $120 pivot for the past 2 weeks, but reclaimed the zone today currently trading at $120.54 per $SOL.
The daily price chart shows Solana has been trading within an enclose rectangular zone with the Resistant and support points slightly above each other. For Solana, a break above the $170 zone could pave way for a move to the $200- $270 zone. Similarly, a break below the $100 zone could be catastrophic for Solana.
However, the RSI shades a bit of a light at the end of the tunnel as it stands at 47, which is prime for a reversal.

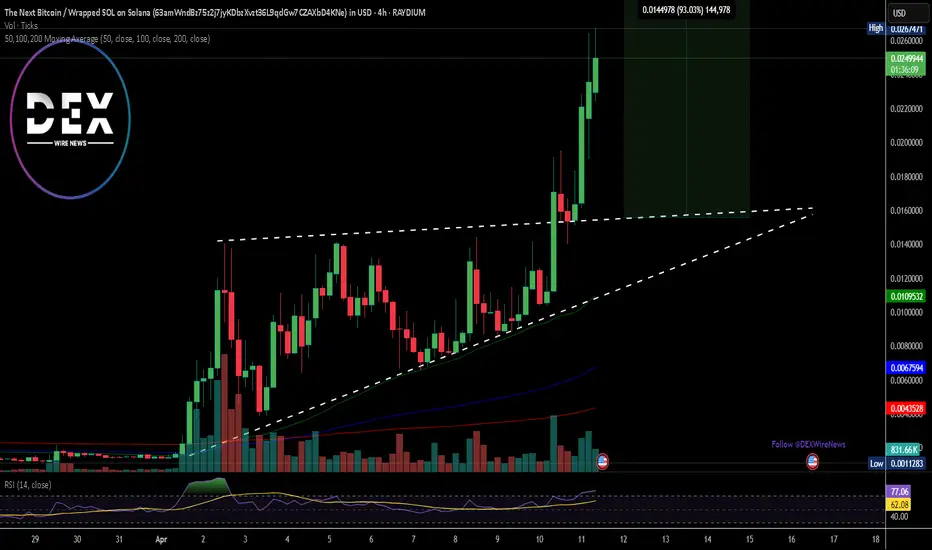
Breaking: $BUTTCOIN Spikes 50% Gearing Up For 100% Surge The price of "The Next Bitcoin" ($Buttcoin) broke out of a bullish symmetrical triangle pattern soaring 50% and setting sail for 100% voyage amidst build-up momentum and increase hype.
Based on the 4-hours time chart, the asset broke out of a presumed symmetrical triangle pattern albeit the crypto market was overall consolidating yesterday.
The 4-hour price chart depicts a typical three white crow pattern, a pattern generally seen as a continuation of a current trend with ($BUTTCON) gearing up for a 100% surge as hinted by the Relative Strength Index (RSI) at 77.
What is The Next Bitcoin?
Buttcoin (BUTTCOIN) is a playful twist on the cryptocurrency landscape, embodying the spirit of a meme while functioning as a real token. Launched on January 30, 2025, on Pump.fun, it’s a community-driven memecoin on the Solana blockchain. The concept was inspired by a humorous 2013 YouTube video by James D. McMurray, which satirized Bitcoin's complexities and introduced Buttcoin as a simpler alternative.
The Next Bitcoin Price Live Data
The live The Next Bitcoin price today is $0.024262 USD with a 24-hour trading volume of $14,482,140 USD. The Next Bitcoin is up 50.31% in the last 24 hours, with a live market cap of $24,241,574 USD. It has a circulating supply of 999,151,679 BUTTCOIN coins and a max. supply of 1,000,000,000 BUTTCOIN coins.
SOL LONG????🔍 Overall Market Structure
The price recently saw a sharp drop from the $120.69 high and is currently consolidating around the $108–110 area.
A bullish structure is forming, suggested by the potential for a reversal pattern from a support zone.
🧠 Key Technical Components
📉 Fibonacci Levels (retracement from $101.21 to $120.69):
0.236 – $115.78 (resistance)
0.382 – $112.84
0.5 – $110.53
0.618 – $108.25 ← Current support
0.786 – $105.20
Price is bouncing from the 0.618 zone, a strong reversal area.
🟣 RSI (Relative Strength Index):
RSI is near oversold (31.15) and showing bullish divergence:
Price made lower lows.
RSI made higher lows.
This divergence suggests momentum is weakening on the downside, signaling a potential bullish reversal.
🟪 Support & Resistance Zones:
Demand Zone (support) around $107–108 (marked with purple box).
Supply Zone (resistance) around $118–120.
Price could bounce from support, targeting higher fib levels and possibly retesting the supply zone.
✏️ Projected Price Action (Black Curve):
Anticipated short-term reversal from $108.
Price might climb through:
$110 (0.5 fib)
$112.84 (0.382 fib)
Potentially to $115.78 (0.236 fib) or even back to the $120.69 high.
Shown within a larger wedge structure, so upper trendline resistance around $120.
✅ Conclusion:
Bullish reversal likely from $107–108 support.
RSI divergence + Fibonacci confluence supports the reversal thesis.
Next targets: $110.50 → $112.84 → $115.78 with final resistance near $120.69.


SOL short OP if it pumpsSOL short possibility at $125 if there's a pump. Tight stop at $130, Take profit $101

SOL Trade Plan: Daily Support, Liquidity Grab & Trade Idea.Solana (SOL) is currently navigating a challenging market environment, with broader sell-offs across the crypto space weighing heavily on its price action. On the daily and 4-hour timeframes, SOL has traded into a significant support zone, marked by previous swing lows. This area has historically acted as a magnet for buyers, but the recent dip below these levels suggests a liquidity grab is underway. This move has likely triggered sell stops sitting below the lows, creating the potential for a reversal as smart money steps in. ⚡
Zooming into the 15-minute timeframe, SOL is consolidating within a tight range, reflecting a period of indecision. This range-bound behavior often precedes a breakout, and a bullish break above the range could signal the start of a recovery. A shift in market structure—marked by higher highs and higher lows—would provide further confirmation of bullish intent.
Key Insights:
Daily Timeframe: SOL has dipped below key support levels, sweeping liquidity.
4-Hour Timeframe: Price is overextended, trading into a critical demand zone.
15-Minute Timeframe: Consolidation within a range, awaiting a breakout for directional clarity.
Trading Plan:
Patience is Key: Wait for SOL to break out of the 15-minute range to the upside. 🚀
Market Structure Confirmation: Look for a clear shift to bullish market structure (higher highs and higher lows). 📊
Entry Strategy: Enter long positions after confirmation, with a stop-loss placed below the range low. 🛡️
Profit Targets: Focus on resistance levels on the 4-hour and daily timeframes for potential take-profit zones. 🎯
Levels to Watch:
Support Zone: Previous daily swing lows, now acting as a liquidity zone.
Resistance Zone: The upper boundary of the 15-minute range and key levels on the 4-hour chart.
This setup highlights the importance of waiting for confirmation before entering a trade. While the liquidity grab below support is a promising signal, a breakout and bullish structure are essential to avoid false moves. As always, this is not financial advice—traders should conduct their own analysis and manage risk appropriately. ⚠️

SOLANA LONG Bullish Testing SupportNever the less as Solana trend looks bearish(Only from the point of view of price action traders, ema traders, breakout traders) and I DONT SHARE this opinion,because I use another TA to define the trend.
Monthly VP is at 0.02%, for VP traders it is bullish( while MA tradrs say it is bearish).
The price of solan is at historical lowest point of VAL(18 month volume profile).Therefor at this point sellers and buyers dont find an accepted price .If the sellers want to push down theprice,the number of buyers reduces.This leads to a market balance,as now many imbalances have been restored.While EMA,SMA and many other indicators are lagging indicators,they react when the show is over!!!!!!,VP delivers price information real time
Also now commercials starting buying solana(COT report) while speculators selling it(Speculatorsare90% of time wrong)!
Ofcourse many would suggest that we have bearish sentiment dat,inflation, recession etc.
Fundamentlas show their impact alsotoo late. And all these information are priced in.
Ok now to my setup:
We have tested the support twice successfully. Solana can start to move in TP 1 direction.
If price reaches tp1
and continues to move ahead,this will be a good sign that Solana bulls gaining more control, while sellers start to take profit.
If TP 1 rejects,we expect that solana will fall back to support going for TEST 3.
IF SUPPORT TEST § WAS SUCCESSFUL.tHAT MEANS sOLAN CANNOT BREAK THIS SUPPORT THE MARKET STARTS TO MOVEUP QUICKLY to TP 2,3,4 and 5
If solana not successful, then it targets 115% Fibo retracement, and then 127% and so on. For us it means to wait until one of the retracement levels rejects
I buy there where others put their stops,because their stop management is planned by price action, that everyone can see.Therefor 90% of time they fail.

SOL/USDT May SOL lose the weekly support? Key Level to buy!Hey traders! 👋 Let’s dive into the weekly chart for SOLUSDT.
📊 Current Price Action:
SOL is trading at $112.20, down 10.96% on the weekly chart. The price has been consolidating in a "Buying Zone" between the weekly support levels of $110.17 and $131.68. This zone has historically acted as a strong base, with the price bouncing from this area multiple times since late 2023.
🟢 Buying Zone and Support:
The current price is sitting in a critical "Buying Zone" between $110.17 and $131.68. This area has acted as a springboard for previous rallies, and if SOL holds above $110.17, it could be a good opportunity for accumulation. A break below $110.17, however, might lead to further downside toward the next support at $80.18 or even $54.00.
🎯 Target:
If SOL manages to break through the $195.71 resistance, the next major target is its previous ATH at $260. I’ve projected a potential move to $295.71, which would be a 95.71% increase from the current price of $112.20. This target aligns with the historical price structure and Fibonacci extensions.
⚠️ Risk Management:
Keep an eye on the $110.17 support. A weekly close below this level could signal bearish momentum, potentially driving the price toward lower supports. On the upside, watch for a strong breakout above $195.71 with high volume to confirm the bullish scenario.
What do you think about SOL’s setup? Are you bullish or bearish on Solana? Let’s discuss in the comments!
#SOLUSD #Solana #Crypto #TechnicalAnalysis #Breakout
