Long $JTO JITOSolana eco popping off. Havent had time to post a chart to much going on in markets. Long JTO here. Not Advise, good luck.
Solanausdt

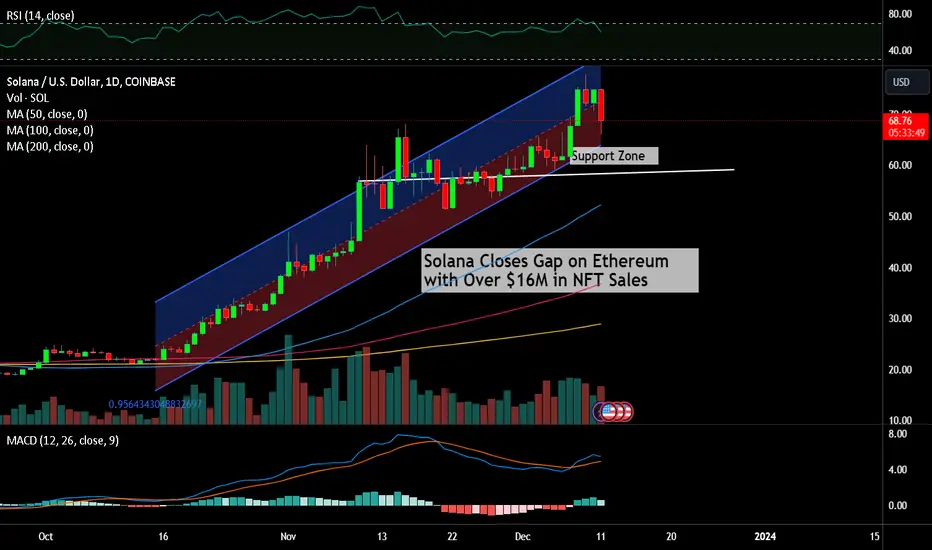
Solana Closes Gap on Ethereum with Over $16M in NFT SalesSolana emerges as a formidable threat to Ethereum’s throne as the network looks to outshine it from different angles.
Solana’s incredible performance this year has positioned the project as a formidable threat to Ethereum’s reign as the network turns heads with its on-chain and trading activity.
After successfully surpassing Ethereum in on-chain activity, Solana outshines its rival in another important metric, NFT sales.
Solana Outpaces Ethereum
Ethereum has ruled the NFT industry for years with its trading volume, projects, user adoption, and more. However, considering its persistent issues like network congestion and rising fees, its dominance is proving fleeting as competitors like Solana close the gap.
Following Solana’s historic run this year, registering over 800% in gains and marking record DEX volumes and network transactions, the network surpassed Ethereum in NFT sales on December 9 after hosting over $16 million.
Bitcoin and Ethereum trailed closely behind with $13.4 and $11.4 million in sales, respectively. Although Solana remained the second-largest NFT protocol at the time of writing, its trajectory signals a credible threat to Ethereum’s throne.
Solana’s success in the NFT sector aligns with investors and developers slowly warming up to the network and recognizing its potential. While the network is still miles behind Ethereum when considering historical data, Solana’s uprising could signal a massive shift in the industry’s market dynamics.
Why This Matters
Solana overtaking Ethereum signals a potential shift in industry dynamics. Ethereum has long been the dominant force in the NFT sector, boasting high volumes, adoption, and sales. However, Solana is slowly closing the gap and giving the network a run for its money.
Solana's correction!I've told you before that we'll see a correction in Solana price by hitting to the resistance level. Now you can see this correction. this correction can continue till the supporting levels. the first supporting level is 64$ and the another is 45$.

SOLUSDT Breakout Signals Strong Bullish Momentum.SOLUSDT shows upward movement post breakout and retracement, aiming for $80 target.
Alternatively a potential dip to the Fibonacci .5 level might occur, with the rebound anticipated from that point.
It is essential for traders to monitor the market closely and be prepared for both bullish and bearish scenarios.
SOLUSDT (4h Chart) Technical analysis
SOLUSDT (4h Chart) Currently trading at $61
Buy level: Above $60
Stop loss: Below $55
TP1: $64
TP2: $68
TP3: $70
TP4: $80
Max Leverage 5x
Always keep Stop loss
Follow Our Tradingview Account for More Technical Analysis Updates, | Like, Share and Comment Your thoughts

Solana is going to be risky!Now Solana is arriving to the first goal that is 77$. If you have caught profit, you can save it now. you can buy it again, if it crosses 77$ resistance level well.

SOL - 4H bearish in the trading rangeSOL Coin Analysis: We're seeing signs of a potential drop to the bottom of the trading range for Solana coin, leading to a consolidation zone. The upward price action is less convincing than the downward movements, and Solana coin has shown resistance zone reactions. Additionally, the RSI divergence in the 4-hour timeframe further indicates a likely fall in SOL's price. Therefore, we expect a descent to at least the lower boundary of the trading range.

SOLUSDT triangle supportCRYPTOCAP:SOL approaching fibonacci support near triangle support, this is a good opportunity to enter bullish market.
we can set 3 different target, at triangle resistance, fibonacci projection and triangle projection
My trading today :
Buy now around 60.163
Pending buy at 58.390
close 50% position at 65.451
close 25% position at 71.000
close 25% position at 88.169
happy trading

Potential Breakout for Solana with Favorable IndicatorsI wanted to bring your attention to an exciting opportunity in the cryptocurrency market, specifically regarding Solana (SOL). Based on recent market analysis, it appears that SOL is poised for a potential breakout.
Several key indicators suggest a favorable outlook for SOL's price movement. Firstly, the Relative Strength Index (RSI) is currently in a neutral position, indicating that the cryptocurrency is not overbought or oversold. This suggests a balanced market sentiment and potential room for upward movement.
Additionally, the Commodity Channel Index (CCI) is in the upper band, further reinforcing the positive outlook for SOL. This indicates that SOL's price is trending higher than the average price over a given period, signaling potential bullish momentum.
Furthermore, the moving average combination displays a buy signal for SOL. This combination of moving averages is widely regarded as a reliable indicator for determining market trends. In this case, the moving average combination indicates a potential upward movement for SOL's price.
Considering these indicators, it is reasonable to conclude that SOL is presenting a compelling opportunity for investors. The combination of a neutral RSI, CCI in the upper band, and a buy signal from the moving average combo suggests a potential breakout shortly.
I wanted to share this information with you, as I believe it could be of interest to you and align with your investment strategy. However, I encourage you to conduct your research and consult with your financial advisor before making any investment decisions.
Should you have any questions or require further information, please do not hesitate to comment away. I am here to assist you.

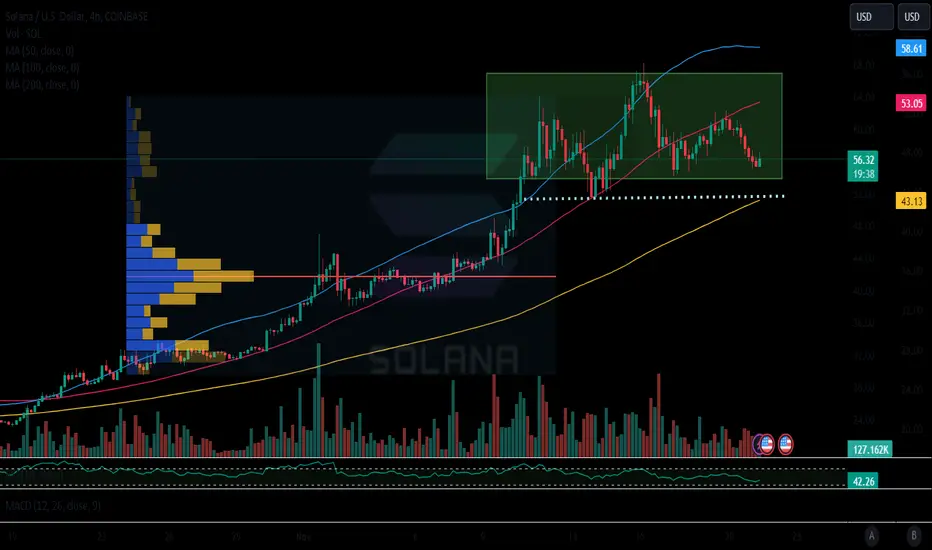
#SOL/USDT 3 Days chart pointing for a correction.#SOL (On request): If I were you, I would wait for a correction to enter if not holding yet.
If you have it on spot, better hold it for the next 18 months or so.
The green box aligns with the .618 golden pocket, which will be the point where buyers are likely to show interest.
Not Financial advice, DYOR

Solana Local Top PossibilityWhen things get trending on high time frames I am a big fan of line break charts. This one here on Solana has not yet confirmed red but RSI is very sus. Setting very tight stops on longs now. Also debating on scaling out of long term swing bags. Not advise, good luck.

SOL - Solana BUY and SELL TargetsHi Traders, Investors and Speculators of Charts📈📉
As you know, we're trading in the opening moments of a new bullish cycle.
If you're trading Solana, this is the ONLY PLAN you need. In this analysis:
📢 Short Term Targets / highs and lows
📢 Near Term Targets / highs and lows
📢 Longer Term Targets / highs and lows
📢 Technical Indicator, short and near term
📢 Fractal / percentage increase to dump analysis
It's important to note that any cycle takes months to complete, sometimes even stretching over a year. Keeping this in mind helps you set realistic timeframe-goals for price targets.
If you found this content helpful, please remember to hit like and subscribe and never miss a moment in the markets.
_______________________
📢Follow us here on TradingView for daily updates📢
👍Hit like & Follow 👍
We thank you for your support !
CryptoCheck

Solana (SOL) Eyes Dangerous BreakthroughSolana (SOL) is eyeing a dangerous breakthrough since it fell below the $60 support zone on Nov. 20. At the time of writing, Solana is trading at a price of $58.21, up 2.36% in the past 24 hours. The core Solana metrics are bullish and suggest recapturing the $60 price level is imminent in the near term.
Since Solana was rejuvenated this year, its price has been on a meteoric rise that saw it push past the psychologically important threshold at $60 on Nov. 15. Bears did not allow Solana to form a support above this threshold, and as such, it lost its grip and retraced back to a low of $51.6 on Nov. 22.
The attempt to reclaim $60 has become a key hurdle that SOL bulls have been unable to work their way past in recent times. With the current outlook and resolve as showcased in the 6.64% jump in trading volume to $1,374,937,101, a consistent increase in the trading volume is a sign retail investors are flooding the market. Notably, their presence can help stabilize the price as SOL makes an attempt to reclaim its lost mandate.
Solana (SOL) Price Riding on History
While in the immediate term, the $60 price target may seem an ambitious level to breach, it is worth noting that Solana has traded at a level far higher than this in the past. Prior to the FTX collapse of 2022, Solana traded at an all-time high (ATH) of $260. This implies that the ultimate goal is to retest this ATH by first conquering as many immediate price levels as possible.
Solana is no longer tied to the pangs or negative impacts of the FTX implosion, and though the bankrupt exchange continues to sell off the coin in its liquidation spree, Solana has made a crucial anchor that naturally attracts other liquidity to it.

SOL trade setup through December.Here's my recent trade set up for SOL that will go through to Jan 1st 2024.

SOLANA Good Long SetupSolana shows good setup for a long entry. If SOL doesn't decide to chop till Monday, we could see something like this.

Solana (SOL) in a Bearish ScenarioSolana's price has exhibited a bearish 'head and shoulders' pattern over the last ten days in a 4-hour timeframe. This technical formation suggests a potential reversal from its previous bullish trend.
The crucial aspects of this pattern are:
Solana's price has exhibited a bearish 'head and shoulders' pattern over the last ten days in a 4-hour timeframe. This technical formation suggests a potential reversal from its previous bullish trend. The crucial aspects of this pattern are:
Neckline Position: The neckline of the pattern is at $51. A break below this level could lead to a downward movement towards a target price around the strong support zone near $40. Currently, Solana is trading at $54.
EMA 200 Influence: The 200-period Exponential Moving Average (EMA 200) is at $46. A fall below this average could confirm the bearish trend.

Solana (SOL) coin completed setup for upto 27.50% pumpHey dear friends, hope you are well, and welcome to the new trade setup of Solana (SOL) coin with US Dollar pair.
Recently we caught almost 80% pump of SOL as below:
Now on a daily time frame, SOL has formed a bullish Gartley move for the next pump.
Note: Above idea is for educational purpose only. It is advised to diversify and strictly follow the stop loss, and don't get stuck with trade.

Can Solana (SOL) Test The Highs of $70?Solana (SOL)
Solana has been following an upward trend. The asset has increased by 400% in the past two months, one of the best performance rates among altcoins in the top 100 by market capitalization.
SOL is currently trading between the support zone of $51.2-$54.7 and the resistance range of $62-$68. The most likely scenario remains a continuation of the growth trend. If Bitcoin's upward trend continues, SOL might test the next highs at $70 and $75.
Any correction in Bitcoin's chart is likely to similarly affect SOL's price. The next support levels for SOL lie at $47.2 and within the range of $37.80-$42. A rapid and voluminous decline in BTC could lead to Solana losing many of its support zones, thus making trading with limit orders highly risky at this moment.
SOL DEX Adds 3 Billion in New Trading Opportunities - Time to GoSOL DEX (decentralized exchanges) has recently added a staggering 3 billion in new trading opportunities, and it's time for you to take advantage of this exciting opportunity!
Imagine the possibilities that lie ahead as Soldex and Raydium, the leading decentralized exchanges, expand their trading volume by billions. This remarkable achievement not only demonstrates the growing popularity of SOL but also signifies the immense potential and trust placed in this cryptocurrency.
Now, you might be wondering, "What does this mean for me?" Well, let me tell you - this is your chance to go long on SOL and ride the wave of success! With the addition of 3 billion in new trading, SOL is poised to experience substantial growth and present you with potentially lucrative trading opportunities.
Why should you consider going long on SOL? Here are a few compelling reasons:
1. Unprecedented Trading Volume: The addition of 3 billion in new trading opportunities has catapulted SOL to new heights, attracting a diverse range of traders and investors. This surge in trading activity presents an ideal environment for profit potential.
2. Strong Market Demand: SOL has been gaining significant attention and recognition within the crypto community due to its innovative technology, scalability, and robust ecosystem. As more traders flock to SOL DEX, the demand for SOL is expected to surge, which can drive up its value.
3. Future Growth Prospects: SOL's impressive track record and continued development make it a promising investment option. With its commitment to scalability, security, and efficiency, SOL is well-positioned to become a leading force in the crypto market.
So, what are you waiting for? Seize this opportunity to get in on the action and go long on SOL today! The momentum is building, and you don't want to miss out on potential gains.
Remember, success often favors those who act swiftly and decisively. Don't let this incredible chance pass you by! Take the leap and go long on SOL now.

Journey with Sol (EMA 20 > 50 & 100, and RSI balanced at 58Solana is then a shining star that has been catching the attention of experts and investors alike.
What makes Sol truly special? Let me paint you a picture: imagine a scenario where the Exponential Moving Average (EMA) 20 is soaring above both EMA 50 and EMA 100, indicating a bullish trend. Simultaneously, the Relative Strength Index (RSI) holds steady at a balanced 58, signaling a perfect equilibrium between buying and selling pressure. Now, doesn't that make your inner trader dance with joy?
Given these promising indicators, I wholeheartedly encourage you to consider getting on board with Sol. This gem has the potential to bring some serious sunshine to your portfolio. It's time to capitalize on this golden opportunity and embark on an exciting journey towards profitability.
So, don your shades and join the ranks of successful traders who have already aligned themselves with Sol. Take action today and seize the moment to go long on Sol, setting sail on a happy and prosperous trading adventure.
Remember, opportunities like this don't come around every day. Let Sol light up your trading path and help you achieve your financial goals. Don't wait! Start your sunny journey with Sol today!

SOL: Pullback in UptrendSolana (SOL) technical analysis:
Trade setup : Following a bullish breakout from Falling Wedge pattern, price rallied over 200% to $60 resistance where it paused briefly and broke through it. There was a Bearish RSI Divergence that formed after price made a Higher High but RSI made a Lower High. Price could pullback to $47 support area, which is close to a 50% Fibonacci retracement level as well. That could be an attractive swing trade entry in Uptrend. Price appears poised to continue its run and revisit $80 resistance.
Trend : Uptrend across all time horizons (Short- Medium- and Long-Term).
Momentum is Bullish but inflecting. MACD Line is above MACD Signal Line and RSI is above 55 but momentum may have peaked since MACD Histogram bars are declining, which suggests that momentum is weakening.
Support and Resistance : Nearest Support Zone is $47 (previous resistance), then $38. The nearest Resistance Zone is $60, then $80.

SOL | Solana| $ 12.4-12.7 Buy |long entry pointThe lingering fall will end in the specified range. I put a limit order in long. We will continue to follow the chart of this instrument.

AMKE WEDGE IN SOLANA📈At the lower ceiling created by the last swing, there is a possibility of gathering the trend for the next jump
📡 For more communication with us, send a message in TradingView.

Bitxer's SOL/USDT Analysis - Spot On🌟 Bitxer's SOL/USDT Analysis - Spot On! 💥📊
🎯 Analysis Validation:
SOL/USDT's recent movement aligns perfectly with Bitxer's analysis.
As anticipated, SOL/USDT hit the projected mark at 66.52.
🔍 Accuracy at Its Finest:
Bitxer's insights continue to deliver 100% accurate predictions.
🚀 Stay Connected for More:
Keep following Bitxer for dependable and precise market signals.
💡 Insights for Success:
Bitxer aims to provide you with the best trading guidance for success.
Stay tuned for further insights and accurate signals from Bitxer! 🌟📈🚀
