SOL/USD "Solana vs US Dollar" Crypto Market Heist Plan🌟Hi! Hola! Ola! Bonjour! Hallo! Marhaba!🌟
Dear Money Makers & Robbers, 🤑💰✈️
Based on 🔥Thief Trading style technical and fundamental analysis🔥, here is our master plan to heist the SOL/USD "Solana vs US Dollar" Crypto market. Please adhere to the strategy I've outlined in the chart, which emphasizes short entry. Our aim is the high-risk Green Zone. Risky level, oversold market, consolidation, trend reversal, trap at the level where traders and bullish robbers are stronger. 🏆💸Book Profits Be wealthy and safe trade.💪🏆🎉
Entry 📈 : "The vault is wide open! Swipe the Bearish loot at any price - the heist is on!
however I advise to Place buy limit orders within a 15 or 30 minute timeframe most recent or swing, low or high level. I Highly recommended you to put alert in your chart.
Stop Loss 🛑:
Thief SL placed at the recent / swing low level Using the 4H timeframe (150.00) swing trade basis.
SL is based on your risk of the trade, lot size and how many multiple orders you have to take.
Target 🎯: 90.00 (or) Escape Before the Target
🧲Scalpers, take note 👀 : only scalp on the Short side. If you have a lot of money, you can go straight away; if not, you can join swing traders and carry out the robbery plan. Use trailing SL to safeguard your money 💰.
SOL/USD "Solana vs US Dollar" Crypto market is currently experiencing a Bearish Trend,., driven by several key factors. 📰🗞️Read Fundamental, Macro, COT Report, On Chain Analysis, Sentimental Outlook, Intermarket Analysis, Future Prediction:
📌Keep in mind that these Fundamental factors can change rapidly, and it's essential to stay up-to-date with market developments and adjust your analysis accordingly.
⚠️Trading Alert : News Releases and Position Management 📰 🗞️ 🚫🚏
As a reminder, news releases can have a significant impact on market prices and volatility. To minimize potential losses and protect your running positions,
we recommend the following:
Avoid taking new trades during news releases
Use trailing stop-loss orders to protect your running positions and lock in profits
💖Supporting our robbery plan 💥Hit the Boost Button💥 will enable us to effortlessly make and steal money 💰💵. Boost the strength of our robbery team. Every day in this market make money with ease by using the Thief Trading Style.🏆💪🤝❤️🎉🚀
I'll see you soon with another heist plan, so stay tuned 🤑🐱👤🤗🤩
Solanausdt

$125 buy target for Solana$125 buy target for Solana
My previous analysis came to play. The green TL acted as resistance zone despite the false breakout.
I see this baby coming down to kiss the blue TL as a support level before another push up.
I have a buy entry for $125.
Trade with caution as crypto market is a volatile one.
Please share your thoughts, like and follow for more charts.

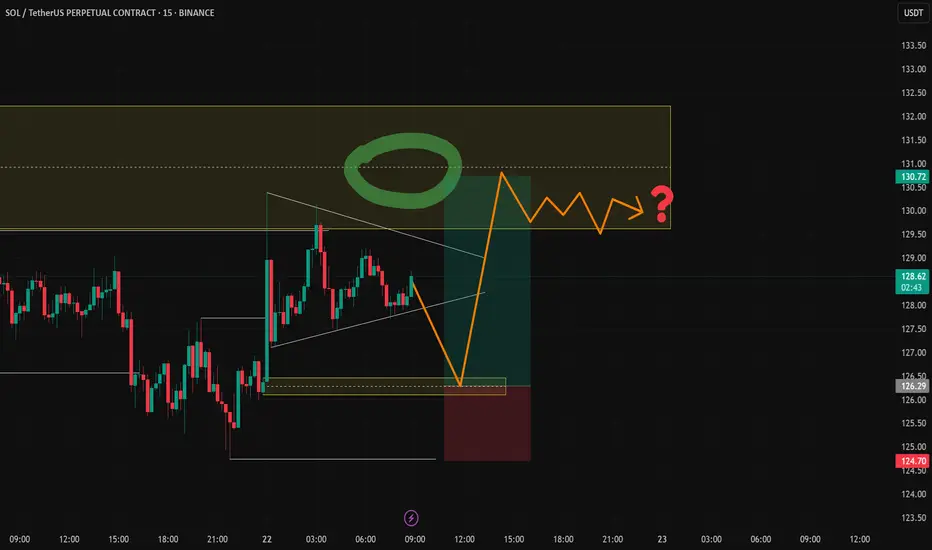
solana trade setup 15min chart* if you are trading on market orders need to set limit order *
i say this because last week it has going all directions and playing with strict levels are important
just spotted a triangle forming which could be drying up in volume as of recording this chart setup it saturday where major market remains closed the volume and volatility will be low
buy area 126-126.50 target 130.5 to 131 sl 124.70-50
triangle is trap for liquidation be careful !!
JUST IN: First Solana ETFs to Launch in The US TomorrowThe highly functional open source project that banks on blockchain technology’s permissionless nature to provide decentralized finance (DeFi) solutions is set to debut its First Spot ETFs in the US tomorrow.
Price of Solana ( CRYPTOCAP:SOL ) surged 5% today amidst Solana ETFs set to to be launch tomorrow. A news that made Solana reclaim the $130 zone. With build-up momentum and RSI barely overbought at 53 CRYPTOCAP:SOL is set to break the 38.2% Fibonacci retracement point a level that aligns with $150- 160.
A break above this pivot point could send solana on a bullish course with eyes set on the $200- 270 price points.
Similarly, in the case of a reprieve, CRYPTOCAP:SOL might find support in the 78.6% Fibonacci retracement point before picking momentum up.
Solana Price Live Data
The live Solana price today is $130.00 USD with a 24-hour trading volume of $2,966,846,344 USD. Solana is up 5.12% in the last 24 hours, with a live market cap of $66,305,695,632 USD. It has a circulating supply of 510,033,072 SOL coins and the max. supply is not available.

An overall look at SOL with my April flash crash thesis embeddedSOL is forming a massive cup-and-handle pattern overall. However, when zooming into the short-term pattern currently unfolding, I believe we will see a false breakout leg on the fifth wave, leading to a 'flash crash' in mid to late April. After this occurs, the true breakout will likely happen on the seventh wave, taking out the pattern high and running to the top of the broadening wedge pattern—or perhaps even higher—given the bigger picture of a massive cup-and-handle formation that has been developing for over three years.
Good luck, and always use a stop-loss!

SOLANA - PATH to 145 to again 125!Its SOL, I already mentioned its gonna boom to 240 but before that it needs to settle somehow to the point of 146, so i pref wanna say its long till 145 and again short from the tops to the bottoms, 126 is inevitable

SOLANA; Heikin Ashi Trade IdeaBINANCE:SOLUSD
In this video, I’ll be sharing my analysis of SOLUSD, using my unique Heikin Ashi strategy. I’ll walk you through the reasoning behind my trade setup and highlight key areas where I’m anticipating potential opportunities.
I’m always happy to receive any feedback.
Like, share and comment! ❤️
Thank you for watching my videos! 🙏

SOL/USD "Solana vs U.S Dollar" Crypto Market Heist Plan🌟Hi! Hola! Ola! Bonjour! Hallo!🌟
Dear Money Makers & Robbers, 🤑 💰🐱👤🐱🏍
Based on 🔥Thief Trading style technical and fundamental analysis🔥, here is our master plan to heist the SOL/USD "Solana vs U.S Dollar" Crypto Market. Please adhere to the strategy I've outlined in the chart, which emphasizes short entry. Our aim is the high-risk Green Zone. Risky level, oversold market, consolidation, trend reversal, trap at the level where traders and bullish robbers are stronger. 🏆💸Book Profits Be wealthy and safe trade.💪🏆🎉
Entry 📈 : "The heist is on! Wait for the breakout (160.00) then make your move - Bearish profits await!"
however I advise placing Sell Stop Orders below the breakout MA or Place Sell limit orders within a 15 or 30 minute timeframe. Entry from the most recent or closest low or high level should be in retest.
Stop Loss 🛑:
Thief SL placed at the recent / nearest low level Using the 1D timeframe (200.00) swing trade basis.
SL is based on your risk of the trade, lot size and how many multiple orders you have to take.
Target 🎯:
1st Target - 125.00 (or) Escape Before the Target
Final Target - 90.00 (or) Escape Before the Target
🧲Scalpers, take note 👀 : only scalp on the Short side. If you have a lot of money, you can go straight away; if not, you can join swing traders and carry out the robbery plan. Use trailing SL to safeguard your money 💰.
📰🗞️Fundamental, Macro, COT, Sentimental Outlook:
SOL/USD "Solana vs U.S Dollar" Crypto Market is currently experiencing a bearish trend,., driven by several key factors.
⚡⭐Fundamental Analysis
Blockchain Trends: Solana's blockchain growth is expected to slow down, driven by increasing competition from other blockchain platforms.
Smart Contract Activity: Smart contract activity on Solana's blockchain is expected to decrease, driven by growing competition from other blockchain platforms.
Mining Difficulty: Solana's mining difficulty is expected to decrease, driven by decreasing network hash rate.
Transaction Volume: Solana's transaction volume is expected to decrease, driven by decreasing demand for cryptocurrency transactions.
⚡⭐COT Data
Non-Commercial Traders (Institutional):
Net Short Positions: 55%
Open Interest: 100,000 contracts
Commercial Traders (Companies):
Net Long Positions: 30%
Open Interest: 50,000 contracts
Non-Reportable Traders (Small Traders):
Net Short Positions: 15%
Open Interest: 20,000 contracts
COT Ratio: 0.6 (indicating a bearish trend)
⚡⭐Sentimental Outlook
Institutional Sentiment: 40% bullish, 60% bearish.
Retail Sentiment: 35% bullish, 65% bearish.
Market Mood: The overall market mood is bearish, with a sentiment score of -50.
⚡⭐On-Chain Analysis
Network Hash Rate: Solana's network hash rate has decreased by 10% over the past month, indicating a decline in mining activity.
Transaction Volume: Solana's transaction volume has decreased by 20% over the past month, indicating a decline in network activity.
Active Addresses: Solana's active addresses have decreased by 15% over the past month, indicating a decline in network adoption.
⚡⭐Market Data Analysis
Order Book Analysis: The SOL/USD order book is showing a significant imbalance, with more sell orders than buy orders, indicating a bearish market sentiment.
Liquidity Analysis: Solana's liquidity has decreased by 10% over the past month, indicating a decline in market participation.
Volatility Analysis: Solana's volatility has increased by 20% over the past month, indicating a more unpredictable market.
⚡⭐Positioning
Long Positions: 30% of total positions
Short Positions: 70% of total positions
Neutral Positions: 0% of total positions
Leverage: 2:1 (average)
⚡⭐Next Move Prediction
Bearish Move: Potential downside to 140.00-125.00.
Target: 125.00 (primary target), 90.00 (secondary target)
Next Swing Target: 80.00 (potential swing low)
Stop Loss: 190.00 (above the 30-day high)
Risk-Reward Ratio: 1:2 (potential profit of 30.00 vs potential loss of 15.00)
⚡⭐Overall Outlook
The overall outlook for SOL/USD is bearish, driven by a combination of fundamental, technical, and sentimental factors. The expected slowdown in Solana's blockchain growth, decreasing smart contract activity, and bearish market sentiment are all supporting the bearish trend. However, investors should remain cautious of potential upside risks, including changes in global economic trends and unexpected regulatory developments.
⚠️Trading Alert : News Releases and Position Management 📰 🗞️ 🚫🚏
As a reminder, news releases can have a significant impact on market prices and volatility. To minimize potential losses and protect your running positions,
we recommend the following:
Avoid taking new trades during news releases
Use trailing stop-loss orders to protect your running positions and lock in profits
📌Please note that this is a general analysis and not personalized investment advice. It's essential to consider your own risk tolerance and market analysis before making any investment decisions.
📌Keep in mind that these factors can change rapidly, and it's essential to stay up-to-date with market developments and adjust your analysis accordingly.
💖Supporting our robbery plan will enable us to effortlessly make and steal money 💰💵 Tell your friends, Colleagues and family to follow, like, and share. Boost the strength of our robbery team. Every day in this market make money with ease by using the Thief Trading Style.🏆💪🤝❤️🎉🚀
I'll see you soon with another heist plan, so stay tuned 🤑🐱👤🤗🤩

Solana SOL Will Bounce, But Then Scam!Hello, Skyrexians!
Couple of weeks ago we told you that BINANCE:SOLUSDT will reach $110 in the wave 5 inside the major wave A. You can find this analysis here . Exactly from this zone we have seen the bounce. This bounce is a major correction and those who listen this analysis could already be in the great profit. But anticipated bounce is not the bull run continuation and finally Solana will drop hard because its era is finished.
Let's take a look at the weekly time frame. Here we can see that 5 Elliott waves with the Awesome Oscillator's divergence. After that the major correction has been started. Wave A has been finished at $110 with the green dot at the Bullish/Bearish Reversal Bar Indicator and now we will see wave B, which will reach the Fibonacci 0.5 approximately at $200. From there we will see the scam drop in wave C. It will likely break the major Fibonacci 0.61 support. In this case game is over and Solana can fall for a years or even scam.
Best regards,
Skyrexio Team
___________________________________________________________
Please, boost this article and subscribe our page if you like analysis!

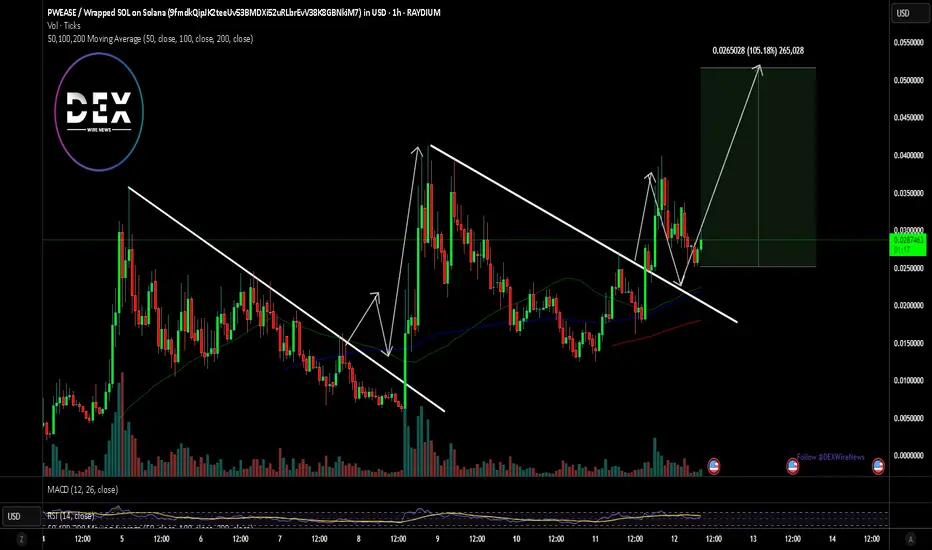
$PWEASE Coin surged 29% Today Amidst Falling Wedge Pattern$PWEASE coin built on the solana blockchain, created on the Pump.fun platform graduated from a bonding curve and is making waves surging 29% for the past 24 hours with eyes set on a 100% surge amidst 2 consecutive falling wedge patterns identified on the chart.
With the RSI at 54.43 this gives more room for $PWEASE to capitalize on the wedge and pick momentum up. If this move should materialize, $PWEASE is set to break the recent All time high of $0.03884.
Pwease Price Live Data
The live Pwease price today is $0.028897 USD with a 24-hour trading volume of $31,547,475 USD. Pwease is up 29.32% in the last 24 hours, with a live market cap of $28,895,321 USD. It has a circulating supply of 999,926,221 PWEASE coins and a max. supply of 1,000,000,000 PWEASE coins.
Chartsssss"What impact do you think Bitcoin has on other coins? Why should Solana’s chart resemble Bitcoin's? Is our trend downward, heading for lower supports? God knows? My heart hurts, I see Bitcoin like this."

Breaking: Solana Tanking HardSolana often referred to as the Ethereum killer is tanking hard albeit Bitcoin also dipped to the $79k zone. Designed to facilitate decentralized app (DApp) creation, aiming to improve scalability by introducing a proof-of-history (PoH) consensus combined with the underlying proof-of-stake (PoS) consensus of a blockchain, SOL has been building a scalable network with massive growth noticeable in its ecosystem.
With Selling pressure increasing, Solana could be on the brink of a massive selling spree with support pegged to the $110-100 pivot points.
However, should Solana bounced back and break pass the 78.6% Fibonacci retracement point, a trend reversal is inevitable. With the RSI at 35, a little shift to a 45 point in RSI could be all what Solana needs to catalysed a bullish breakout.
Solana Price Live Data
The live Solana price today is $124.43 USD with a 24-hour trading volume of $4,578,943,167 USD. Solana is down 6.54% in the last 24 hours, with a live market cap of $63,337,175,317 USD. It has a circulating supply of 509,018,387 SOL coins and the max. supply is not available.

The Era Of Solana SOL Has Been Finished Hello, Skyrexians!
BINANCE:SOLUSDT is the best altcoin of 2023-2024 years because it made 30x from the bottom even on the fake bull run in crypto. This bull run was fake because the true bull run is possible only on DXY dump, but this time Bitcoin and Solana has been growing parallel with the Dollar Currency Index. These assets absorbed all liquidity of the crypto market and on the true bull run it will give it back.
The technical picture is very ugly. Recently we pointed out that Solana has completed the 5 waves cycle and now it's printing ABC correction. Wave A now is in progress and it consists of 5 waves as well. Looking at AO and Fibonacci we can conclude that now asset is finishing the wave 5 which has a target at $110. There we need to see green dot on the Bullish/Bearish Reversal Bar Indicator From there we expect bounce to $200 in the wave B and after that the bear market continuation to targets somewhere below $100.
Best regards,
Skyrexio Team
___________________________________________________________
Please, boost this article and subscribe our page if you like analysis!

SOLANA: watch out for $160 & $174 zonesSOLANA: watch out for $160 & $174 zones.
The first-ever White House crypto summit hosted by President Donald J. Trump will likely act as a catalyst to pump crypto/Solana in the interim.
$160 may be achieved before or on that day. Also, there is the possibility of this asset hitting $174 to $180.
Trade with care as the whole markets are volatile.

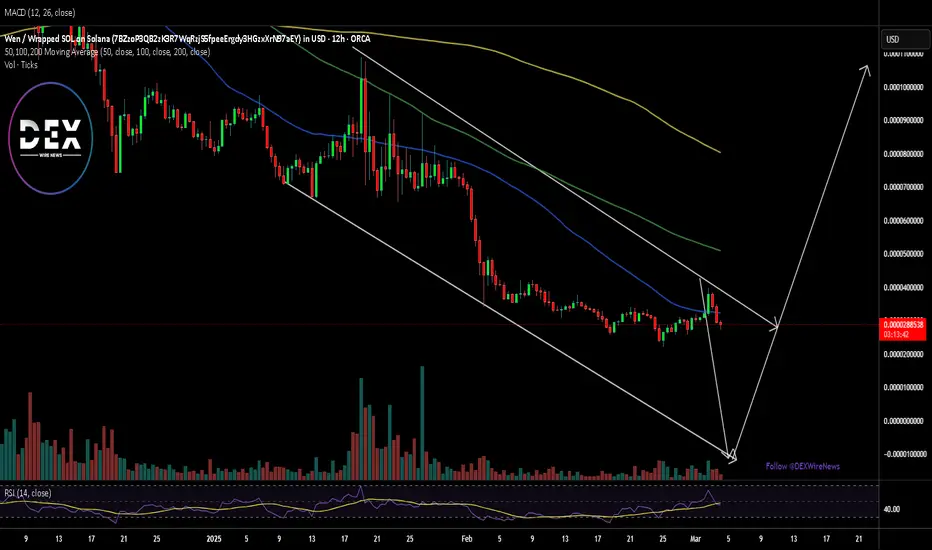
WEN Set For a Breakout Amidst Falling Wedge PatternBuilt on the Solana Ecosystem NASDAQ:WEN seems to be enroute of a bullish reversal amidst a falling wedge pattern. The falling wedge was largely attributed by the overall cool off of the crypto currency landscape with CRYPTOCAP:BTC seeing a major dip from $95k down to $85k.
For NASDAQ:WEN , the asset might further dip to the base of the wedge formed as seen in the chart depicted above before picking liquidity up and surging towards greater highs.
What is WEN
Wen is culture. Wen is a movement. Wen is the internet’s cutest cat and the heart of a growing global phenomenon. More than a brand, Wen is on a mission to become one of the world’s most iconic and beloved IPs.
Wen started as a free airdrop to 1M+ recipients to give back. There were zero influencers, whales, or insiders involved and each recipient received the exact same amount - this made Wen the fairest and widest distributed airdrop ever on Solana. Emphasizing Wen is a coin for the people.
SOL/USDT – Double Zigzag Completed! Is a Bullish Reversal Next?Solana (SOL) has likely completed a Double Zigzag (WXY) correction, with Wave C of Y bottoming at $130.60 (1.0 Fibonacci extension). This suggests a potential trend reversal, but SOL must first break key resistance at $146-$150 to confirm a bullish move.
🔹 Elliott Wave Analysis & Bullish Scenario
If the Double Zigzag correction is complete, SOL could begin a new impulse wave, targeting:
✅ $169-$173 (0.5 Fibonacci retracement, previous Wave B resistance)
✅ $180-$195 (0.382 Fib & major supply zone)
✅ $220+ (Wave 3 extension target)
🔻 Bearish Scenario – Extended Correction?
If SOL fails to break $150, it could indicate that the correction is not yet over, leading to:
❌ Retesting $130 support
❌ Possible extended correction towards $113-$100 (1.272 Fib extension)
📌 Key Level to Watch:
🔹 A break & close above $150 signals bullish continuation.
🔹 A rejection could mean further downside.
📊 Is SOL ready for a breakout, or will we see another leg down? Share your thoughts below! 👇🔥

SOLANA is struggling with 2021 ATHSOLANA is struggling with 2021 ATH.
In 2021, we saw TRADENATION:SOLANA hit $160 zone. If you zoom in on your chart like mine, you will realise why this baby is fighting tooth and nail to break that barrier.
It has pushed above that $260 zone X3 but has been closing below.
Should we expect this asset to fall back to the $222 zone?
My thoughts are on my chart.
Trade with care

Solana (SOL) Holding Strong – Can It Reclaim $200?Solana (SOL/USDT) is currently testing a critical support zone around $140, aligning with a long-term ascending trendline that has provided strong support in previous market cycles. The 50-week EMA ($168.03) is also acting as dynamic resistance, making this an important decision point for the market.
The recent pullback from resistance at the previous ATH zone suggests some profit-taking, but if SOL can hold this key support level, a bullish reversal could follow, pushing prices back toward $200+ in the coming weeks.
However, a break below $140 could lead to a deeper retracement toward the trendline support around $100-$120.

Solana (SOLUSDT) is Not Dead! A Major Move is Coming! Solana (SOL) is holding strong at its major support level of $110, making this an ideal accumulation zone between $110 and $140. With CME Group launching SOL Futures on March 18th, institutional interest could surge, potentially triggering a massive rally. As Solana gears up for a recovery to previous highs, this could be a prime opportunity to buy and hold for the long term. Don’t miss out—accumulate
BINANCE:SOLUSDT Currently trading at $144
Buy level: $110 - $140.
Stop loss: Below $90
Target : $500
Max Leverage : 1x /Spot trade
Always keep Stop loss
Follow Our Tradingview Account for More Technical Analysis Updates, | Like, Share and Comment Your thoughts

SOL | Solana Drops 54% | WHERE TO NEXT?The recent ByBit hack seems to have sent the market into a downward spiral. But, if you look at it from a few weeks back, prices were already beginning to drop even before the news of the hack.
Solana follows Ethereum pretty closely, and considering the hard sell-off on ETH, SOL followed suit with a -26% drop over the past week.
This is quite a substantial correction, and considering the past 6 candles were red - it's likely that we can expect a bounce from next week, or at least a green candle. If we fail to bounce here, the short term is looking bleak for SOL:
____________________
KUCOIN:SOLUSDT

SOLUSDT 6DSOL ~ 6D Analysis
#SOL Buy gradually from here with a short -term target of at least 15%+ from here.

SOL/USDT – Double Zigzag Completed! Is a Bullish Reversal Next?Solana (SOL) has likely completed a Double Zigzag (WXY) correction, with Wave C of Y bottoming at $130.60 (1.0 Fibonacci extension). This suggests a potential trend reversal, but SOL must first break key resistance at $146-$150 to confirm a bullish move.
🔹 Elliott Wave Analysis & Bullish Scenario
If the Double Zigzag correction is complete, SOL could begin a new impulse wave, targeting:
✅ $169-$173 (0.5 Fibonacci retracement, previous Wave B resistance)
✅ $180-$195 (0.382 Fib & major supply zone)
✅ $220+ (Wave 3 extension target)
🔻 Bearish Scenario – Extended Correction?
If SOL fails to break $150, it could indicate that the correction is not yet over, leading to:
❌ Retesting $130 support
❌ Possible extended correction towards $113-$100 (1.272 Fib extension)
📌 Key Level to Watch:
🔹 A break & close above $150 signals bullish continuation.
🔹 A rejection could mean further downside.
📊 Is SOL ready for a breakout, or will we see another leg down? Share your thoughts below! 👇🔥

SOLANA – Technical and Fundamental OutlookTechnical Analysis
Solana (SOL) remains within a Falling Wedge structure, a historically bullish reversal pattern. The price is currently testing a key support zone at $124.29, where demand accumulation could trigger a breakout. A successful rebound from this level may confirm a shift in momentum.
A breakout above $150.51 would validate a bullish reversal, with the next key resistance target aligning with the previous All-Time High (ATH) of $296.99. Failure to hold $124.29 as support could extend the correction, requiring confirmation of price action before further positioning.
Fundamental Analysis
Solana continues to exhibit strong growth, with a 37.09% price increase in the last 30 days and 79.96% gains over the past 90 days, reflecting sustained investor confidence. Institutional sentiment remains positive, with VanEck analysts projecting a $520 price target by the end of 2025, contingent on continued adoption and ecosystem expansion.
Key fundamental drivers include Solana’s high-throughput architecture, enabling thousands of transactions per second with low fees, positioning it as a competitive layer-1 blockchain. Recent integrations, including Visa's USDC settlement adoption, further reinforce its real-world utility.
Risk Considerations
Regulatory uncertainties remain a critical factor, with SEC classification concerns presenting potential headwinds. Additionally, speculative market activity, particularly within Solana's meme coin sector, has contributed to heightened volatility, necessitating cautious risk management.
Conclusion
The confluence of technical support levels and strong fundamental adoption metrics suggests a pivotal moment for Solana. A breakout from the Falling Wedge structure would reinforce bullish momentum, while macro and regulatory developments remain key monitoring factors.
