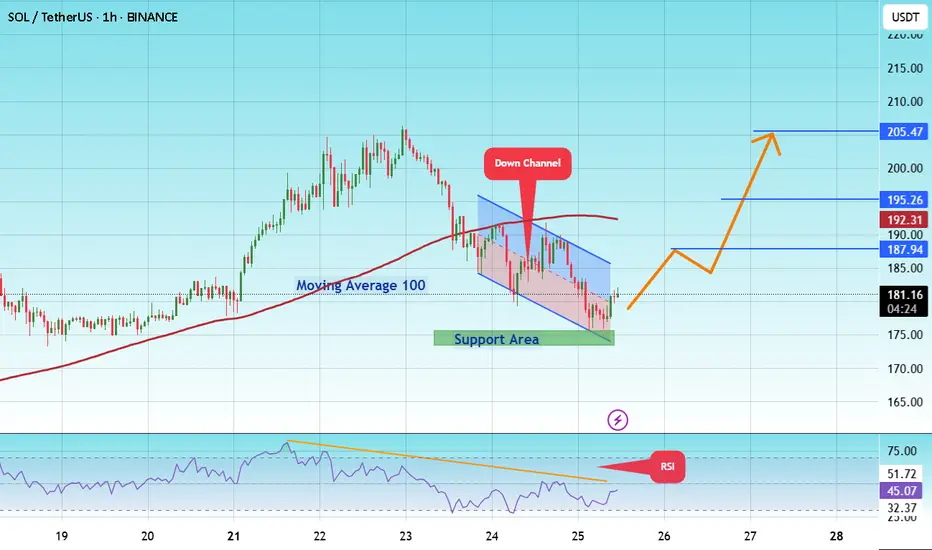
#SOL/USDT coin market structure analysis#SOL
The price is moving within a descending channel on the 1-hour frame and is expected to break and continue upward.
We have a trend to stabilize above the 100 moving average again.
We have a downtrend on the RSI indicator that supports the upward move with a breakout.
We have a support area at the lower boundary of the channel at 175, acting as strong support from which the price can rebound.
We have a major support area in green that pushed the price upward at 174.
Entry price: 181.
First target: 187.
Second target: 195.
Third target: 205.
To manage risk, don't forget stop loss and capital management.
When you reach the first target, save some profits and then change the stop order to an entry order.
For inquiries, please comment.
Thank you.
Solbtc
Ethereum vs SolanaIn 2025, the competition between Ethereum and Solana is no longer just a rivalry — it’s a pivotal chapter in blockchain evolution.
We are witnessing a clash of two philosophies:
Ethereum — maturity, security, and deep ecosystem
vs.
Solana — speed, efficiency, and adaptability.
📈 Price Resilience vs. Market Legacy
While Ethereum still holds the crown in market cap and institutional trust, Solana is rewriting the rules with superior transaction speed and cost-effectiveness.
The question is no longer "Who is better?"
It’s "Who is evolving faster?"
⚡ Key Drivers Shaping the Ethereum-Solana Rivalry
1️⃣ Scalability vs. Stability
Solana leads with up to 65,000 TPS, attracting high-frequency traders, NFT creators, and DeFi innovators.
Ethereum, relying on its Layer-2 solutions, tries to balance security with scalability.
2️⃣ Institutional Shifts
Funds like Galaxy Digital and Ark Invest are reallocating capital towards Solana, betting on efficiency and growth.
Ethereum, meanwhile, is waiting on ETF approvals to regain momentum.
3️⃣ Technological Innovation
Ethereum focuses on sharding and Layer-2 expansion.
Solana pushes aggressive ecosystem growth but pays the price with occasional network instability.
📊 Market Performance Snapshot — 2025
Ethereum: ▼ 56% YTD | ~$1,600
Solana: ▼ 40% YTD | ~$135
Solana’s DEX market share jumped to 39.6% in Q1, driven by meme coins and retail traders.
Ethereum’s dominance continues to erode under macro pressures and rising competition.
But don’t be fooled — Ethereum's foundation remains strong. Institutional adoption and infrastructure upgrades still offer potential for a rebound.
📉 ETH/BTC Looks Like a Meme
ETH/BTC:
SOL/BTC: Potential -50% in next 160 weeks ➡️
ETH/SOL:
⚡ Where Did the Liquidity Go?
The real question isn’t why ETH is dropping —
It’s why no one cares.
Layer 2 solutions — Arbitrum, Optimism, Base — have drained liquidity from Ethereum’s mainnet.
DeFi activity? → Migrated to L2
Users? → Choosing lower fees and speed
Ethereum L1? → A blockchain for whales and archives
No liquidity = No rally
No narrative = No attention
Funds are betting on Solana and L2, not Ethereum’s base layer.
🎯 When Could ETH Take Off?
Only if we see:
A strong “Liquidity Returns to L1” narrative (RWA could be a trigger)
Spot ETH ETFs launching with institutional accumulation
A new DeFi wave on L1 (unlikely with current gas fees)
Or simply — when the market decides to pump forgotten assets
For now, Ethereum is about patience.
Smart money is flowing into L2, Solana, and high-risk narratives.
🕒 But Time Will Tell...
Today, we debate ETH vs. SOL.
Tomorrow — the bull market ends, and we’ll be discussing entirely different narratives.
Are you SOL or ETH?
As always, stay one step ahead.
Best regards,
EXCAVO
______________________________
Disclosure: I am part of Trade Nation's Influencer program and receive a monthly fee for using their TradingView charts in my analysis.

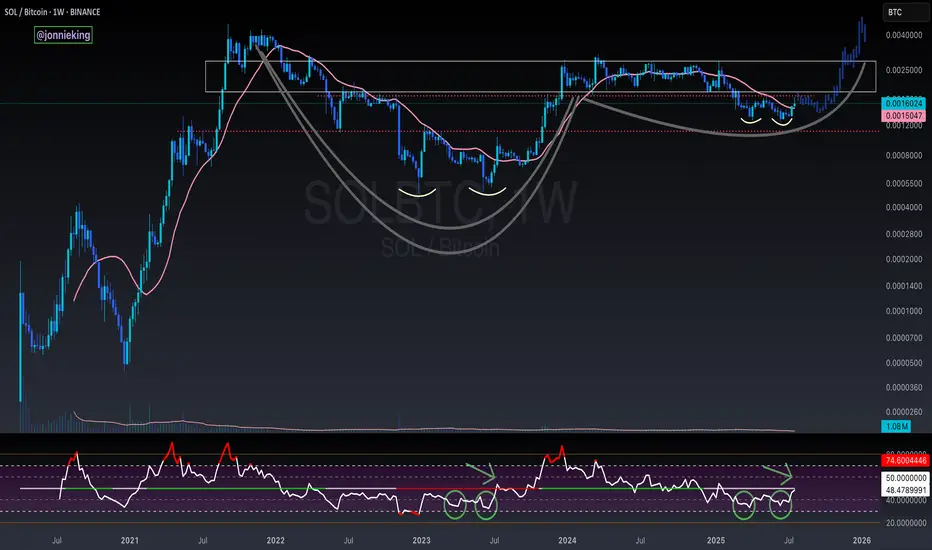
SOL / BTC Cup and Handle Weekly ChartBeautiful cup and handle on the SOL / BTC Weekly chart.
Need to break above the neckline and reclaim the POI.
Double bottom on the RSI matches just before the rip in July 2023.
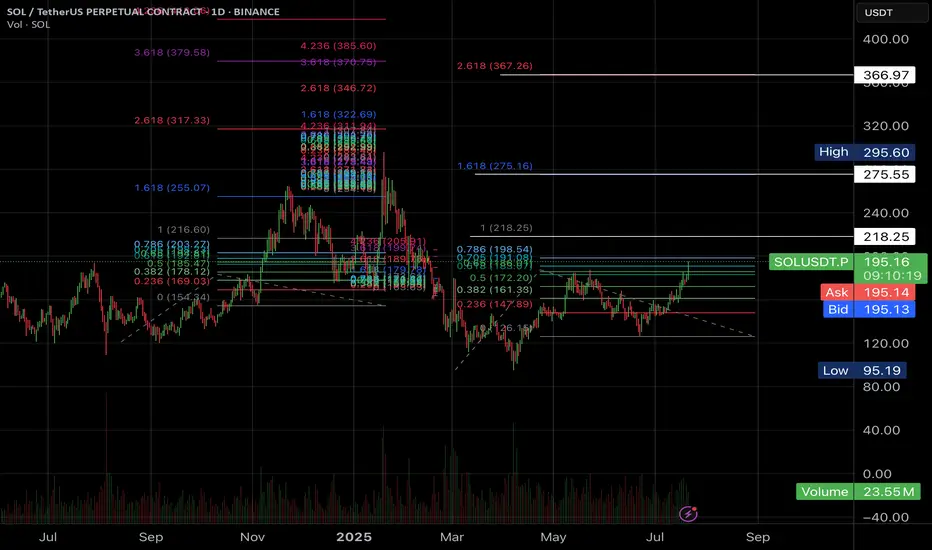
#SOL for 367$?Hi Padawans,
Hope you’re all doing well.
The charts don’t lie — but remember, this isn’t financial advice.
I’m currently eyeing long positions up to the levels highlighted in the chart.
Best regards,
CryptoObi
SOL - Excellent Trade Opportunity- Trade is giving us a trade with huge potential with huge risk reward ratio.
- Currently price is heading towards teh support around 160 range and this is strong support zone.
- I'm expecting price to bounce back from this zone and head towards the next target of 200 range
Entry Price: 163
StopLoss: 148
TP1: 172
TP2: 182
TP3: 200
Stay tuned for more updates.
Cheers
GreenCrypto

Solana Update: Miss This Analysis, Miss the Next Leg!Hey, I’m Skeptic! 🩵 Solana’s recently kicked off a strong uptrend momentum , and there are solid triggers waiting to activate that could bring good profits. In this analysis, I dove into Solana on weekly, daily, and 4-hour timeframes, and checked SOLBTC and BTC.D too, to get a grip on the current liquidity flow.
💬What’s your trigger on Solana? Drop it in the comments, and if you want an analysis on a coin, write it for me so I can check it out.

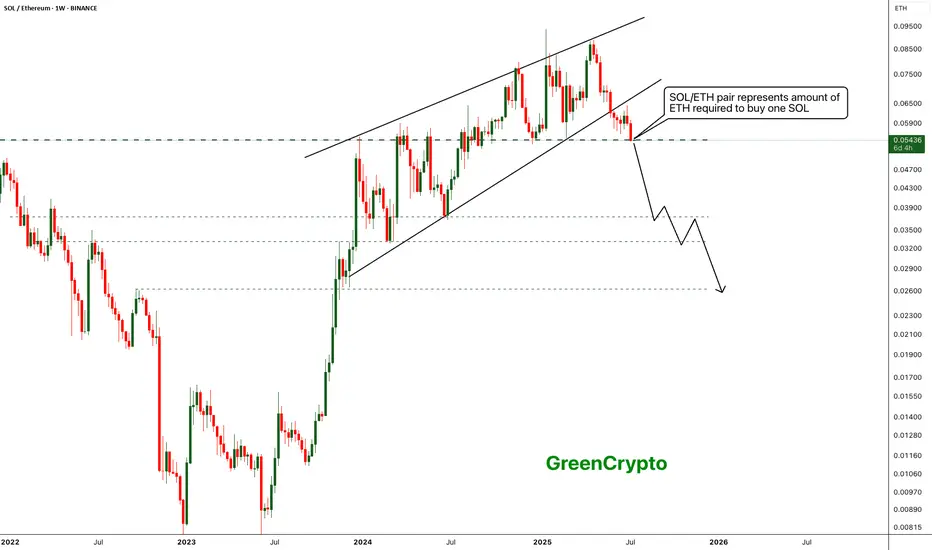
Ethereum is outshining Solona- Ethereum is finally outshining Solona
- ETH/SOL pair has broke down from the raising wedge pattern indicating clear bearish sentiment
- with the current bearish trend, we can expect the SOL/ETH pair to drop further down to 0.02630 range..
- This is clear sign the holder are preferring ETH or SOL
Stay tuned for more updates
Cheers
GreenCrypto
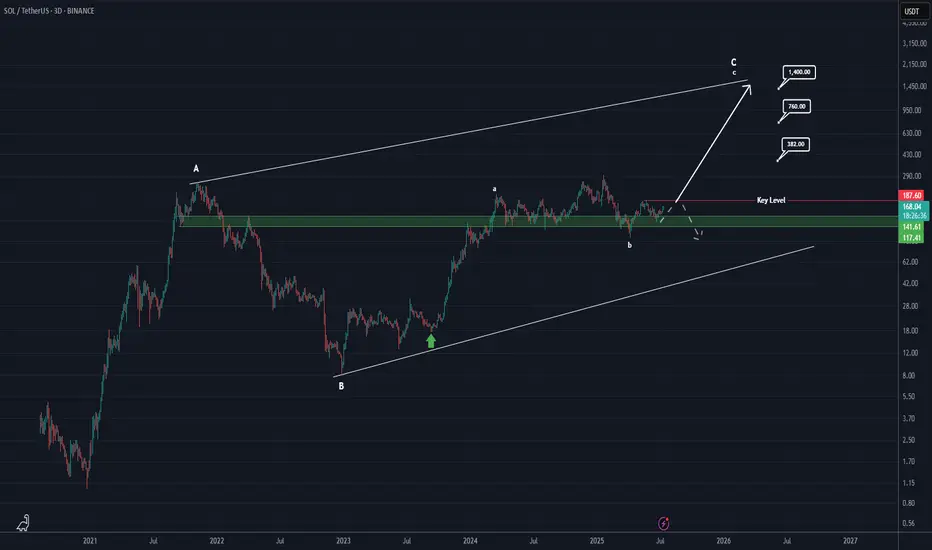
Will Solana reach $1400?After analyzing Solana’s complete data, it appears that a large diametric pattern is forming in the long term.
Currently, it seems we are in wave c of C.
If the key level of $187 is broken and price consolidates above it, we can be much more confident that we are indeed in wave c of C, confirming this scenario.
However, if the price fails to break and hold above $186 on higher timeframes like the 3D or weekly, and gets rejected downward, this scenario will be invalidated.
If confirmed, the targets for wave c of C are marked on the chart.
For risk management, please don't forget stop loss and capital management
When we reach the first target, save some profit and then change the stop to entry
Comment if you have any questions
Thank You
$SOLBTC: Little strength to show for. In the crypto space we time and again regularly focus on the CRYPTOCAP:BTC and the CRYPTOCAP:BTC.D chart and we have time and again predicted that CRYPTOCAP:BTC.D will touch at least 66% in this Crypto cycle. This CRYPTOCAP:BTC Dominance can be interpreted not only as the CRYPTOCAP:BTC superiority but the weakness of Altcoins. Most of it comes from the big caps like CRYPTOCAP:ETH and $SOL.
On June 23 we wrote about the BINANCE:ETHBTC failed breakout, and we put forward the case why the chart looks bearish.
BINANCE:ETHBTC failed multiyear breakout. for BINANCE:ETHBTC by RabishankarBiswal
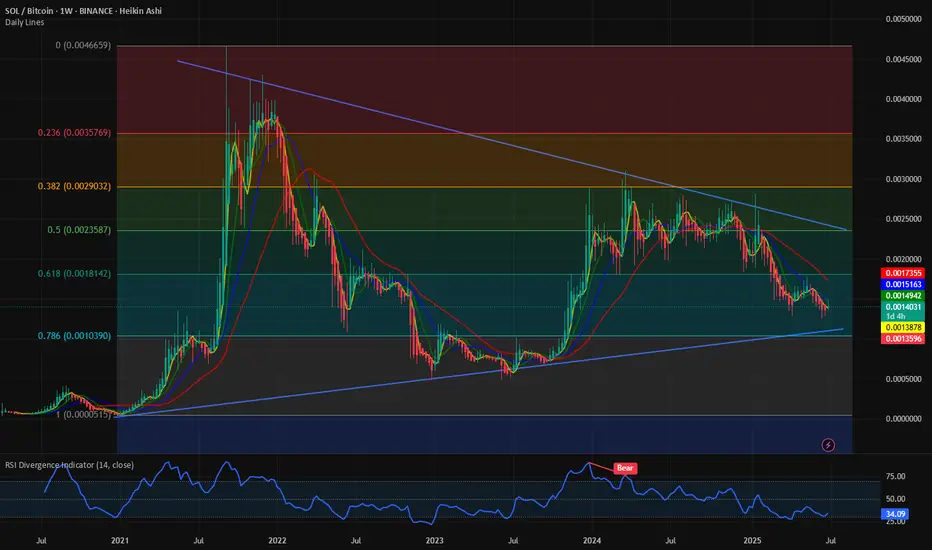
The second largest Altcoin CRYPTOCAP:SOL is also not showing any strengths either. The BINANCE:SOLBTC chart is still range bound within the 0.618 and 0.786 Fib retracement levels. It has failed to break out of this channel, and it is boxed within the downward sloping wedge which also is not bullish for the crypto pair. The best case is BINANCE:SOLBTC sweeps the 0.5 Fib levels at the highs and 0.786 at the lows. That means BINANCE:SOLBTC valuation will be 0.0025 at its upper range and 0.001125 at its lower bound.
Verdict: BINANCE:SOLBTC range bound between 0.0025 to 0.00125 with downward bias.
Not clear path to SOLBTC but sqeeze higher more probableIt needs to break above 18000 for this to fulfill. Current QE scenario will help

Skeptic | Solana’s Uptrend Ignites: Big Moves Ahead?Hey everyone, Skeptic here! Let’s kick off this Friday morning with a deep dive into Solana , one of my favorite coins! 😊 In this analysis, I’m breaking down the charts, spotting spot and futures triggers, and exploring what’s next for SOL. Stick with me to the end, and we’ll grow together! <3 Let’s start with the Daily Timeframe. 📊
Daily Timeframe: The Big Picture
We’re riding a solid upward channel on Solana’s daily chart. The price has reacted beautifully to the ceiling, floor, and especially the midline, which gives this channel a ton of credibility—we can trust it. After a strong price surge starting October 20 and running through January 25 , we entered a price correction. I expected a pullback to 80.78 , but we corrected to 95.15 instead. Now, we’ve formed a head and shoulders pattern, and the neckline has broken, activating the pattern. This pattern, at the end of a correction, signals a trend reversal and a continuation of the major uptrend. The target for this pattern is the height from the head to the neckline, which takes us to 202.82 —coincidentally, a key resistance level ahead. I expect we might range around that level or, if we break it, it’ll likely be a sharp and messy move. So, plan ahead to avoid FOMO or making rash moves. Our spot entry was at 151.78 , but a break above 202.82 could be another solid trigger, with a stop loss below the support at 147.97 . Don’t FOMO —wait for confirmations from SOL/BTC and Bitcoin’s action. Volume is your friend for spotting momentum, so keep a close eye on it. Let’s zoom into the 4-Hour Timeframe for long and short triggers.
4-Hour Timeframe: Long & Short Setups
After breaking the 153.29 resistance, we saw a nice rally, but then we hit some turbulence. If you look closely, the market seems to have formed a symmetrical triangle—the worst pattern for breakout and momentum-based strategies. Why? The market doesn’t care about support or resistance here, making it tough to tell if moves are fake or real. So, what’s the plan?
Let’s drop to the 1-Hour Timeframe.
The last level we got rejected from was 174.51 . If we revisit this level with rising volume and candles showing buyer strength—think good lower shadows and strong green bodies with high closes—it means sellers pushed the price down, but buyers stepped in and drove it back up. If you see this setup and we break the 174.51 resistance, you can open a long position. For shorts, since the major and secondary trends are uptrends, I’m not giving any short triggers—it’s completely against the trend, and the risk of hitting a stop loss is way too high. Be patient. Wait for this uptrend to fake out and drop below 149.07 —then we’ll hunt for shorts. 🙂 Let’s also take a quick look at SOL/BTC.
SOL/BTC Analysis
On the daily timeframe, we’ve got a clean head and shoulders pattern for SOL/BTC, with the neckline broken and a pullback to it now. This could lead to a strong rally moving forward, provided it’s not a fakeout and we don’t fall back below the support at 0.0015043. What does this mean? If the market stays in an uptrend, Solana could outperform Bitcoin. And if BTC.D is dropping during a market rally, Solana could see some serious growth. That’s the Solana breakdown! If you’ve got your own technical or fundamental analysis on this coin, I’d love to hear it—drop it in the comments so we can grow together! 😄
💬 Let’s Talk!
If this analysis helped you out, give it a quick boost —it means a lot! 😊 Got a pair or setup you want me to tackle next? Drop it in the comments, and I’ll get to it. Thanks for hanging out, and I’ll see you in the next one. Keep trading smart! ✌️

#SOL/USDT#SOL
The price is moving within a descending channel on the 1-hour frame, adhering well to it, and is on its way to breaking it strongly upwards and retesting it.
We are seeing a bounce from the lower boundary of the descending channel, this support is at 144.
We have a downtrend on the RSI indicator that is about to break and retest, which supports the upward trend.
We are looking for stability above the 100 moving average.
Entry price: 149
First target: 153
Second target: 156
Third target: 161

Solana Vs Bitcoin: New All-Time High In Late 2025Solana vs Bitcoin has not been bullish since March 2024 and is about to go bullish now after more than a year of no growth. It went sideways first and then it produced a crash but finally, the market found support.
What we have here is simply awesome because there is no better trade than to trade against Bitcoin when Bitcoin is going up. SOLBTC growing while Bitcoin also grows.
Support was already tested and confirmed. It is over. We are now green.
SOLBTC moved below 0.618 Fib. retracement but bounced before reaching 0.786. Support was found right at the middle. The action recovered back above 0.618 and this is super bullish. This is literally as bullish as it gets and prices are extremely good right now. Bottom prices. The lowest possible before the next bullish wave.
I mentioned with XRPBTC (visit my profile) that the project is developing nicely and a new All-Time High is very likely, high probability. The same is true for SOLBTC. This is another project that is growing very fast and there is strong support from the market and great adoption across the world. Solana is one of the top Altcoins, this we all know.
This week is the second green week with a full green candle. The action will be up, up, up, like late 2023 and early 2024. Something similar but the final swing will be much stronger, the bull market bull run.
It is likely that the end price, the new All-Time High, will go beyond what is shown on the chart.
Namaste.

SOL/USDT – Key Support Test: Will It Hold or Break?#SOL/USDT #Analysis
Description
---------------------------------------------------------------
Solana (SOL) has been in a strong uptrend since late 2023, but recent price action suggests a key test of support around the $115–$135 zone. This level was previously a major resistance and is now being retested as support.
Moving Averages: The price has dipped below the shorter EMAs but is still above the long-term moving average.
Bearish Momentum: The recent sharp drop suggests selling pressure, but the support zone could lead to a reversal.
Two Scenarios:
🔼 Bullish: If the support holds, SOL could bounce back towards $180+ and continue its uptrend.
🔽 Bearish: If support breaks, a deeper correction to $43–$60 is possible.
📊 Trading Strategy
Long Entry: If a strong bounce occurs from the $115–$135 zone, targeting $180+.
Short Entry: A confirmed breakdown below $115 could trigger a move toward $60 or lower.
---------------------------------------------------------------
Enhance, Trade, Grow
---------------------------------------------------------------
Feel free to share your thoughts and insights. Don't forget to like and follow us for more trading ideas and discussions.
Best Regards,
VectorAlgo

SOL buy/long setup (4H)In the hourly timeframes, bullish signals are visible on the Solana chart.
The trigger line has been broken. Bullish (ICH) is present on the chart. Higher lows (L) are forming.
We are looking for buy/long positions in the demand zone.
A 4-hour candle close below the invalidation level will invalidate this analysis
Do not enter the position without capital management and stop setting
Comment if you have any questions
thank you

SOL Looks Bearish (1D)A major trendline has been lost despite positive news, and SOL is prone to further drops towards the green box.
A large liquidity pool exists below the price, which is likely to be taken out, pushing the price toward the marked zone.
The price structure has turned bearish with a CH on the chart.
A daily candle closing above the invalidation level will nullify this analysis.
For risk management, please don't forget stop loss and capital management
Comment if you have any questions
Thank You

#SOL/USDT#SOL
The price is moving in a descending channel on the 1-hour frame and is expected to continue upward.
We have a trend to stabilize above the 100 moving average once again.
We have a downtrend on the RSI indicator that supports the upward move with a breakout.
We have a support area at the lower boundary of the channel at 121.60.
Entry price: 126
First target: 129
Second target: 132
Third target: 135

Is SOL/BTC following the ETH/BTC distribution pattern?
As the big red weekly candle closes for BTC, we should see some volatility this week.
Solana valued in BTC has exited a rectangular distribution topping pattern.
Failure to recapture the rectangular box and enter back into it in a spring like move is looking increasingly unlikely.
Ethereum valued in BTC followed a very similar pattern in Nov 2023, exiting the rectangular distribution rectangle and fell much much lower.
The 50 week (blue line) and 200 week (purple line) moving averages also follow a similar trajectory for both instruments / coins.
If SOL / BTC does not recover into the box, and fast I will be exiting a long term position I hold.
Defensive Strategy based on this chart and the USD chart warrants consideration
PUKA

Solana 600% 6x Against bitcoin Chart is speaking for itself
Fakeout is taking place
Solana is very undervalued
Check my old ideas in my profile expecting 100% correctly since solana at 8$

$SOLBTC is clearly in a bearish patternCRYPTOCAP:SOL valuation in USD is already 30% below its ATH. But if we value the CRYPTOCAP:SOL based on CRYPTOCAP:BTC then we clearly see that the chart is clearly in a bearish pattern. $SOLBTX has already reached 0.0018. If we plot the Fib retracement levels from the last peak to low in the weekly chart the BINANCE:SOLBTC can go down to 0.001 which is the 0.786 level.
The upcoming macro-economic numbers like inflation and unemployment will determine the direction of this chart.
BINANCE:SOLBTC near term bearish.

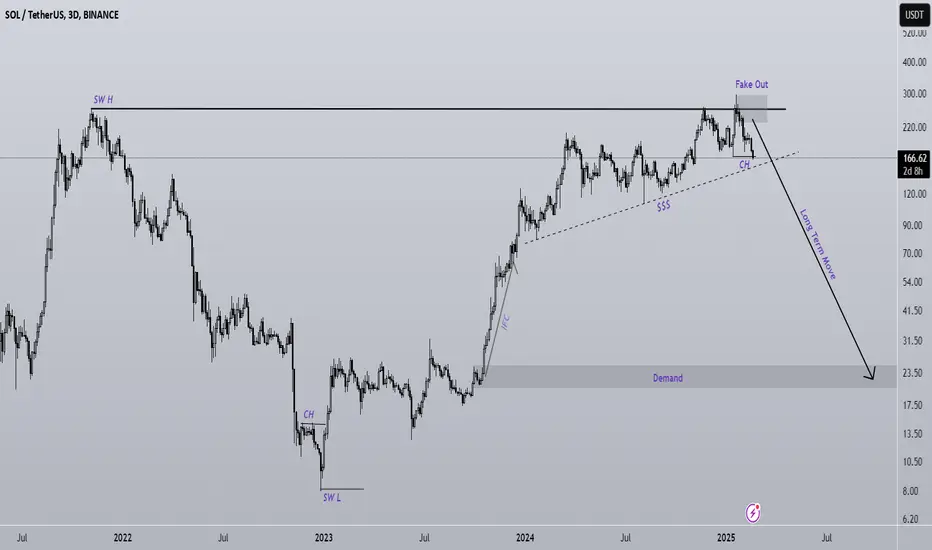
The bearish superwave of SOL has begun (3D)It seems that the The bearish superwave of SOL has begun.
A large liquidity pool has formed below the price, which is likely to break soon.
The all-time high has been broken falsely. This could lead to heavy drops in the weekly timeframe.
In the mid-term and long-term, Solana appears bearish.
Do not enter the position without capital management and stop setting
Comment if you have any questions
thank you
Breaking News - SOL MartyBoots here , I have been trading for 17 years and sharing my thoughts on SOL here.
SOL looks bad overall and this news may make SOL drop more
Do not miss out on SOL as this can affect the entire market
Watch video for more details

SOL ANALYSIS (12H)The internal structure of SOL appears bearish, but it is not too far from the support zone. If SOL reaches the green zone, buy/long positions can be considered.
From another perspective, SOL is forming a large Trading Range.
A daily candle close below the invalidation level will invalidate this analysis.
For risk management, please don't forget stop loss and capital management
Comment if you have any questions
Thank You
