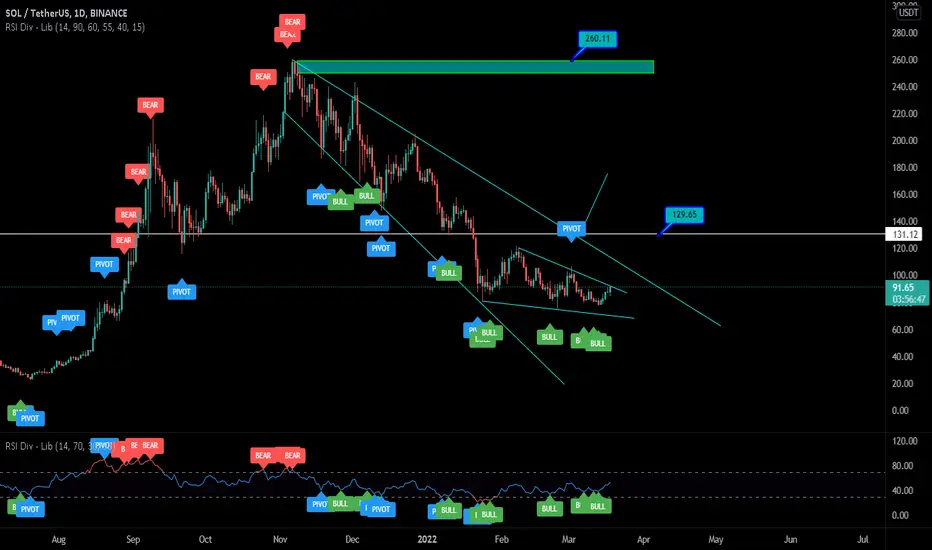
🚩 SOL Bull Flag 📈SOL is currently in this bull flag on the daily and once it breaks out I believe we could really see it go back to the mid 100s.
We have some FIB levels to clear once we break through those being at $119 , and $146.10.
We would also need some momentum on BTC to help drive SOL to break the flag and other key resistance areas as mentioned.
Solbtc

SOLANA LONGS ACTIVE 📉📉📉📉 Expecting bullish price action on the SOLANA as price shifted the market strucutre from bearish into bullish and for now price is finish the retracement move back into the bullish orderblock on the D1, we have a clear confirmation and right now i think we will see higher price action right into 166$ price area where we have a BIG IMBALANCE AREA to be filled.
What do you think ? Comment below..

SOLUSDT has broken below Support $106SOLUSDT has been making LHs and LLs after massive rejection at $138. It has been on a down trend and after breaking below $106 it is expected to go lower. It has also broken below a major trend line which is another indication for us. Above $120 this signals would be invalid. the first Target profit for this trade would be at $96.00
💎 SOLUSDT
🔵 Entry zone 113.78 - 104.32
🟢 TP1 96.00
🟢 TP2 86.00
🟢 TP3 70.00
🔴 SL 120.00
Good Luck 🎲

SOLANA 1D TA : Can run to 139$ again?As we expected in the previous analysis, we reached the resistance range of $ 139 and faced resistance in this area. According to the chart, we are on the trend line, which if supported, we expect the price to return, otherwise the fall will be more severe with the failure of the range.
Its not Buy or Sell SIGNAL
DYOR
BY : Mohamad Teriz - @AtonicShark


SOLANA USDT - hello crypto lovers
ahmed signals team wishes you high profits
----------- SOLANA USDT --------------------
SUPPORT : 110 - 113

$SOL on the 6 hourlooks like we have a similar bar pattern with a cup and handle building
Could see ATH

SOL short bear!Solana is looking bearish after huge pump up, BTC is looking better but still I think correction will come soon.
Strong support is on cca 100-105€ after that 90-94€.

SOL loading up for a bigger move! Here's a quick look at the SOL Daily chart . As we can see, the price has been oscilating withing a bigger falling wedge and a break to upside could be around the corner! The best entry would be when the price breaks above 145$ with good amount of volume . Definitely one to keep an eye on!
-------------------------------------------
The idea is: Buy when the price breaks above 145$ and take profits at the levels shown in the chart.
Targets:
1. 153$
2. 167$
3. 189$
4. 218$
-------------------------------------------
What Is a Wedge in the context of trading?:
"A wedge is a price pattern marked by converging trend lines on a price chart. The two trend lines are drawn to connect the respective highs and lows of a price series over the course of 10 to 50 periods. The lines show that the highs and the lows are either rising or falling and differing rates, giving the appearance of a wedge as the lines approach a convergence. Wedge-shaped trend lines are considered useful indicators of a potential reversal in price action by technical analysts.
Key Takeaways for Falling wedges:
1. Wedge patterns are usually characterized by converging trend lines over 10 to 50 trading periods.
2. The patterns may be considered rising or falling wedges depending on their direction.
3. These patterns have an unusually good track record for forecasting price reversals."
-------------------------------------------
If you like the content, then make sure to comment and like the post :D
Follow me for daily profitable trading setups
BTC dictates the market. If BTC falls, then Alts will fall as well. Trade safe!

sol first target hitsol looking great here, hopefully you got in on my previous chart when i called the bottom and you're enjoying the ride
could flag here before moving to next target or could go down to test support before moving up

Solana - Update ✅As i told you in the previous posts the 80$ price area could act as a strong area of SUPPORT and it acted. The price shifted the market strucutre from bearish into bullish and it's going now for the imbalance fill 170$. I will take a LONG entry on SOLANA COIN if price will make the retracement move to gather more long orders back into 100$ institutional figure + bullish orderblock on H4 and from there we could go higher.
What do you think ? Comment below..

SOL/BTCThe time of the alts has not yet come, and Solana has a lot of problems on the technical side, constantly popping up some error. All in good time.

SOL/USD - Monster PUMP approaching KEY MOMENT! 🚨SOL is quickly approaching $130 resistance. If price fails to break it... you know what follows right?
You can't pump over 60% and not face any pullback. It is coming, best to be prepared.
Like and follow if you liked my idea!

SOL TRADE UPDATESOL has passed some minor resistance levels and now is gaining momentum. The trade is healthy and heading towards target over coming days.

Solona - Showing interesting trends on low time frameHello trading friends,
Solona - Showing interesting trends on low time frame
Have a good time.

Solana (SOL) to $310 in Q3-2023 (continuation)This is an extension post about my previous idea that was well received. I'll post the initial idea down below as a related idea, for easy reading.
The bear pattern seems to be broken , it's following my initial idea of a variation of the bullish falling wedge pattern. Using the Fibonacci Retracement indicator we can clearly see the that the 1.272 level of Fibonacci is our goal, that would be exactly $310.
That said, it would indeed be a good time to buy if you would follow this idea.
The idea is that we'll see another long triangle stretch of a variation of a bullish falling wedge , that is if we break through the current bear pattern (which we just broke through as we speak).
As everyone knows, the war between Ukraine and Russia is bringing a lot of tension on the markets. These are uncertain times, and with uncertainty comes indecisiveness.
We're still in the phase of resistance, the very first step into the journey of acceptance. Google it, it's worth a read and applies to many concepts like crypto.
Believing that the cryptocurrency will grow in the future like it is doing now, people will keep on holding their cryptocurrencies with staking.
Banks and governments will ultimately have to bend and shape into the new era of digital economy, you see this happening everywhere.
Let me know what you think, thanks for reading.
Thumbs up to this post are sincerely appreciated.
~ Murkemur

SOL TRADEWe have entered SOL after the breakout of falling wedge formation and close confirmation. Looking for a 30% profit this week.

Solana (SOL) - March 28Hello?
Traders, welcome.
By "following", you can always get new information quickly.
Please also click "Like".
Have a good day.
-------------------------------------
** The BTC market chart for altcoins will not be published for the time being as the BTC price appears to be turning upward.
(SOLUSDT 1D Chart)
The indicators at 106.17 and 149.91 are inverted and are likely to swing up and down, so trade cautiously.
If the price holds above 106.17, it is expected to turn into an uptrend.
(buy)
- After confirming the support in the vicinity of 106.17
- After confirming the support in the vicinity of 96.11
(Stop Loss)
- When it falls below 96.11
When it falls below -84.57
(Sell)
- When resistance is received in section 1 (127.75-143.57)
- When receiving resistance in section 2 (169.99-191.02)
The keypoint point is point 106.17.
------------------------------------------------------------ -----------------------------------------------------
** All indicators are lagging indicators.
Therefore, it is important to be aware that the indicator will move accordingly as price and volume move.
However, for the sake of convenience, we are talking in reverse for the interpretation of the indicator.
** The MRHAB-O and MRHAB-B indicators used in the chart are indicators of our channel that have not been released yet.
(Since it was not disclosed, you can use this chart without any restrictions by sharing this chart and copying and pasting the indicators.)
** The wRSI_SR indicator is an indicator created by adding settings and options to the existing Stochastic RSI indicator.
Therefore, the interpretation is the same as the traditional Stochastic RSI indicator. (K, D line -> R, S line)
** The OBV indicator was re-created by applying a formula to the DepthHouse Trading indicator, an indicator disclosed by oh92. (Thanks for this.)
** Support or resistance is based on the closing price of the 1D chart.
** All descriptions are for reference only and do not guarantee a profit or loss in investment.
(Short-term Stop Loss can be said to be a point where profit and loss can be preserved or additional entry can be made through split trading. It is a short-term investment perspective.)
---------------------------------

SOLSOL/USDT
In the form of a triangle pattern ...
Pattern ceiling
According to the new positive momentum of Bitcoin
Solana seems to be breaking his resistance upwards...

Solana - 0.786An idea for Solana showing on the USD pair (left) a brief touch on the 0.786 fib level
I think we will see a bullish reversal from this fib level
On the right I have analyzed the BTC pair which shows a flat 200MA, comparable to another point (in red) earlier on in the evolution of price
Moving averages will recover the same, after a small dip.
I am very bullish on Solana and the NFTS on their platform

SOL/BTC. The Golden 618?SOL/BTC
With the general uptrend in the alts, I wouldn't say Solana is lagging behind. A few more weeks and its decision time. :)

💥SOLANA AT BREAKOUT POINT🚀Please support this idea with a LIKE👍 if you find it useful🥳
Not a financial advice🙅🏼♂️
As shown here, solana is at the tip of the falling wedge pattern.
The question here is, “will solana break out of the falling wedge to the upward direction or downward?”
What do you think?
Share your opinion in the comment section✍️
You can also demand for analysis of your preferred coin
Follow me stay updated about this coin and more helpful projects like this🎁
Happy Trading💰🥳🤗

sol looking for a breakoutsol is looking great to accumulate down here,
could potentially be close to breaking the down trend
hope u got in when i posted a week earlier