Solana (SOL) - May 22Hello?
Dear traders, nice to meet you.
By "following" you can always get new information quickly.
Please also click "Like".
Have a good day.
-------------------------------------
(SOLUSD 1D chart)
You should watch for any movement that deviates from the 35.91626787-47.48882701 segment.
If it falls, you need to make sure you get support in the 32.05874831-35.91626787 range.
To maintain the uptrend, it must rise above the 43.90524575 point and gain support.
After the plunge, it rebounded and is showing a decline again.
I think there is a high possibility of forming a box section by repeating these rises and falls.
The next volatility period is around May 29th-June 2nd.
-------------------------------------
(SOLBTC 1D chart)
We have to see if we can get support and ascend at the 96672 Satoshi point.
If it falls, we need to see if it can rise along the uptrend line.
If it falls at 51156 Satoshi, Stop Loss is needed to preserve profit and loss.
However, it may rise along the uptrend line, so careful trading is necessary.
--------------------------------------
It is advisable to trade at your average unit price.
This is because if the price flows below your average unit price, which was on an uptrend or downtrend, there is a high possibility that you will not be able to earn a large profit due to the psychological burden.
The center of every trade starts with the average unit price you start trading.
If you ignore this, you may be trading in the wrong direction.
Therefore, it is important to find a way to lower the average unit price and adjust the proportion of the investment, so that the money that ultimately corresponds to the profit can regenerate the profit.
-------------------------------------------------- -------------------------------------------
** All indicators are lagging indicators.
So, it's important to be aware that the indicator moves accordingly with the movement of price and volume.
Just for the sake of convenience, we are talking upside down for interpretation of the indicators.
** The wRSI_SR indicator is an indicator created by adding settings and options from the existing Stochastic RSI indicator.
Therefore, the interpretation is the same as the conventional stochastic RSI indicator. (K, D line -> R, S line)
** The OBV indicator was re-created by applying a formula to the DepthHouse Trading indicator, an indicator that oh92 disclosed. (Thank you for this.)
** Check support, resistance, and abbreviation points.
** Support or resistance is based on the closing price of the 1D chart.
** All explanations are for reference only and do not guarantee profit or loss on investment.
Explanation of abbreviations displayed on the chart
R: A point or section of resistance that requires a response to preserve profits
S-L: Stop Loss point or section
S: A point or segment that can be bought for profit generation as a support point or segment
(Short-term Stop Loss can be said to be a point where profits and losses can be preserved or additionally entered through installment transactions. It is a short-term investment perspective.
GAP refers to the difference in prices that occurred when the stock market or CME and BAKKT exchanges were closed because they are not trading 24 hours a day.
G1: Closing price when closed
G2: Cigar at the time of opening
(Example) Gap (G1-G2)
Solbtc


SOLANA X2 from now, soonMy View into Solana/Usdt moving in short-term (1-2 Months) from now.
We can see a strong support zone, and i'm expecting a bullish rally

SOL Is Completely ready for a BIG MOVE to Moon!We also have witnessed in last BTC DUMP that SOL was the only coin going against Whole Market.
Right now it's just behind $50 Psychological Resistance.
Once it's broken, $100 Psychological Target is just a matter of Time.
Currently it is Sitting Perfectly at Daily Support of $39 and in Accumulation Phase.

SOL Strong BuyA flag has formed at the top of this bullish structure, indicative of a bullish continuation pattern
Breakout should be up out of the flag

Solana: Potential buying areas #SOLLooking at Solana on a logarithmic scale we can see that it has been following a trendline (green) very closely. Only until recently has Solana deviated away from this trendline due to market exuberance. As of right now this asset looks like it is either setting up for another leg up or it might need to dip down to the green trend line to validate support before continuing its growth. Personally, I like the $28-$32 level for potential buying levels.
*choose wisely*
*not financial advice*


Solana ready to go Higher! Things to Note:
1. Hugging 200 EMA
2. Near Support zone
3. Volume is expanding
P.S: This is NOT investment advice. This chart is meant for learning purposes only and is a part of my personal journal. Invest your capital at your own risk

Solana (SOL) - May 6Hello?
Dear traders, nice to meet you.
By "following" you can always get new information quickly.
Please also click "Like".
Have a good day.
-------------------------------------
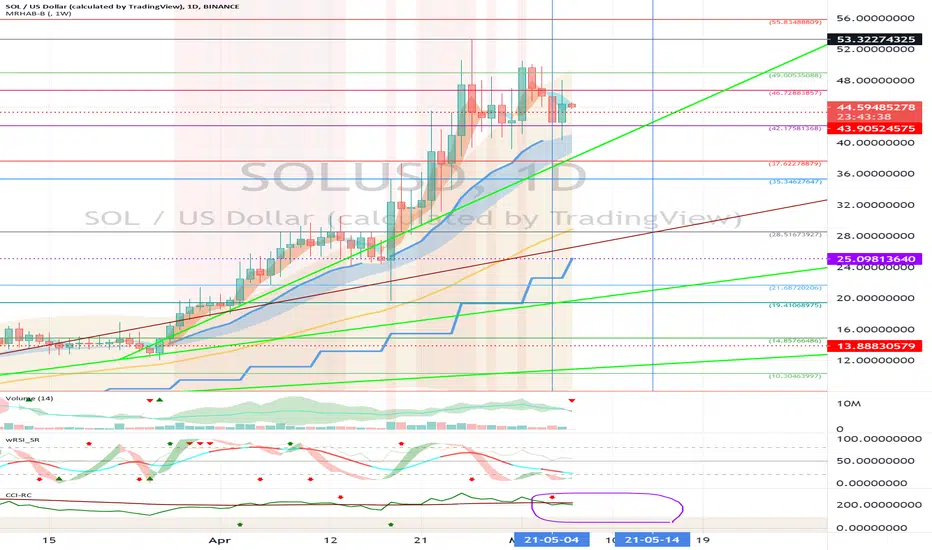
(SOLUSD 1W chart)
(1D chart)
You should watch for any movement that deviates from the 42.17581368-46.72883857 segment.
If you go down at 42.17581368, you can touch the 35.34678647-37.62278879 area, so you need to trade carefully.
In particular, it remains to be seen if it can rise along the uptrend line.
In the CCI-RC indicator, the CCI line fell below the EMA line.
We must see if the CCI line can quickly rise above the EMA line.
Therefore, careful trading is necessary.
--------------------------------------
(SOLBTC 1W chart)
(1D chart)
73914 Satoshi-96672 Satoshi should be watched to see if any movement deviates from it.
In particular, it remains to be seen if it can rise above the 81216 Satoshi point and break off the downtrend line.
If you fall in the 66328 Satoshi-73914 Satoshi section, a short stop loss is required.
If it falls at 51156 Satoshi, Stop Loss is needed to preserve profit and loss.
However, it may rise along the uptrend line, so careful trading is necessary.
On the CCI-RC indicator, the CCI line fell below the EMA line, showing a short-term downtrend.
We must see if the CCI line can quickly rise above the EMA line.
--------------------------------------
It is advisable to trade at your average unit price.
This is because if the price flows below your average unit price, which was on an uptrend or downtrend, there is a high possibility that you will not be able to earn a large profit due to the psychological burden.
The center of every trade starts with the average unit price you start trading.
If you ignore this, you may be trading in the wrong direction.
Therefore, it is important to find a way to lower the average unit price and adjust the proportion of the investment, so that the money that ultimately corresponds to the profit can regenerate the profit.
-------------------------------------------------- -------------------------------------------
** All indicators are lagging indicators.
So, it's important to be aware that the indicator moves accordingly with the movement of price and volume.
Just for the sake of convenience, we are talking upside down for interpretation of the indicators.
** The wRSI_SR indicator is an indicator created by adding settings and options from the existing Stochastic RSI indicator.
Therefore, the interpretation is the same as the conventional stochastic RSI indicator. (K, D line -> R, S line)
** The OBV indicator was re-created by applying a formula to the DepthHouse Trading indicator, an indicator that oh92 disclosed. (Thank you for this.)
** Check support, resistance, and abbreviation points.
** Support or resistance is based on the closing price of the 1D chart.
** All explanations are for reference only and do not guarantee profit or loss on investment.
Explanation of abbreviations displayed on the chart
R: A point or section of resistance that requires a response to preserve profits
S-L: Stop Loss point or section
S: A point or segment that can be bought for profit generation as a support point or segment
(Short-term Stop Loss can be said to be a point where profits and losses can be preserved or additionally entered through installment transactions. It is a short-term investment perspective.)
GAP refers to the difference in prices that occurred when the stock market, CME, and BAKKT exchanges were closed because they do not trade 24 hours a day.
G1: Closing price when closed
G2: Cigar at the time of opening
(Example) Gap (G1-G2)
Solana SOLSolana is a fast-growing blockchain ecosystem that shows incredible progress for SRM, Waves, and others. solana.com
Now, we are moving in an upward channel. After testing the lower line of this channel, I think we will break the upper resistance line and go to $60.

SOL - possible 25% gainBINANCE:SOLUSDT is moving in a upwards channel and is reaching the bottom.
When we are now moving up again we could see a 25% gain until it reaches the top of the channel.
No financial advice.

Solana (SOL) - April 27Hello?
Dear traders, nice to meet you.
By "following" you can always get new information quickly.
Please also click "Like".
Have a good day.
----------------------------------
You should watch for any movement that deviates from the 42.17581368-46.72883857 segment.
If it falls, you need to make sure you get support in the 35.34627647-37.62278879 area.
If you decline at 35.34627647, you need a short stop loss.
However, it may rise along the uptrend line, so careful trading is necessary.
----------------------------------
(SOLBTC 1D chart)
79201 Satoshi-100219 You must watch for any movement that deviates from the Satoshi section.
In particular, it remains to be seen if it can rise above the 89710 Satoshi point by ascending along the uptrend line.
--------------------------------------
It is advisable to trade at your average unit price.
This is because if the price flows below your average unit price, which was on an uptrend or downtrend, there is a high possibility that you will not be able to earn a large profit due to the psychological burden.
The center of every trade starts with the average unit price you start trading.
If you ignore this, you may be trading in the wrong direction.
Therefore, it is important to find a way to lower the average unit price and adjust the proportion of the investment, so that the money that ultimately corresponds to the profit can regenerate the profit.
-------------------------------------------------- -------------------------------------------
** All indicators are lagging indicators.
So, it's important to be aware that the indicator moves accordingly with the movement of price and volume.
Just for the sake of convenience, we are talking upside down for interpretation of the indicators.
** The wRSI_SR indicator is an indicator created by adding settings and options from the existing Stochastic RSI indicator.
Therefore, the interpretation is the same as the conventional stochastic RSI indicator. (K, D line -> R, S line)
** The OBV indicator was re-created by applying a formula to the DepthHouse Trading indicator, an indicator that oh92 disclosed. (Thank you for this.)
** Check support, resistance, and abbreviation points.
** Support or resistance is based on the closing price of the 1D chart.
** All explanations are for reference only and do not guarantee profit or loss on investment.
Explanation of abbreviations displayed on the chart
R: A point or section of resistance that requires a response to preserve profits
S-L: Stop Loss point or section
S: A point or segment that can be bought for profit generation as a support point or segment
(Short-term Stop Loss can be said to be a point where profits and losses can be preserved or additionally entered through installment transactions. It is a short-term investment perspective.)
GAP refers to the difference in prices that occurred when the stock market, CME, and BAKKT exchanges were closed because they do not trade 24 hours a day.
G1: Closing price when closed
G2: Cigar at the time of opening
(Example) Gap (G1-G2)

Solbtc to moon? Yes!!!Hi guys
Sol is doing great even in these harsh days against btc. It has good news coming in future and technically a very strong platform. It can make correction buy don't worry as up trend has not broken and trend is your friend.
What are your thoughts about sol let me know in comments.
Like and follow me for more good ideas 💡
Have a nice day
Not a financial advise

220 DAILY RESISTANCE HUGE BREAKOUT MIGHT HAPPENSOL ecosystem coins started to move (RAMP, REN --> look at my profile for the charts)
If SOL breakes this resistance, it will be huge.

SOLANA- SOLthis is my own reference material. not advice. benchmarking purposes and personal research only.
That said. if you like my ideas and predictions. please feel free to follow me here and on twitter for my more unprofessional opinions.
OK- aggressive call here. Enough people have me sold on the chain that i've entered a trade here at its ATH. Retested for support about an hour ago. Went leveraaged long. Looking for a $42.50 target in the next 12-24hrs potentially. already up $2 in the past 2hrs.
Stop loss set at 37.50

Long $SOLUSD for upcoming price discovery towards $160ishThe strong hand accumulation is done.
Now smart retail is coming into it.
By the time it goes into full-fledged FOMO, the price might be north of $160. Price also broke a long-running trendline as shown

Solana updateReached our first target of 49800 sats. I've moved up my SL just below the most recent low and will now target the 1.618 FIB level around 56000 sats.
I took 50% profits at our first target and will take 40% out of the remaining position once we hit 56000 sats.
Are you catching this move?

Solana (SOL) - April 17Hello?
Dear traders, nice to meet you.
By "following" you can always get new information quickly.
Please also click "Like".
Have a good day.
----------------------------------
We have to see if we can get support and ascend at point 25.18943417.
If you move down from the 25.18943417 point, you can touch the 22.52378481 point, so you need a short Stop Loss.
The next volatility period is around April 21st.
-----------------------------------
(SOLBTC 1D chart)
We have to see if we can get support and ascend at the 40702 Satoshi point.
If you fall from the 40702 Satoshi point, you can touch the 31937 Satoshi point, so you need a short Stop Loss.
Accordingly, it is necessary to think about how to continue trading in the 31937 Satoshi-40702 Satoshi section.
-------------------------------------------------- -------------------------------------------
** All indicators are lagging indicators.
So, it's important to be aware that the indicator moves accordingly with the movement of price and volume.
Just for the sake of convenience, we are talking upside down for interpretation of the indicators.
** The wRSI_SR indicator is an indicator created by adding settings and options from the existing Stochastic RSI indicator.
Therefore, the interpretation is the same as the conventional stochastic RSI indicator. (K, D line -> R, S line)
** The OBV indicator was re-created by applying a formula to the DepthHouse Trading indicator, an indicator that oh92 disclosed. (Thank you for this.)
** Check support, resistance, and abbreviation points.
** Support or resistance is based on the closing price of the 1D chart.
** All explanations are for reference only and do not guarantee profit or loss on investment.
Explanation of abbreviations displayed on the chart
R: A point or section of resistance that requires a response to preserve profits
S-L: Stop Loss point or section
S: A point or segment that can be bought for profit generation as a support point or segment
(Short-term Stop Loss can be said to be a point where profits and losses can be preserved or additionally entered through installment transactions. It is a short-term investment perspective.)
GAP refers to the difference in prices that occurred when the stock market, CME, and BAKKT exchanges were closed because they do not trade 24 hours a day.
G1: Closing price when closed
G2: Cigar at the time of opening
(Example) Gap (G1-G2)

Solana entry opportunitySolana is one the strongest projects at the moment from a TA point of view. It holds up well against its BTC pair and makes it interesting to trade.
- Bullish divergence on RSI
- Hammer candlestick
- Touching .382 FIB (strong level for a bounce in a bull run)
- Confluence with the green support zone
Easy 20% run towards the ATH.

Solana (SOL) - April 7Hello?
Dear traders, nice to meet you.
By "following" you can always get new information quickly.
Please also ask for the "Like" clock.
Have a nice day.
----------------------------------
We have to see if we can get support at the 25.18943417 point.
If it falls, we need to make sure we get support at 21.19096021-22.52378481.
In particular, it remains to be seen if it can rise along the uptrend line.
If it falls in the 17.19248626-18.77757520 section, a short stop loss is required.
The next volatility period is around April 13th.
----------------------------------
(SOLBTC 1D chart)
We have to see if we can get support at 0.00040702 and climb above 0.00049468.
If you fall between 0.00029015-0.00031937, you need a short stop loss.
-------------------------------------------------- -------------------------------------------
** All indicators are lagging indicators.
So, it's important to be aware that the indicator moves accordingly with the movement of price and volume.
Just for the sake of convenience, we are talking upside down for interpretation of the indicators.
** The wRSI_SR indicator is an indicator created by adding settings and options from the existing Stochastic RSI indicator.
Therefore, the interpretation is the same as the conventional stochastic RSI indicator. (K, D line -> R, S line)
** The OBV indicator was re-created by applying a formula to the DepthHouse Trading indicator, an indicator that oh92 disclosed. (Thank you for this.)
** Check support, resistance, and abbreviation points.
** Support or resistance is based on the closing price of the 1D chart.
** All explanations are for reference only and do not guarantee profit or loss on investment.
Explanation of abbreviations displayed on the chart
R: A point or section of resistance that requires a response to preserve profits
S-L: Stop Loss point or section
S: A point or segment that can be bought for profit generation as a support point or segment
(Short-term Stop Loss can be said to be a point where profits and losses can be preserved or additionally entered through installment transactions. It is a short-term investment perspective.)
GAP refers to the difference in prices that occurred when the stock market, CME, and BAKKT exchanges were closed because they do not trade 24 hours a day.
G1: Closing price when closed
G2: Market price at the time of opening
(Example) Gap (G1-G2)


Solana (SOL) - March 29Hello?
Dear traders, nice to meet you.
By "following" you can always get new information quickly.
Please also click "Like".
Have a nice day.
-------------------------------------------------- -----
We have to see if we can get support by ascending to the 18.37834178-19.23732932 range.
If it falls, you need to make sure you get support at 16.66036662.
If it falls in the 14.08340393-14.94239146 range, a short stop loss is required.
However, it may rise along the uptrend line, so careful trading is necessary.
------------------------------------
(SOLBTC 1D chart)
We need to see if we can get support at 0.00031937 and break above the downtrend line.
If it falls, you need to make sure you get support in the 0.00029015-0.00031937 range.
If it falls between 0.00023171-0.00024981, Stop Loss is required to preserve profit and loss.
However, it may rise along the uptrend line, so careful trading is necessary.
-------------------------------------------------- -------------------------------------------
** All indicators are lagging indicators.
So, it's important to be aware that the indicator moves accordingly with the movement of price and volume.
Just for convenience, we are talking upside down for interpretation of the indicators.
** The wRSI_SR indicator is an indicator created by adding settings and options from the existing Stochastic RSI indicator.
Hence, the interpretation is the same as the traditional Stochastic RSI indicator. (K, D line -> R, S line)
** The OBV indicator was re-created by applying a formula to the DepthHouse Trading indicator, an indicator that oh92 disclosed. (Thank you for this.)
** Check support, resistance, and abbreviation points.
** Support or resistance is based on the closing price of the 1D chart.
** All explanations are for reference only and do not guarantee profit or loss on investment.
Explanation of abbreviations displayed on the chart
R: A point or section of resistance that requires a response to preserve profits
S-L: Stop Loss point or section
S: A point or segment that can be bought for profit generation as a support point or segment
(Short-term Stop Loss can be said to be a point where profits and losses can be preserved or additionally entered through installment transactions. It is a short-term investment perspective.)
GAP refers to the difference in prices that occurred when the stock market, CME, and BAKKT exchanges were closed because they do not trade 24 hours a day.
G1: Closing price when closed
G2: Cigar at the time of opening
(Example) Gap (G1-G2)
