Solana Roadmap!!!Today, I want to analyze the Solana ( BINANCE:SOLUSDT ) project for you; I hope it will be useful 😊.
First, let's have a fundamental analysis of the Solana project .
1. Network and On-Chain Performance :
Solana, using its Proof of History (PoH) technology, is known for high speed and excellent scalability.
The number of transactions and active users in its on-chain ecosystem continues to grow, and the total value locked (TVL) in DeFi protocols on Solana remains high.
However, network outages in the past have slightly damaged user and investor trust.
2. News and Developments :
Solana is actively collaborating with new NFT and DeFi projects, contributing to the growth of its ecosystem.
The development team is working on resolving technical issues and upgrading the network to enhance stability and security.
---------------------------------------------
Now, let's take a look at Solana's technical analysis .
When Bitcoin( BINANCE:BTCUSDT ) touched $50,000 on August 5 , Solana also touched $110 , with so much volume that these last two months' moves seem to be in the form of a correction , and we should expect another Solana correction .
According to the theory of Elliott waves , Solana seems to have completed the main wave 3 at $193.9 8 , so that the microwave 5 of the microwave 5 of the main wave 3 is truncated .
Before conclusion , let's take a look at the BINANCE:SOLBTC chart .
SOLBTC is moving in a Symmetrical Triangle in the daily time frame, and if SOLBTC starts to increase again from the lower line of the symmetrical triangle , we can hope that if Bitcoin experiences a sharp fall, the Solana project will fall less and vice versa.👇
I expect Solana to drop at least -20% after breaking the Support lines and move back to near the lower line of the descending channel . Factors such as outages or disruptions in the Solana blockchain network can lead to further modification of this token .
Educational tip : TradingView has released a new update for the Parallel Channel these few days, which can be very useful. I definitely suggest you visit this article .
⚠️ Note: If Solana can break the Resistance zone($164-$154), we should expect Solana to rise to $200. ⚠️
Solana Analyze (SOLUSDT), Daily time frame⏰.
🔔Be sure to follow the updated ideas.🔔
Do not forget to put Stop loss for your positions (For every position you want to open).
Please follow your strategy and updates; this is just my Idea, and I will gladly see your ideas in this post.
Please do not forget the ✅' like '✅ button 🙏😊 & Share it with your friends; thanks, and Trade safe.
Solbtc

SOL / BTC Forming a Bowl and Smooth Accumulations !
Solana's performance against Bitcoin has been quite healthy over the past few years.
Before the FTX collapse, the price consolidated for months in a completely horizontal range.
The FTX crash caused the price to form the bottom of the bowl structure and the price accumulated in the bottom of the bowl for months.
After months of accumulation, the price broke above two consecutive downward accumulation areas, settling just above the first accumulation area.
The fact that the current accumulation zone just above first accumulation zone has acted as support for the past 7 months indicates a very healthy trajectory.
Moreover, this 7-month horizontal process seems to have started turning upwards in September, touching the bowl structure.
If this structure continues to function healthily, it means that the direction will continue upwards in the near term, reaching as far as the end of the bowl.

SOL shortIn continuation of more general overview (see "Related publications" below)
Expecting the SOL/BTC SOL/USDT pairs to correct together with the market correction, but with much higher amplitude. SOL/BTC is still standing strong compare to overall alt/btc pairs, and the ecosystem.. well, i see the similarities to the XRP behaviour and high value during initial crypto run for example. overall - overvalued. Thus, the correction on BTCUSDT equals to the correction on SOL/BTC, SOLUSDT pair to drop into 60-70 range, prob lower.

ETH vs BTC vs SOL BNBETH was consistently lost value against BTC over multiple cycles, take a look also at SOLETH chart, you will see...
This trend, ETHBTC, is here to stay and ETH will remain just another coin?
My perspective: this cycle is decisive for ETH

SOL 100-200-300-400$ (in 2025)Solana, which emerged on the blockchain technology scene in 2017, has quickly established itself as one of the most promising solutions for scalable decentralized applications (DApps). Since the launch of the core network beta in March 2021, Solana has entered the top 5 cryptocurrencies by market capitalization, demonstrating an impressive ability to process over 65,000 transactions per second. This characteristic makes it attractive to developers looking to build fast, efficient, and low-cost DApps.
The Solana ecosystem is rich and diverse, including DeFi, RWA, NFT, and DAO (Decentralized Autonomous Organizations) projects. Its architecture supports complex smart contracts, which opens the door for innovative applications ranging from simple transactions to complex financial instruments and gaming platforms.
One of Solana's key development areas is tokenization of real-world assets. Tokenization turns rights to physical or traditional assets, such as real estate, artwork, or securities, into digital tokens on the blockchain. This not only increases the liquidity of assets, but also allows smaller investors to participate in markets that were previously inaccessible to them. Solana, with its high throughput and low transaction fees, becomes the ideal platform for such innovation.
Roadmap and upgrades
Solana's roadmap and upcoming updates reflect its commitment to improving performance, scalability and usability, positioning itself as the leading platform for high-performance blockchain applications. An overview of current plans and updates is provided below:
Scaling and Performance
Solana is gearing up for significant improvements with the introduction of the Firedancer validator client, developed in collaboration with Jump Crypto. Firedancer is designed to significantly increase the transaction processing capabilities of the network, with test environments already demonstrating capabilities in excess of 1 million TPS. This upgrade is part of Solana's broader strategy to scale the network to meet future growth and demand.
Network and stability improvements
After experiencing network stability issues, Solana has focused on improving the upgrade process. This includes improving the testing phases with external developers and auditors, as well as creating a team of adversaries to simulate attacks and find vulnerabilities. Moving from a focus on new features to network stability: a significant portion of the engineering team is dedicated to stability and adversarial testing.
Ecosystem and developer support
The Solana roadmap includes extensive developer support through grants, hackathons, and improved tools to foster an agile ecosystem. This includes improving Solana's runtime environment and introducing new features such as prioritized payments to better manage the urgency of transactions.
Expanding promising areas
Solana's focus goes beyond mere technical upgrades to include expanding the ecosystem, empowering developers and making the platform attractive to new projects, especially in the areas of DeFi, RWA and Web3 applications.
This roadmap and series of updates underscores Solana's commitment to not only improve its current technology stack, but also to remain at the forefront of blockchain innovation by offering a reliable, fast and scalable platform for both developers and users.
Statistics and metrics
At the moment, Solana's stats show several positive aspects:
TVL
The Solana network has reached a yearly high in TVL, indicating an increased interest and confidence in DeFi projects on this platform, with Solana's TVL currently at $5.1 billion.
Commissions
There has been a significant reduction in transaction fees on the Solana network, making it more attractive to users and developers.
Increase in the number of active addresses
There has been an increase in the number of daily active addresses, indicating an expanding user base.
Interest from institutional investors
Solana has attracted the attention of both retail and institutional traders due to its unique consensus approach, indicating that its long-term potential is recognized. It's also possible that a Solana ETF is coming soon! BUT IT IS NOT CERTAIN
Overall Dynamics
Despite some fluctuations, the overall trend for Solana remains positive, with notable price appreciation compared to previous periods and active ecosystem development.
Real World Assets (RWA)
Solana, like any other public blockchain, provides transparency, automates payment settlement, allows users to self-manage assets, and offers a global settlement infrastructure for tokenized assets that operates 24/7. However, beyond the general benefits of public blockchains, Solana stands out with the following advantages.
Low transaction fees and high speed:
For high frequency use cases such as tokenized Forex, equities, etc., Solana enables trading with extremely low fees, fast transaction confirmation and high throughput - all with a single global network state.
Standards and Ecosystem:
A healthy ecosystem, including battle-tested decentralized exchanges (DEXs) as well as robust standards such as cNFTs (compressed NFTs), pNFTs (programmable NFTs), Token 2022, and others, provides real-world digital assets (RWAs) with the necessary building blocks to create and launch their products. We will take a closer look at the infrastructure available for RWA projects on Solana later in this study.
While stablecoins are not typically categorized as real world assets (RWAs), they are the first type of RWA to gain significant traction, being backed by US dollars and Treasury bonds (T-Bills) as core reserves.
Stablecoins can be said to demonstrate the highest product-market fit in the RWA category. The following stablecoins are available on the Solana platform:
USDC, backed by US dollars held in US banks, and T-Bills, managed by BlackRock.
USDT, which is said to be backed by US dollars, T-Bills and other assets.
USDY, an income-generating stablecoin backed by tokenized Treasury bonds issued by Ondo Finance.
USDP by Paxos. UXD, partially backed by real world assets such as private credit.
Bridged Wormhole DAI, backed by DAI, which in turn is partially backed by RWA.
QCAD, a stablecoin backed by the Canadian dollar.
EUROE, a steiblcoin backed by the euro.
ISC, backed by a basket of real world assets.
EUROC by Circle.
GYEN and ZUSD by GMO-Z.
Expect to see a slew of new non-dollar-backed steblecoins, as well as innovations in revenue-generating steblecoins, on Solana in the coming months.
Two major real estate players on Solana are already up and running and performing incredibly well - Parcl and Homebase. While both may seem similar at first glance, they are quite different. While Homebase represents real estate on the web, Parcl focuses on tokenizing a real estate price index:
Homebase
SPV creation: A Homebase Special Purpose Vehicle (SPV) acquires real estate and NFTs represent an ownership stake in that SPV. Users purchase properties for sale through Homebase using a USDC stablcoin, which is represented in the form of NFTs. The USDC collected is pooled and converted into US dollars to purchase real estate associated with the SPV. The rental income generated in dollars is converted back to USDC and users automatically receive monthly rental income into their wallets. Users can buy and sell Home NFT on the Homebase marketplace. The best part is that Homebase is fully compliant with the law: the tokens are registered with the SEC, and there are established procedures in place to recover the tokens if a user's wallet is hacked. However, at the moment, the service is only available to US residents.
Parcl
Parcl allows you to invest in real estate starting at $1 by providing access to real estate markets in cities around the world through REIT-like indexes. Think of Parcl as a company that creates real estate indexes, functioning as a price information service. It has also developed a persistent AMM platform to trade these indexes, allowing users to take long or short positions. Parcl currently has over $1 million in collateral (TVL) and is active in major U.S. cities such as Brooklyn, Las Vegas, and Paris, with plans to add cities such as London, Jakarta, and Hong Kong.
The great thing is that the real estate market is not a game with one winner. There can be over 100 real estate tokenization marketplaces on Solana without directly competing with each other, as they can serve different geographic regions and tap into a huge industry worth over $400 trillion!
Meme
The development of memes in the Solana ecosystem reflects a broader cultural phenomenon where internet culture intersects with cryptocurrency technology to create a unique space for creativity, investment and community. On Solana, as with other blockchain systems, memes have evolved from mere jokes to meaningful digital assets known as meme tokens or memcoins. Starting in late 2023 and continuing into 2024, memes on Solana have begun to gain momentum, thanks in part to the network's high bandwidth and low transaction costs, making it attractive for creating and trading meme tokens. Memcoins such as BONK, Dogwifhat, and Myro have become known not only for their humorous content, but also for the innovations they have brought to the ecosystem. For example, BONK stood out because of its eirdrop strategy to stimulate activity in the Solana community. Unlike the first memes, which were mostly about humor, the new memes on Solana began to offer real utility. Projects began to integrate memes into broader ecosystems, including decentralized applications (dApps) and even new blockchain layers, as seen in the Base ecosystem example, where memes are used to add value and engage users.
Memes have become a powerful tool for marketing and community building. They not only attract the attention of new users through humor and viral content, but also keep existing members interested through constant interaction and new initiatives like airdrop or special events. Despite the fun and potential for rapid growth in value, meme tokens carry significant risks due to their speculative nature. Statistics show that only about 10% of all wallets are profi...
The development of memes in the Solana ecosystem demonstrates how digital culture can influence financial technology, creating new forms of engagement, investment and innovation. While memes began as jokes, they have evolved to become part of a broader movement in the cryptocurrency industry where community, technology, and economics intersect in the most unexpected ways.
Token Standards
The SPL token protocol in the Solana ecosystem sets the rules for the creation and operation of both NFT and fungible tokens, ensuring their compatibility with wallets and smart contracts on the platform. Unlike Ethereum, which uses separate standards for different classes of tokens, such as ERC-20 for fungible and ERC-721 for non-fungible tokens, the SPL on Solana is used universally for all types of tokens, the differences between which are laid down at the time of their initialization. Solana has also introduced token-2022, which promises to empower developers and users to issue and manage tokens. Token standards play a key role in ensuring “tokenization” is done in a secure and standardized way:
SPL Token: The main token standard on Solana, representing fungible tokens. Like any stablecoin, any Real Asset Market Participant (RWA) can launch their asset as an SPL token, including features for dynamic offering, minting, freezing, burning, and so on.
Token 2022: Extending the original standard, Token 2022 offers additional features relevant to RWAs: - Confidential Transfers: Allows private token transfers; important for institutions wishing to hide their transactions.
Transfer fees: Issuers can customize fees or taxes on certain transactions.
Interest-accumulating tokens: Tokens that accumulate interest over time, similar to bonds.
Non-transferable tokens: Tokens that cannot be transferred once issued.
Metaplex Standards for NFTs: Metaplex has developed a set of standards for NFTs, such as compressed NFTs and Programmable NFTs, which may also allow RWA market participants to represent unique assets.
Bridges
Bridges on Solana are technology solutions that enable the transfer of digital assets and information between the Solana blockchain and other blockchain systems, such as Ethereum. These bridges play a key role in enabling interoperability between different blockchain networks, allowing users to move tokens and other assets between Solana and other networks, which opens up access to applications and services on Solana, such as decentralized financial applications (DeFi), without having to sell their assets on one network to buy on another. They also improve liquidity by allowing assets to be used across multiple ecosystems, which can attract more users and increase trading volumes. In addition, breeches can reduce costs and transaction times, given that Solana is known for its low fees and high transaction speeds.
As of the latest information, popular breeches for Solana include Wormhole, which connects Solana to other blockchains including Ethereum, Allbridge, which provides the ability to transfer assets between different blockchain systems, Portal by Wormhole, known for its low fees and high liquidity, deBridge, known for its transaction speed, and Rango Exchange, which serves as an aggregator for finding the best exchange routes between blockchains.
The process of using these bridges typically involves connecting a cryptocurrency wallet, selecting a network and token to send, and then specifying a network and token to receive. Once the transaction is confirmed, the bridge blocks assets on the source blockchain and issues equivalent tokens on the target blockchain, in this case, Solana. Using bridges on Solana expands the possibilities for users, allowing them to take advantage of different blockchain systems while remaining in an ecosystem known for its high performance and low transaction costs.
Conclusion
Research on the Solana ecosystem shows that it is attracting attention in the US due to the opportunities that decentralized exchanges (DEXs) provide for tax evasion, as transactions on such platforms are more difficult to track. In this context, Circle's USDC stands out as the most popular stablecoin, providing stability and trust in transactions. At the same time, the meme culture in the cryptocurrency sphere has a significant impact, directing investment flows and creating temporary but powerful trends. These trends are expected to spill over into more stable or innovative sectors such as Real World Assets (RWAs) over time, indicating an evolution of investor interest. The Solana ecosystem is also seeing interest in new technologies and tools, which may include various protocols aimed at improving its functionality. The crowning achievement of Solana's development is seen by many as the possibility of issuing an exchange-traded fund (ETF), which would mean recognition from traditional finance and could significantly strengthen Solana's position as one of the leading and fastest growing cryptocurrency ecosystems in the market. Solana, despite its reputation as one of the fastest blockchain networks, has faced challenges in the form of intermittent outages. These incidents raise questions about the stability and reliability of the network, especially during periods of high load. The interconnection between Solana and FTX, as well as Alameda Research, has led to concerns about possible market manipulation. FTX and related entities have significant amounts of SOL tokens, which could theoretically give them leverage to influence the market. This situation highlights the risks associated with centralizing power in ecosystems that are supposed to be decentralized. Like many cryptocurrency projects, Solana faces regulatory risks. Increased regulation in various jurisdictions could negatively impact the liquidity, availability, and value of SOL tokens. Careful analysis, adaptation to regulatory changes and continuous technological improvement will be key to Solana's sustainable growth and stability in the future.
Best regards EXCAVO

SOL Mid Term IdeaSolana has reached a critical crossroads.
The price is currently above a crucial SR Flip zone. Staying above this level could lead to targets of $140, $162, $175, and $202, and potentially a new all-time high (ATH).
However, if it closes below this zone, we might see a pullback to the $70-$80 range.

The key is whether M-Signal can maintain its alignmentHello, traders.
If you "Follow", you can always get new information quickly.
Please also click "Boost".
Have a nice day today.
-------------------------------------
(Renko 1D chart)
Among altcoins, the number of coins showing upward movement as above is increasing.
In order for a block to be completed, it must rise by more than a block unit.
In the chart above, the rising block is completed only if it rises by more than 5.2.
Otherwise, if it falls below 4.8, the rising block disappears.
In this way, the Renko chart can be said to be a suitable chart for checking trends.
-
(SOLUSDT Renko 1D chart)
-------------------------------------------
(SOLUSDT 1M chart)
(1W chart)
(1D chart)
If you look at the 1M, 1W, and 1D charts above, you can see that the 147.74, 168.41, and 179.89 points are important.
Therefore, if it fails to rise above 168.41, it is important to find support near 147.74.
-
Due to this rise, it seems that the M-Signal of the 1D chart > M-Signal of the 1W chart > M-Signal of the 1M chart has changed.
Therefore, this time, it is important to see whether it can be supported near 147.74 and rise above 179.89.
-
Accordingly, it is a buying period depending on whether it is supported near 147.74, 168.41, and 179.89.
The stop loss point is the HA-Low indicator.
The current HA-Low indicator points are
1M: Not yet created
1W: 13.81
1D: 148.28
as above.
Since the HA-High and HA-Low indicators are created according to price fluctuations, it is recommended to check the 1M, 1W, and 1D charts together.
-
Have a good time.
Thank you.
--------------------------------------------------
- Big picture
It is expected that the real uptrend will start after rising above 29K.
The section expected to be touched in the next bull market is 81K-95K.
#BTCUSD 12M
1st: 44234.54
2nd: 61383.23
3rd: 89126.41
101875.70-106275.10 (when overshooting)
4th: 13401.28
151166.97-157451.83 (when overshooting)
5th: 178910.15
These are points where resistance is likely to occur in the future.
We need to check if these points can be broken upward.
Since I think it can create a new trend in the overshooting section, I need to check the movement when this section is touched.
#BTCUSD 1M
If the major uptrend continues until 2025, it is expected to create a pull back pattern and start after rising to around 57014.33.
1st: 43833.05
2nd: 32992.55
-----------------

#SOL/USDT#SOL
The price is moving in a descending channel on the 1-hour frame and is about to break upwards
We have a trend to stabilize above the moving average 100
We have a downtrend on the RSI indicator that supports the rise by breaking it upwards
We have a major support area in green at a price of 136.50 from which the price rebounded
Entry price 139
First target 144
Second target 150
Third target 156

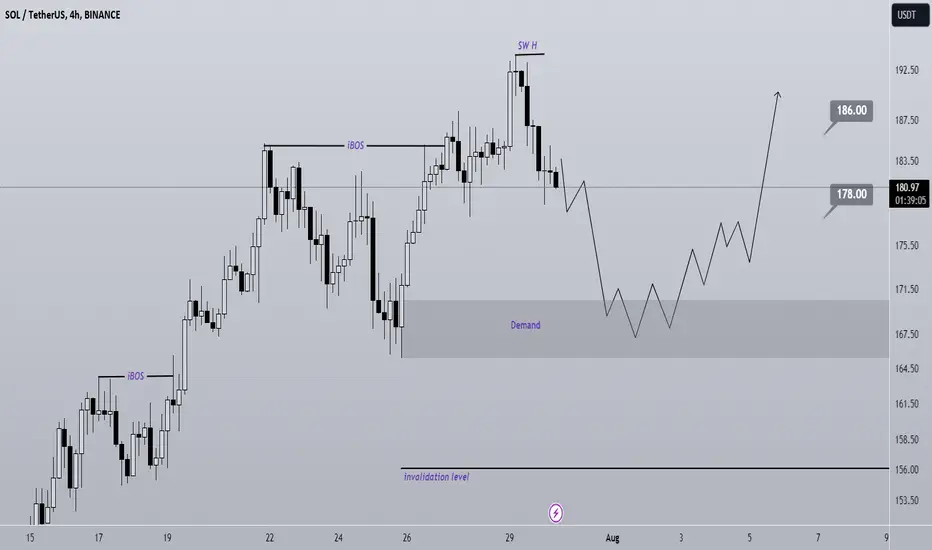
SOL sell/shot setupSOL is creating internal pullback on small time frames.
At the bottom of the candles we have a liquidity pool that is expected to be swept soon.
The targets are marked on the chart
Closing a daily candle above the invalidation level will violate the analysis.
Note that the financial market is risky, so:
Do not enter a position without setting a stop and capital management and confirmation and trigger.
When we reach the first TP, save some profit and try to move the stop continuously in the direction of your profit.
If you have any comments please post them, comments will help us improve our performance
Thanks

SOL maintaining an upward trendHello, traders.
If you "Follow", you can always get new information quickly.
Please click "Boost" as well.
Have a nice day today.
-------------------------------------
(1M chart)
Due to this change, the HA-High indicator on the 1M chart is showing signs of moving to the 147.74 point.
Accordingly, we need to check if it can receive support and rise around 0.707 (135.56) ~ 0.786 (149.62).
-
(1W chart)
We need to check if it can continue the upward trend along the upward trend line.
If not,
1st: 0.5 (98.71) ~ 0.618 (119.71)
2nd: 0.236 (51.71) ~ 0.382 (77.70)
You need to check the support near the 1st and 2nd above.
-
(1D chart)
Unlike most other coins, it is one of the coins that is maintaining an upward trend.
Accordingly, if SOL is supported in this large downtrend, it is expected to create a new large upward wave.
-
A new buy zone is possible when support is confirmed near 134.96-147.74.
If it rises, the 168.41-179.89 zone will be the first sell zone.
Therefore, it is highly likely that a full-scale uptrend will begin when the price rises above 179.89 and holds.
The stop loss point is 112.24.
Since the stop loss point is far away, investment weight adjustment is necessary.
-
Have a good time.
Thank you.
--------------------------------------------------
- Big picture
It is expected that a full-scale uptrend will begin when it rises above 29K.
The section expected to be touched in the next bull market is 81K-95K.
#BTCUSD 12M
1st: 44234.54
2nd: 61383.23
3rd: 89126.41
101875.70-106275.10 (overshooting)
4th: 13401.28
151166.97-157451.83 (overshooting)
5th: 178910.15
These are points where resistance is likely to occur in the future.
We need to check if these points can be broken upward.
We need to check the movement when this section is touched because I think a new trend can be created in the overshooting section.
#BTCUSD 1M
If the major uptrend continues until 2025, it is expected to start forming a pull back pattern after rising to around 57014.33.
1st: 43833.05
2nd: 32992.55
-----------------

#SOL/USDT#SOL
The price is moving within a descending channel pattern on the 1-hour frame and is expected to rise after it has been largely committed to it
We have a downtrend on the RSI indicator that is expected to break upwards and we have a trend to stabilize above it
We have a major support level in green at a price of 111
We have a trend to stabilize above the moving average of 100
Entry price 115
First target 125
Second target 135
Third target 146

SOLUSDT#Solana chart update: Solana is currently one of the most significantly dropped coins, having fallen almost 50% from its ATH. However, it has reached what seems to be its lowest point. We've arrived at the Fibonacci 0.5 support. I don't think it will go any lower from here. It might hover around these levels for a bit until the Iran-Israel issue calms down, and then it will likely be among the top gainers again. The time to renew its ATH will come. The expected scenario is illustrated on the chart.

SOLANA/USD Bearish in a bullish Consolidation:War+RecessionAs the Russians and Ukr. are facing to end the war,another war, in the middle east is starting:Irand vs Israel As well strategically as economically and politicially this zone of our planet is ruling all economies around the world:Oil,Gas,International trades and very important strategical zones:The survival of the world is dependent on the middle east.The middle east is the heart and ouls of the world.
Also the very negative NFP last Friday confirming that recission will come.And All this factors will increase the pain and suffer of the stock markets,FOREX and ofcourse Crypto currencies.
As Solana is now for many months in a big consolidation range we can use this situations to generate profitable situations with high probabilities:The markets tend to consolidate 70% of times. The probability the we will have an uptrend is 15%,and bear trend also 15%.So why not to use the 70% probabilitiy?
As the trend is currently long,meaning the ranges are stepping higher, the dangerouse zone for the bulls is the,,negative CRV Target,,,in green colour!
There the Bulls will face the increased risk,to add postions, or the profit portential of holding long trades is nealy zero,becuaz the bears take control.
This stage is high potential Short entry for the bears,but also taking profit area optimally for the bulls.
As we can see eachtime the market met this zone, many false breakouts (white circles) have been generated, the bears started to ride down the trend to ,,Target Negative CRV,,,in ORANGE: There the bears closed their positions and took profits,or also the bulls who hedged their positions short at around 190-205 clsoedtheir hedge positions and added more long positions at around 117-124.
The current stage of the market ,Close below FBA,, is where we are right now. The bears still in control,the market closed below that zone and opened immediately lower.The probabiliy that the bears will force solana to 120 zone is increasing.
Remember we are bearish in a bullish trend!
Where do the bulls lose total control?
This will happen,if the market closes 3Days in row below 117,and a bullish impulse or pullback to 117 or above 117 will not be successfull:That means if the bear immediately react and send down Solana forcefully below 117.This is ultimate confirmation that Bearish trend has started and Solana will fall very deep.
If the impulse overcomes 117 and continues above 125+Close,then Solana will go back to 190-208 area again.As long as Solana can saty above 180.85 Solana will try to break above this range.Once it falls back, the game repeats

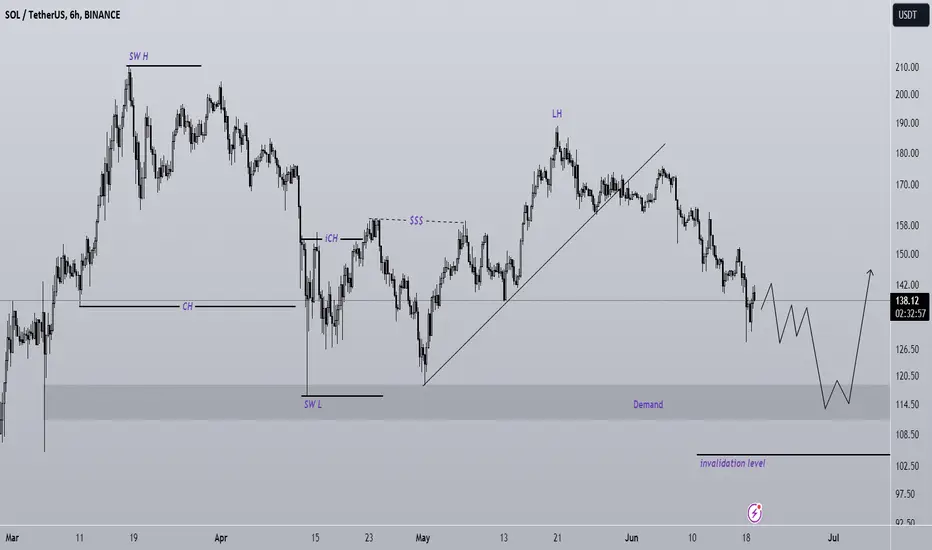
SOL buy setupThe structure of SOL is bullish and in this structure we are looking for positions aligned with the structure in the movement origins.
We have specified the support range as demand on the chart.
We are looking for buy/long positions on this range.
Closing a daily candle below the invalidation level will violate the analysis
Note that the financial market is risky, so:
Do not enter a position without setting a stop and capital management and confirmation and trigger.
When we reach the first TP, save some profit and try to move the stop continuously in the direction of your profit.
If you have any comments please post them, comments will help us improve our performance
Thanks
$SOL Dominance Weekly BREAKOUT vs $BTC DominanceAdding onto my SOL/BTC chart from yesterday.
SOL.D is also confirming the breakout vs BTC.D
Everything is SCREAMING for CRYPTOCAP:SOL to RIP!

$SOL $BTC Pair BREAKOUT ok Weekly!CRYPTOCAP:SOL Bull Pennant Breakout on the Weekly Against CRYPTOCAP:BTC
Weekly Close above the Bull Market Support Band
Last time that happened it did 435% over 28 days

SOLBTC Solana will be No. 1 Coin of Future and beat BTCCritical Vote in Washington: The Future of Bitcoin (BTC) Hangs in the Balance
Bitcoin
With Bitcoin rocketing in value and Wall Street circling like a hawk, the US crypto industry is holding its breath as a crucial vote approaches in Washington next week.
The Financial Innovation and Technology for the 21st Century Act, or Fit21, could reshape the regulatory landscape for digital assets, potentially welcoming the industry into the fold or slamming the brakes on its recent growth spurt.
“By passing this legislation, we can accelerate the growth of blockchain technology and digital assets, fostering financial inclusion and protecting national security.”
Never the Less SOLANA is in an long term upward trend but correcting at the moment

SOL IS GOING TO CRASH THE MARKET PART 2MartyBoots here. I have been trading for 17 years and I am here to share my ideas with you to help the Crypto space.
I posted about SOL crashing the market before it crashed when FTX collapsed , check back on my previous trading view videos
This is potentially forming the same pattern that crashed BTC back into COVID crash . So be on alert

$SOL is weakening against $BTC ?#sol / #btc pair chart has formed bearish shoulder head shoulder in mid term. Chart is weakening but there may be bounces or relief rallies in lower time frame. Red box is the moderate support level for #solana / #btc price if dump emerges market. Not financial advice.

🗺️Solana Roadmap🗺️📈Today, I want to analyze the Solana(SOL) project for you. Is it possible to create a New All-Time High(ATH) or not ❗️❓
🤝Please be with me.
❌Solana(SOL) was unsuccessful in the first Attack on the 🔴 Resistance zone($259.9-$196.40) 🔴 to create a new All-Time High(ATH) .
🌊In terms of Elliott wave theory, Solana(SOL) seems to have completed the main wave 3 at the Resistance zone and is currently completing the main wave 4 .
💡Before the result, let's look at the SOLBTC chart .
💡SOLBTC is moving near the Resistance line and Potential Reversal Zone(PRZ) . I expect SOLBTC to fall at least to the Support line , and if SOLUSDT is also bearish, the downward momentum can increase .👇
🔔I expect the main wave 4 to finish at the 🟡Potential Reversal Zone(PRZ)🟡 or 🟢 Support zone($82.00-$56.10) 🟢.
❗️⚠️Note⚠️❗️: An important point you should always remember is capital management and lack of greed.
Solana Analyze ( SOLUSDT ), Daily time frame ⏰.
Do not forget to put Stop loss for your positions (For every position you want to open).
Please follow your strategy; this is just my Idea, and I will gladly see your ideas in this post.
Please do not forget the ✅' like '✅ button 🙏😊 & Share it with your friends; thanks, and Trade safe.

SOLUSDT$SOLANA Chart Update: Looking at the CRYPTOCAP:SOL chart, we see a very attractive and well-formed bull flag pattern. Currently, the price has reached the support level of the formation, which coincides with the Fibonacci 0.618 level. If it takes support here and rises, it would confirm the upward momentum.
Targets:
1. First Target: Fibonacci 1 level at $210
2. Second Target: Fibonacci 1.272 level at $265
Let's watch closely for a bounce from this support to validate the bullish scenario! 🚀

SOL buy setupThe sol symbol is now inside a correction.
It has a good support range ahead that it can react well to.
We will look for buy/long positions on the green range.
Closing a daily candle below the invalidation level will violate the analysis.
Note that the financial market is risky, so:
Do not enter any position without confirmation and trigger.
Do not enter a position without setting a stop.
Do not enter a position without capital management.
When we reach the first TP, save some profit and try to move the stop continuously in the direction of your profit.
If you have any comments please post them, comments will help us improve our performance
Thanks
The key is whether it can rise above 168.41-173.20Hello, traders.
If you "Follow", you can always get new information quickly.
Please also click "Boost".
Have a nice day today.
-------------------------------------
When trading spot, if possible, it is recommended to start trading when the M-Signal on the 1D chart > M-Signal on the 1W chart > M-Signal on the 1M chart.
That is because the uptrend is in progress.
Currently, the M-Signal on the 1D chart > M-Signal on the 1W chart > M-Signal on the 1M chart, but since the price < M-Signal on the 1D chart, it can be interpreted that it is showing signs of turning into a short-term downtrend.
Since the HA-Low indicator of the 1D chart is created and forming a low point range, you can trade around 141.07 depending on whether there is support.
In other words, if it falls below 141.07 and shows resistance, it means that there is a possibility of a stepwise downtrend.
Therefore, it is important to know in which direction it deviates from the HA-Low (141.07) of the 1D chart ~ HA-High (173.20) of the 1D chart.
Since the HA-High (136.92) indicator of the 1M chart is created near the HA-Low indicator of the 1D chart, the area around 136.92-141.07 corresponds to the support area.
And, since the HA-High (168.41) indicator of the 1W chart is created near the HA-High indicator of the 1D chart, the area around 168.41-173.20 corresponds to the resistance area.
Anyway, since it is located near the HA-High indicator of the 1W chart and the HA-High indicator of the 1M chart, that is, near the HA-High indicator, the current price can be seen as being in the high point area.
Therefore, if the price is maintained above 168.41-173.20, it can be interpreted that there is a high possibility of maintaining an upward trend.
Therefore, if you are currently trading, I think it is better to trade from a short-term perspective.
TS - Since the BW indicator of the BW indicator has touched the lowest point, the BW indicator is expected to be created in the price candle.
Therefore, if the BW indicator is created in the price candle, you can trade depending on whether there is support near that point.
Another indicator that can be verified is the StochRSI indicator.
You can reduce psychological anxiety about buying in advance by checking if StochRSI > StochRSI EMA.
The fact that the HA-Low indicator was created means that a low point has been formed.
Therefore, if it shows support near the box range (128.50-153.39) selected based on the HA-Low indicator, it is a time to buy.
If it falls below 141.07 and a step-down trend occurs,
1st: Fibonacci ratio point 0.618 (119.71)
2nd: 99.49
You should check for support near the 1st and 2nd above.
If it starts to rise above 173.20,
1st: 234.12
2nd: 297.74
You should check for support near the 1st and 2nd above.
Have a good time.
Thank you.
--------------------------------------------------
- Big picture
It is expected that a full-scale rise will start when it rises above 29K.
The section expected to be touched in the next bull market is 81K-95K.
#BTCUSD 12M
1st: 44234.54
2nd: 61383.23
3rd: 89126.41
101875.70-106275.10 (overshooting)
4th: 13401.28
151166.97-157451.83 (overshooting)
5th: 178910.15
These are points where resistance is likely to occur in the future.
We need to check if these points can be broken upward.
We need to check the movement when this section is touched because I think a new trend can be created in the overshooting section.
#BTCUSD 1M
If the major uptrend continues until 2025, it is expected to start forming a pull back pattern after rising to around 57014.33.
1st: 43833.05
2nd: 32992.55
-----------------
