Is a corrective wave coming?SOL has registered 18% growth in the last 24 hours. Its price, which reacted positively in a very strong support range, has grown with the support of buyers up to the previous ceiling in the range of $13.85 to $14.90. The intensity of hitting this resistance is high, and there is a possibility of breaking this area and moving toward the resistance of $18.5-20.5. This resistance overlaps with the midline of the main descending channel and could send the price into a corrective wave. In the 4-hour time frame, we still do not see a definitive upward trend, and Solana's trend is upward only in the lower time frames. If the current resistance is accompanied by an initial reaction, the probability of the price entering a range below the resistance will be high. Among Solana's most important short-term supports, if the price enters a corrective wave, we can consider the range of 11 to 11.40 dollars.
Solbtc

SOL Analysishi good time
Note: This is not an analysis for buy/long, but a view for sell/short.
From the point I marked with the arrow, sol has the drop potential. I think it can be corrected up to the lower green areas.
Comment if you have any questions
Thank You

✳️ Solana Rebound vs Bitcoin | Very Easy 65% + More PossibleEverybody is looking at Solana now and that is good...
Even though there is a shakeout happening on the major altcoins Solana is giving us a clear picture.
While the USDT pair is being reviewed by everybody, we chose the BTC pairing as accumulating bitcoin at low prices is the wisest choice possible for any cryptocurrency trader.
You can gain more bitcoins by buying altcoins with your BTC.
Ok. Solana vs Bitcoin (SOLBTC).
29-December gave the reversal signal in the form of a Doji at a new low/support.
This with an oversold RSI.
The signal is confirmed once prices move above EMA10 (yesterday) on high volume (today).
So we can consider this a real move.
Things can always change and reverse... Of course, but these signals are good and strong.
Very easy target for this bounce is set at 65%.
There can be much more because Solana has gone through a very strong correction.
The market moves in cycles...
After going down, what follows is up.
Thank you for reading.
Feel free to Boost 🚀🤗😄👍 for more!
Namaste.

Solana dump goodbyeWith FTX exchange collapse the whole crypto market has been collapsing.
Most likely Solana will dump hard as FTX which was the biggest Solana supporter / Investor did exit scam.
It may become very ugly for Solana holders.
We may see some scam pump but the main direction is south.
Be careful.

#SOL/USD The Ship is Sinking.Many OGs shilling Solana on other social media platforms.
I sold mine way back when the FTT Drama started.
I had a small bag so didn't make much difference but for those who are still holding it be careful.
The chart isn't looking good.
Whatever you see on those platforms could be just an EXIT LIQUIDITY.
Be careful who you follow.
There are many other better projects to look at.
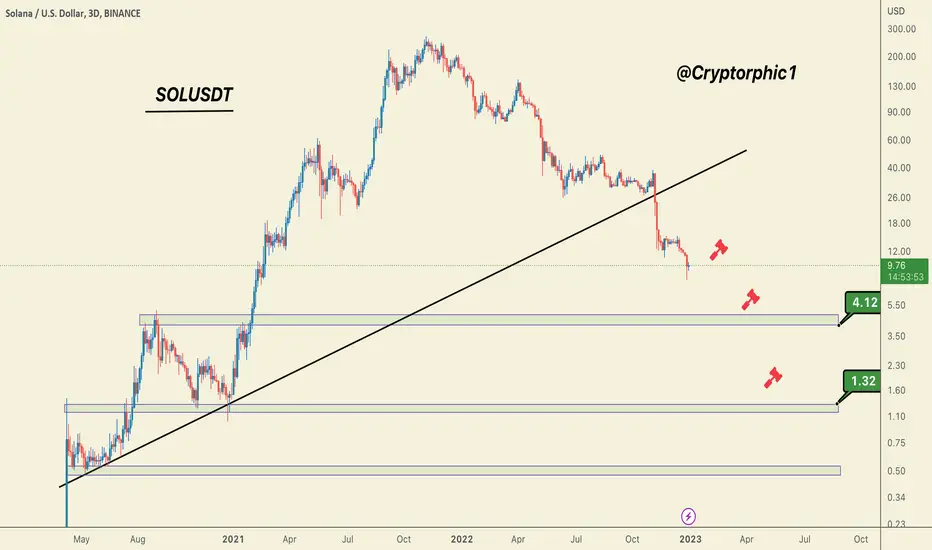
SOL has broken its long-term uptrend whole trading at $37 on 3rd November.
Lower support is at $4.12, $1, and $0.50.
I do not see any technical or fundamental reason to hold this coin though you are free to make your own decision.
This is not financial advice.
IMHO the only best coin to accumulate is BTC right now.
We may see a new low but that will merely be an opportunity.
Stay tuned and do hit the like button, I will be posting the last Bitcoin chart of 2022 later today!
CHEERS
STAY SAFE
SOL - Supports will await!If SOLANA fails to break its $10.94 resistance, the $9.20, $8.20, and even $7.50 supports will await.

Solana vs Mike Tyson. K.O.On January 12th, 2022 Mike Tyson tweet that he was "all in" Solana. Price reached a high of $153.40 that day. He pulled back and threw the haymaker. K.O.!!!!

SOL - New descending channel has formed!In the daily time frame, a new descending channel has formed.
Losing the price range of $10.95 will be a warning for the price to continue falling to the following ranges of $8.5 and $6.14.

In order to start trading, it must rise above HA-Low...Hello?
Traders, welcome.
If you "Follow", you can always get new information quickly.
Please also click "Boost".
Have a good day.
-------------------------------------
(SOLBTC 1W chart)
The price needs to stay above 0.0008 297 to gain strength.
-------------------------------------
(SOLUSDT 1W chart)
The question is whether it can break out of the downtrend channel and rise above 24.54-33.39.
If not, there is a possibility of touching around 6.70, so you need to think about countermeasures against it.
(1D chart)
Trading is possible only when it rises above HA-Low and shows support.
Therefore, it is necessary to check whether it can rise above 13.04.
If not, I expect it to fall around 6.70.
There is a significant volume proifle at 4.25, so it's good to see if volatility develops as you get closer to this point.
-------------------------------------------------- -------------------------------------------
** All descriptions are for reference only and do not guarantee profit or loss in investment.
** If you share this chart, you can use the indicators normally.
** The MRHAB-T indicator includes indicators that indicate points of support and resistance.
** SR_R_C indicators are displayed as StochRSI (line), RSI (columns), and CCI (bgcolor).
** The CCI indicator is displayed in the overbought section (CCI > +100) and oversold section (CCI < -100).
(Short-term Stop Loss can be said to be a point where profit or loss can be preserved or additional entry can be made by split trading. This is a short-term investment perspective.)
---------------------------------

Solana Analyze (Short term, Timeframe 4H, 12/19/2022)!!!📱Solana was able to break the support zone by Breakout Candle.
I expect that the pullback to the lost support zone is still ongoing, and after Solana's pullback, it will drop to the target I specified on the chart.
Solana Analyze ( SOLUSDT ) Timeframe 4h⏰ (Log Scale).
Do not forget to put Stop loss for your positions (For every position that you want to open).
Please follow your strategy, this is just my idea, and I will be glad to see your ideas in this post.
Please do not forget the ✅' like '✅ button 🙏😊 & Share it with your friends; thanks, and Trade safe.

DONT GIVE THEM YOUR SOLSOL just took out the previous bottom and bounced back into range. Hoping for further upside into the 40$+ area next.

SOL is preparing for a 7% moveBINANCE:SOLUSDT is creating a bearish flag on the 1h timeframe. And it's likely that we will see a continuation to the downside. The target of a bearish flag is equal to the height of it, and in this case it's a 7% move.

It is still a downward trend in all time frames!We have considered support in the past for Solana at $12.25-$12.75, and in this area if buyers find good support, we can see a positive swing from Solana for the coming weeks. For the short term, the resistance range of 14 to 14.2 dollars for Solana is the resistance that has prevented the upward trend in the 1-hour time frame, so Solana's trend is still downward in all time frames, and for the price to grow, it must be within the mentioned support range. Look for signs of reaction, or we should wait for the current resistance to break and the price to stabilize above this level.

The point where you can get the power to rise is...hello?
Traders, welcome.
If you "Follow", you can always get new information quickly.
Please also click "Boost".
Have a good day.
-------------------------------------
(SOLBTC 1W chart)
The key is whether it can rise above 0.0008 297 to gain momentum.
--------------------------------------
(SOLUSDT 1M Chart)
Whether it can rise above 38.79 is the key.
(1W chart)
The key question is whether it can rise above 24.54 and break out of the downtrend line.
So, you need to make sure you can get support in the 24.54-38.79 interval.
(1D chart)
The key is whether it can be supported by rising above 13.04-14.32 and rising above 19.12.
If not, you should be cautious as there is a possibility of a decline around 6.70.
Importantly, the interest is in how to lead to breaking through the two trend lines that need to be broken upward.
-------------------------------------------------- -------------------------------------------
** All descriptions are for reference only and do not guarantee profit or loss in investment.
** If you share this chart, you can use the indicators normally.
** The MRHAB-T indicator includes indicators that indicate points of support and resistance.
** SR_R_C indicators are displayed as StochRSI (line), RSI (columns), and CCI (bgcolor).
** The CCI indicator is displayed in the overbought section (CCI > +100) and oversold section (CCI < -100).
(Short-term Stop Loss can be said to be a point where profit or loss can be preserved or additional entry can be made by split trading. This is a short-term investment perspective.)
---------------------------------

Positive divergences of RSI!SOL had quite a range trend during the last week. The price is still on the support zone that has been temporarily broken. Last week, resistance in the range of $13.95 to $14.5 was considered for Solana, and there was no attempt by buyers to break this resistance. Therefore, if the market corrects and prices decrease, Solana will be one of the vulnerable currencies, which can break its support in the $12 range. In this case, we can expect the next target for sellers to be in the range of $8.7 to $8.13.
The positive divergences detected in the 4-hour time frame by the RSI could be a sign of price growth, but buyers need to at least push the price back above the $14.5 range so that we can expect short-term upside for Solana. The resistances in the $17.7, $20, and $24 ranges could each be associated with a reaction, as the previous bearish wave was very strong. The closest support to the current price is in the $12.25-$12.50 range; if this level is broken, the decline could continue.

SOLANA looks great!What are your thoughts on SOLANA? Looks to have bottomed and now the reversal, I am in at $11.88. x XXXX Seeking that $90.00 target! What if.......?

The price trend in the daily time frame is still bearish!After the continued pressure of sales in the market, the price of Solana fell to $11, but the increase in demand and the entry of a good amount of capital into the market caused this level to be fake broken. Currently, Solana is trading on support in the range of 14 dollars. There is upside potential in the 4-hour timeframe. If it happens, we can expect further price growth after the pullback to the support levels in the $14 and $13 channels.
Short-term targets for Solana are in the range of $16, $18, and $19.5. Considering the positive divergence identified for Solana in the 4-hour time frame, this price increase is possible up to the desired resistance levels. Also, with the Fibonacci retracement in the downtrend, the ranges of $17.7-$20 will be identified as serious short-term resistances, which can be profit-saving areas for short-term buyers.
But if the power of buyers and their support continues after the price hits this resistance, we can expect the possibility of breaking this resistance and continuing to move up to the $24 resistance. Note that the price trend in the daily time frame is still bearish.

SOLL WILL FALL HARDThe analysis I linked with this analysis is valid. Each top is for collecting orders and more drops
Demand 2's support range is stronger and more reliable

Solana (SOL) - November 23Hello?
Traders, welcome.
If you "Follow", you can always get new information quickly.
Please also click "Boost".
Have a good day.
-------------------------------------
(SOLBTC 1W chart)
Whether it can rise above 0.0008 297 is the key.
Receiving resistance at 0.0008 297 means that the uptrend is waning, so you should be careful with your trades.
--------------------------------------
(SOLUSDT 1W chart)
In order to turn into an uptrend, it must rise above the HA-Low and above the MS-Signal indicator.
So, the question is whether it can rise above 32.87.
In order to do that, it is important to be able to sustain the price by rising above 19.12.
(1D chart)
The key is whether it can rise above 14.32 and receive support.
If not, it is expected to lead to further declines.
Since the upward force is waning, when the price soars, it is judged that it is necessary to sell to preserve the profit and loss of the holdings.
If the upside power is lacking, I don't expect it to rise above 19.12.
-------------------------------------------------- -------------------------------------------
** All descriptions are for reference only and do not guarantee profit or loss in investment.
** If you share this chart, you can use the indicators normally.
** The MRHAB-T indicator includes indicators that indicate points of support and resistance.
** HA SRRC indicators are displayed as StochRSI (line), RSI (columns), and CCI (bgcolor).
** The CCI indicator is displayed in the overbought section (CCI > +100) and oversold section (CCI < -100).
(Short-term Stop Loss can be said to be a point where profit or loss can be preserved or additional entry can be made by split trading. This is a short-term investment perspective.)
---------------------------------

The power of sellers is still high!SOL, which was accompanied by very high selling pressure in the past weeks, has stopped this week on the support of the $11.85 to $14.40 range, but the strength of sellers is still high, and if more selling pressure is formed in the market, the possibility of breaking this support and falling There is a heavier for Solana currency. In this case, the next support for Solana is considered in the 4 to 4.40 dollars range.
Considering that the candle closed last week at a great distance from the previous bottom and dropped 59%, price targets below $10 for Solana cannot be far from the mind. All the conditions of this currency depend on the short-term trend of Bitcoin and maintaining the support of the $15,000 channel. If Solana's current support is broken, the price of this currency can fall to the first target range of $8.7-$8.13. In the 4-hour time frame, Solana's trend will not be bullish until the price above the $18.5 level is reversed.

SOL Solana Head and Shoulders Bearish Chart Pattern ??Is this looks like a gigantic Head And Shoulders bearish chart pattern for SOL Solana ???
With a neckline at $140 and a price target at $55?
No, it can`t be!
Looking forward to read your opinion about it. What type or chart pattern is this?!?

SOLUSDTPERP - no activityThere are no active buys on the chart, so far the price is moving in a narrow range.
The cryptocurrency is expected to continue its decline. "Traders are nervous about the value of SOL and the possibility of massive liquidations. SOL is a pledged asset that is likely to be liquidated as FTX/Alameda needs to raise cash. The entire Solana ecosystem has also been affected, affecting tokens created in the blockchain of the same name. In particular, the decentralized funding protocol Solend experienced a spike in liquidations, causing $3.5 million in debt on the platform.
After the previous impulse movement the price of the instrument fell by 75%.
For the given period of time we see the formation of the 9-18 range, we watch for the development of the situation.
If you liked the idea, please like it. That's the best "Thank you!" for the author 😊
P.S. Always do your own analysis before a trade. Put a stop loss. Fix profits in installments. Withdraw profits in fiat and please yourself and your
your loved ones.

Is SOL Solana the new LUNA ???The head and shoulders bearish chart pattern reached its target:
Solana was halted today!
A known bug relating to durable nonces was triggered on a majority of validators,
It hadn't been triggered in this form previously!
That lead to a block hash mismatch and validators stalling!
I think we are going to see more attacks on weak blockchains and stablecoins.
I wouldn`t be surprised to see SOL Solana going even lower!
Looking forward to read your opinion about it.
