Daily EMA 55 needs to move above EMA 200!!
My general bias for Solana is bullish. However, the current setup is very similar to the setup in Feb-Apr 2022 before Solana started a macro bear trend. (see blue rectangular box)
I am still waiting for a long trade opportunity. I am not looking for a short trade. I just need to sit tight and see how the price is going to unfold in the next few months in the daily chart.
The 2022 setup (see blue rectangular box in the chart):
1) EMA55 crossed below EMA 200 on 16th Feb 2022. (red vertical line in the chart)
2)The price found the temporary floor around $80 and sharply moved above both EMA55 and
200. (see light blue rectangular box)
3) It was the dead cat bounce. It was the beginning of the macro down trend.
4)The price spent months and months under $40 in 22 and 23, however, the price eventually
broke above both EMA 55 and 200 and when EMA55 crossed above EMA 200 in Oct
2023 (red vertical line in the chart), the macro bull trend started.
The current setup (see orange rectangular box in the chart):
1) EMA 55 crossed below EMA 200 on the 4th March 2025.
2) The price moved down to $95 area and sharply moved above both EMA 55 and EMA200. However, it failed to stay above them.
3) The price has been oscillating between $140 and $18. The price is still below EMA55 and EMA200. (see orange rectangular block)
In order to start a strong bull trend,
1) the price needs to close and stay above EMA 55 and EMA200.
2) EMA 55 needs to cross and stay above EMA 200. EMA55>EMA200
3) MACD and RSI need to enter the bull zone.
EMA55 and EMA200 do not cross easily (I mean decisively cross). It only happened three times since 2022, however, when they cross, the price moves very aggressively in one direction.
I think Solana is bullish fundamentally. I am not suggesting it is going to start the macro bear cycle. I am pointing out the price is still not showing a clear direction. From a technical analysis point of view, it might take some time before the trend forms. For now, it is only testing my patience!
SOLUSD

Solana SOL price analysis📞 Rumor has it that as soon as the global geopolitics reach a “temporary lull”, the following ETFs will be launched
Solana ETF is the most likely to be the next one (but there are at least 2 coins more on the list, which we will talk about in the coming days)
🪙 So, are you ready to buy CRYPTOCAP:SOL in your investment portfolio? For example, in the range of $117-123
🤖 Maybe we need to launch a long trading bot OKX:SOLUSDT so that it can buy in micro portions on the current possible price correction to get a “tasty price” as a result
◆ Would you like to join such a trading bot and copy them?
◆ And then compare the results with all “ETF candidates”
_____________________
Did you like our analysis? Leave a comment, like, and follow to get more

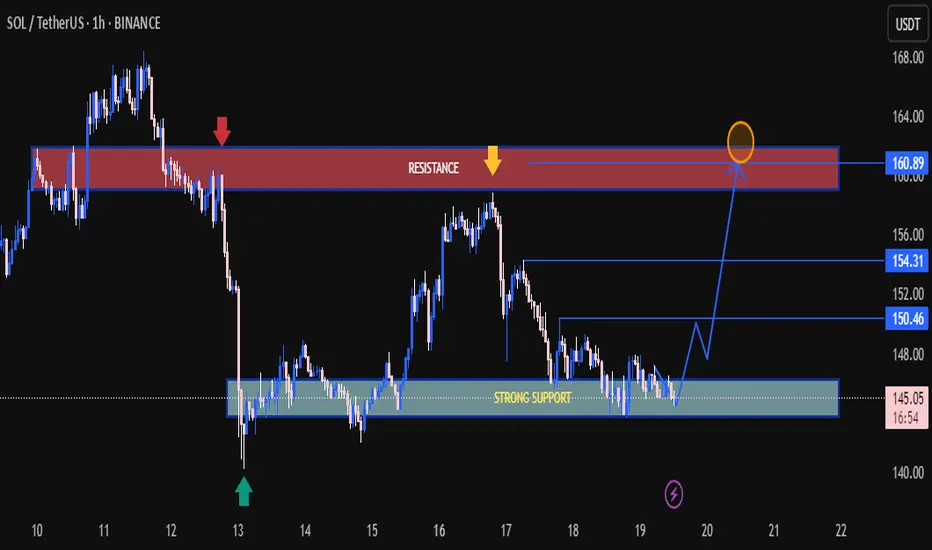
SOL/USDT 1H Chart Analysis – Bullish Reversal Targeting Resistan🚀 SOL/USDT 1H Chart Analysis – Bullish Reversal Targeting Resistance Zone 🎯
📊 Pair: SOL/USDT
🕐 Timeframe: 1H
📈 Platform: Binance
🔍 Technical Overview:
🔵 Support Zone (145.00 – 147.50 USDT)
Price has bounced multiple times from this strong demand zone marked in light blue.
Recent price action shows buyers defending this level aggressively — potential accumulation area. ✅
🔴 Resistance Zone (159.50 – 162.00 USDT)
Marked in red, this zone has historically rejected price twice (confirmed by red & yellow arrows).
Currently, the market is expected to retest this supply area once again. ⚠️
📈 Bullish Pathway:
Current structure suggests a reversal from support, aiming for:
TP1: $150.46
TP2: $154.31
TP3 / Final Target: $160.89 (within resistance)
🔄 Trend Structure:
Price is forming higher lows, hinting at early reversal stages.
Break above $150.46 would confirm bullish momentum. 🟢
🧠 Conclusion:
SOL/USDT is setting up for a bullish reversal from a strong support zone, with targets aligned toward previous resistance. Traders should monitor the reaction at $150.46 and $154.31 — a clean break may propel price to $160.89.
📌 Watch for:
Confirmation candle at support zone
Break and retest patterns on intraday resistance levels
📉 Support: 145.00 – 147.50
📈 Resistance: 159.50 – 162.00
🎯 Bullish Targets: 150.46 → 154.31 → 160.89
🔔 Stay updated, manage risk, and trade wisely! 💹📈
DeGRAM | SOLUSD channel floor launch toward 170+Solana continues to respect the broad rising channel that has guided price since early April. Recent corrective action tagged the channel median and then the intersecting 137-140 horizontal support, forming a classic confluence floor. The reaction: a sharp bullish rejection that restored price above the magenta internal trendline, indicating buyers remain in firm control. The corrective structure itself resembles a descending wedge losing bearish momentum, while RSI prints a positive reversal at 40 – conditions that often precede explosive upside resolution. A decisive close over 150 triggers an upside breakout aiming first at 160 (wedge objective) and subsequently at the 172-175 resistance block where prior distribution occurred. Should momentum spill over, the upper channel trajectory extrapolates 185-190 in coming weeks. Bullish bias is intact while candles close above 137; deeper dips into that zone likely represent opportunity rather than weakness.

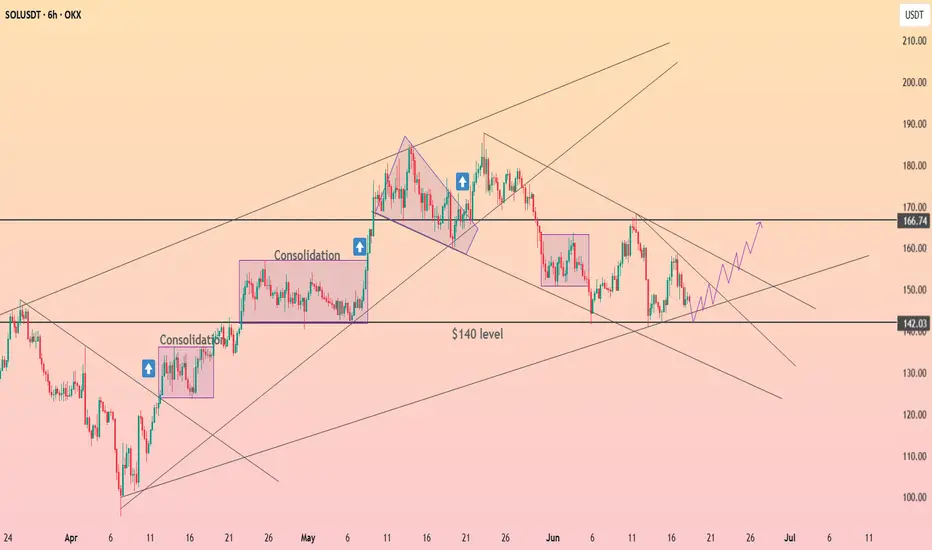
HolderStat┆SOLUSD accumulation before growthOKX:SOLUSDT respects the $140 axis and tests the roof of its falling channel. Holding that shelf lets bulls aim for 160-170 and keeps the broader up-channel alive; a dip under 135 would postpone the rally but not derail the long-term trend ⚡️
Short on SOL Here is a short idea on SOLUSDT perpetual contract on Binance.
I also include my overall analysis. I hope you find this useful.
Thank you!
- R2F Trading

HolderStat┆SOLUSD successfully retested the supportBYBIT:SOLUSDT is springing off the 148 mid-channel rail inside a descending-flag bust, shifting retrace into rally restart. Protecting the trend-line keeps bulls in control; clearing 158 opens 172-180 pursuit 🌞

#SOL/USDT#SOL
The price is moving within a descending channel on the 1-hour frame, adhering well to it, and is heading for a strong breakout and retest.
We are experiencing a rebound from the lower boundary of the descending channel. This support is at 149.
We are experiencing a downtrend on the RSI indicator, which is about to break and retest, supporting the upward trend.
We are heading for stability above the 100 moving average.
Entry price: 153
First target: 155
Second target: 159
Third target: 162

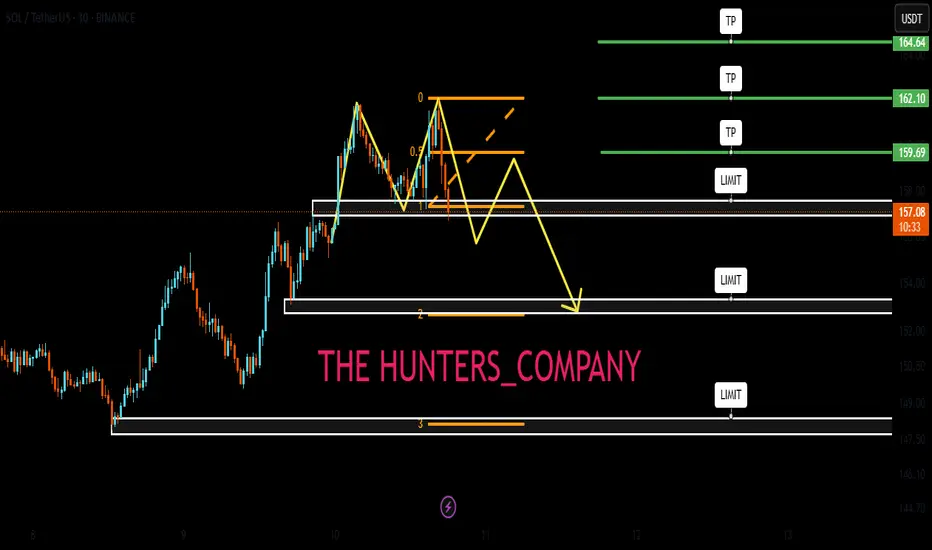
SOL/USDT at Key Inflection Point – Breakout or Rejection? Part 2Solana (SOL) is trading at a pivotal zone where price structure, harmonic patterns, and key technical indicators converge. This setup outlines three potential scenarios, guided by Fibonacci levels, auto trendlines, and momentum indicators.
Green Scenario (Confirmed Bullish Continuation)
A sustained hold above $155, especially if followed by a breakout through $156.50 with rising volume, would confirm the green path. This scenario reflects short-term bullish momentum strengthening, as RSI remains near 60 and PVT continues to climb. If confirmed, price may extend toward $160, with secondary targets in the $165–$172 range, aligning with the upper ascending trendline and harmonic extension.
Orange Scenario (Sideways-to-Bullish Consolidation)
This scenario becomes increasingly likely if SOL remains range-bound between $153.50 and $157.80. This consolidation zone overlays the 50–61.8% Fibonacci levels, Bollinger Band basis, and several key trendline intersections. With RSI holding in the 55–65 range and PVT stable, this setup would favor re-accumulation before another breakout attempt. Price action above $155 continues to support this scenario as the base case.
Red Scenario (Bearish Breakdown)
A breakdown below $153.50, especially if followed by a breach of $150 on high sell volume, would invalidate the bullish thesis. This scenario opens downside risk toward $147.35 and potentially $144.00–$140.00. RSI would likely drop below 50, and a flattening or declining PVT would confirm distribution. This path aligns with the broader red trendline and would indicate a rejection of the recent bullish breakout.
Indicators Used:
Bollinger Bands (BB 20, 2)
Relative Strength Index (RSI 14) with moving average overlay
Price Volume Trend (PVT)
Auto-generated trendlines
Harmonic Patterns (ABCD and XABCD)
Fibonacci Retracement and extension levels
Bias:
Short-term bullish if price holds above $155. Market structure, RSI, and PVT favor upward continuation or consolidation. A break below $153.50 would shift the bias toward neutral or bearish.
Strategy Outline:
Bullish if price breaks and holds above $156.50
Targets: $160 / $165 / $172
Bearish if price breaks below $150.00
Targets: $147.35 / $144.00 / $140.00
Scalping opportunity in the $153.50–$157.80 zone while awaiting directional confirmation
**This analysis is for informational and educational purposes only and does not constitute financial or investment advice. Trading cryptocurrencies involves significant risk and may not be suitable for all investors. Always conduct your own research and consult with a licensed financial advisor before making trading decisions. The author is not responsible for any losses incurred from reliance on this analysis.**

#SOL/USDT#SOL
The price is moving within a descending channel on the 1-hour frame, adhering well to it, and is heading for a strong breakout and retest.
We are experiencing a rebound from the lower boundary of the descending channel. This support is at 142.
We are experiencing a downtrend on the RSI indicator, which is about to break and retest, supporting the upward trend.
We are heading for stability above the 100 moving average.
Entry price: 144
First target: 149
Second target: 153
Third target: 157

SOLUSDT | The Final Liquidity Hunt | $250 is the Next StopSOLUSDT is currently in an uptrend after recently breaking out of its extended downtrend to $95 which took out millions of long positions. Now, we are seeing yet another extended downtrend on the lower time frame, but the overall direction is still up.
Last week, price action printed two very bullish pinbars at the $155 level which could have been considered support, where price was consolidating around late April. High leverage traders entered here and eventually got liquidated last Friday.
Following the liquidity hunt, price reversed quickly, but not strong enough to reclaim the $155 zone. Many of those who were liquidated likely re-entered on this fast move, thinking that the liquidity hunt is over and price cannot move lower.
I am anticipating one FINAL move down to $140 before the uptrend resumes. This will be the move that takes out the dumb money and where smart money will take their positions. The alternative is that the liquidity hunt never happens, and price breaks out of the falling wedge to resume its uptrend.
What about macro and micro factors?
⚖️ Ripple vs SEC Case
On 8th May, both parties agreed to settle, which ignited a massive market-wide rally. Unfortunately, their filings were rejected due to a procedural issue. The next deadline for refiling is on 16th June. Once accepted, we can expect another massive rally.
🤝 US-China Trade Talks
This week, US and China will meet at the negotiation table again. On 12th May, US & China reached a deal in Geneva and sent markets on another rally. IF (big if) they come to another deal this time, we can expect another rally.
✂️ Fed Rate Cut Expectations
The Fed talked about cutting interest rates in late 2025. They are currently in a "wait and see" stance however, due to uncertainties. Eventually we will see a rate cut, and I believe this would be a "buy the rumor, sell the news" event. Markets will price in the anticipated rate cut before it happens later this year.
Our first price target is $250.

#SOL/USDT#SOL
The price is moving within a descending channel on the 1-hour frame and is expected to break and continue upward.
We have a trend to stabilize above the 100 moving average once again.
We have a downtrend on the RSI indicator that supports the upward move by breaking it upward.
We have a support area at the lower limit of the channel at 148, acting as strong support from which the price can rebound.
Entry price: 153
First target: 156
Second target: 159
Third target: 162

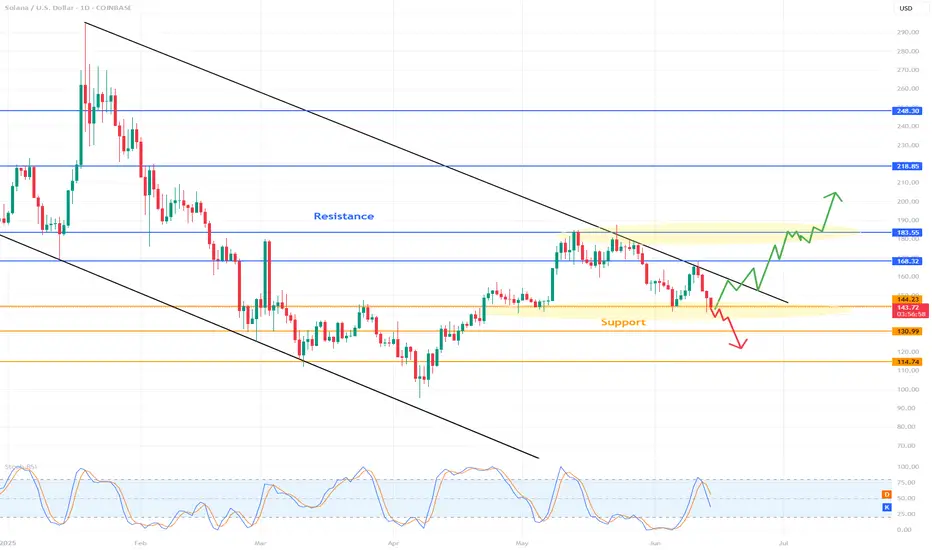
SOLUSD 1D Chart Review1. Main Trend
Downward Channel: Price moving in wide, downward channels (black trend lines), which means that the medium and long term remains bearish.
The upper trend line is a strong dynamic resistance, the lower one – support.
2. Key Horizontal
Resistance (Resistance):
$168.32: Strong resistance level, which it has responded to many times in the past.
$183.55: Another important resistance, confirmed by historical highs.
$218.85: Further resistance with an interval obligation.
$248.30: Very strong, long-term resistance (far from the current price for now).
Support (Support):
$144.23: actually occurs close to this support – very level.
$130.99: Another potential level where price could look for a rebound.
$114.74: Strong support, last bastion of bulls near March/April low.
3. Price action (Price action)
Last candles emitted pullback from downtrend line and down to support area of $144.23.
that any attempt to grow above trend line is limited by sellers.
$144.23 level currently existing short-term support - its loss may be available in case of $131 or possibly existing.
4. Indicator
Stochastic RSI (at the bottom of the chart):
Stochastic RSI indicator stated that airlines (blue and orange) were in power (overbought) in recent devices, but suddenly started to turn down.
Currently occurs in neutral zone, however application of protection (oversold). In case of threat occurrence now, it may suggest risk of attack, but it is not yet decided.
It is worth noting whether to go to the area of 20 and start turning back - in case of a necessary necessity.
5. Scenarios for the days
Bullish (growth):
Maintaining support at 144.23 USD and hitting the downtrend line (around 160-165 USD).
Breaking the trend line and resistance at 168.32 USD will give a signal to load in the area of 183-218 USD, but for the tenth time it seems to be less important, attention given the market structure.
Bearish (fall):
Breaking support at 144.23 USD and closing below on the daily candle - the next target to 131 USD, and then 114 USD.
The downtrend channel is still working against the bulls.
6. Summary
Main trend: downtrend.
Price: Close to support, but the risk of you leaving a big one.
Key horizontals: $144.23 (short-term support), $168.32 (main resistance).
Stochastic RSI: Heading towards oversold zone, but not yet giving a clear conclusion about a breakout.
Recommendation: Observe the application of price at $144.23 and the behavior of Stochastic RSI. In case of a breakout - it is possible that they will occur.
Solana - Your chance to be a millionaireThere is a 50/50 chance that we have topped...
The wave structure is very indicative of a completed impulse. However, i'm betting that we are just in a complex wave 4 and if this is the case, we should see a wave 5 taking out the high.
The risk to reward is pretty nice and playing spot will pay off.

HolderStat┆SOLUSD exit from the formationBINANCE:SOLUSDT
→ Bounce off 150 trend-line fuels channel grind
↳ Reclaim 163–165 then pierce 180 cup-rim
⇢ Targets 190–195 upper rail, even 205+
⤴ Slip < 157 reroutes to 150 demand, < 148 turns bearish
MY ANALYSIS IS HITTING THE TARGET! WHAT A CATCHING VIEW!🎯🔥 MY ANALYSIS IS HITTING THE TARGET! WHAT A CATCHING VIEW! 🔥🎯
✨📈 Everything is playing out as I expected – let’s keep riding this wave! 🌊💹
🚀 SOL/USDT Analysis Update 🚀
📅 Date: June 11, 2025
📊 Timeframe: 4H
✅ Key Zones & Levels:
🟢 Support Level Zone: 144.00 – 147.24
🔴 Resistance Level Zone: 184.00 – 187.99
⚠️ Mini Support/Resistance: Around 160.00
🎯 Current Price Action:
The price has respected my previously marked Support Zone (🟢), resulting in a strong rebound. After forming a bottom at the support level (marked with green arrows), SOL/USDT is now on an impressive upward move.
🟡 The current upward momentum is targeting the Resistance Level Zone near 187.99.
💡 Expected Movement:
If the price approaches the Resistance Zone (🔴), a reversal may occur, creating a potential short-term sell opportunity. Conversely, if it breaks above, we might see further bullish momentum.
🟦 Potential Path:
🔁 Expect a retest of the resistance zone → Possible rejection → Revisit the mini support (~160.00) before a decisive move either back to support or a breakout above 187.99.
💪 Key Takeaways:
Support Zone held strongly, confirming my analysis.
Mini Support/Resistance acts as a pivot for short-term reactions.
Watch closely as the price nears the Resistance Zone – this will be a key area for possible reversals or breakouts.
🔥 Let’s keep an eye on the next moves! Your feedback and thoughts are always welcome. Happy trading! 💪📈

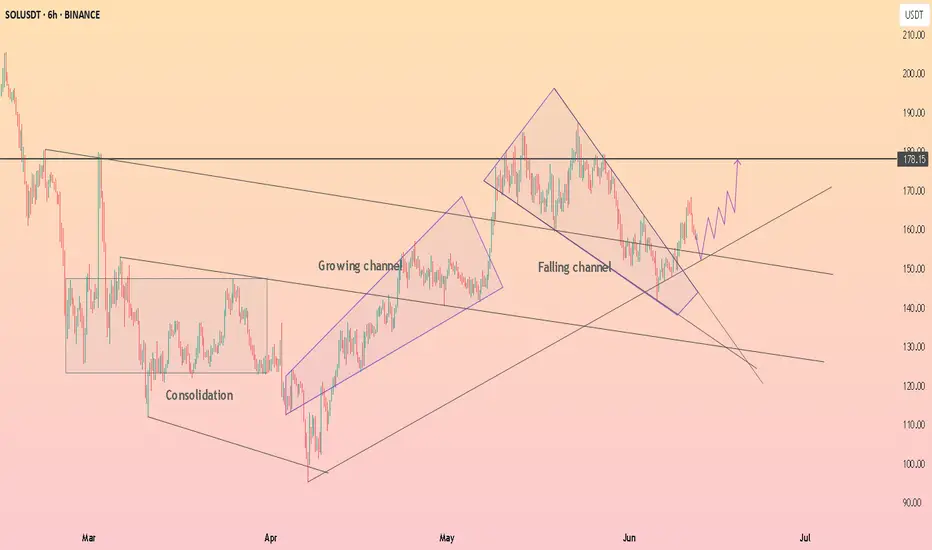
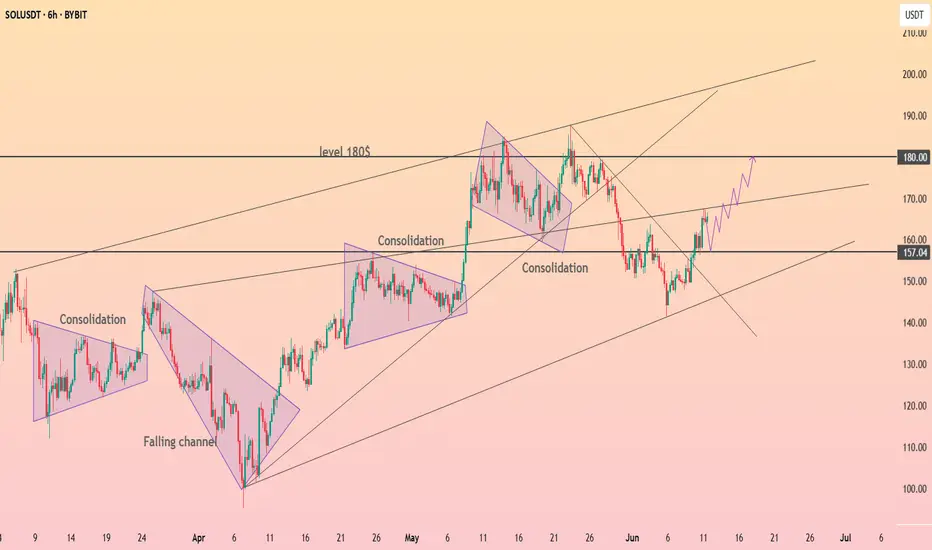
HolderStat┆SOLUSD reached resistance lineCRYPTOCAP:SOL just flipped the 157 pivot into support after escaping a falling channel and retesting the up-trend. Holding here fuels a run toward the 170 trend-cap and 180 supply shelf; failure invites 150 again. Growing channel, consolidation clusters, breakout watch.
Already ready to go longMy bias for Solana is super bullish. I invest in Solana and I think it is still a good price to buy and hold, but I am planning to trade with leverage.
Currently, Daily EMA200 is dead flat and running across the candles.
MACD moving to the upside but still in bear territory.
There is a bullish momentum building up, however, there is a large sell order block sitting above the current price area, and the price can oscillate around EMA200. The similar situation is marked in the blue rectangular box in the chart.
I will open a long position when:
1) EMA 21 >EMA55> EMA200
2) MACD lines cross and move in the bull territory.
3) a daily candle closes above EMA21. (see red vertical line)

Solana UpdateHello friends🙌
After the price growth we had, the price hit the resistance level of $160 twice and failed to break it, which caused a double top pattern to form, which if confirmed, there is a possibility of falling to the specified areas.😉
The specified areas are good prices for buying in steps, of course, with capital and risk management.✔
🔥Join us for more signals🔥
*Trade safely with us*
Red Lights for SOLANASolana has recently completed its 5-wave impulsive rise, and now a correction phase appears to be underway. Notably, a diamond top formation has formed and already broken to the downside, further supporting the short-term bearish outlook.
As long as SOL trades below the $180 resistance, this corrective scenario remains valid.
I currently do not expect a drop below the $146 support zone, making this a structured micro pullback within a larger bullish macro trend.
This setup offers opportunities for both short-term short and long entries, depending on how the price reacts near key levels. While the macro structure and fundamentals remain highly bullish for Solana, this correction could provide an ideal re-entry point before the next major leg up.
— Thanks for reading.

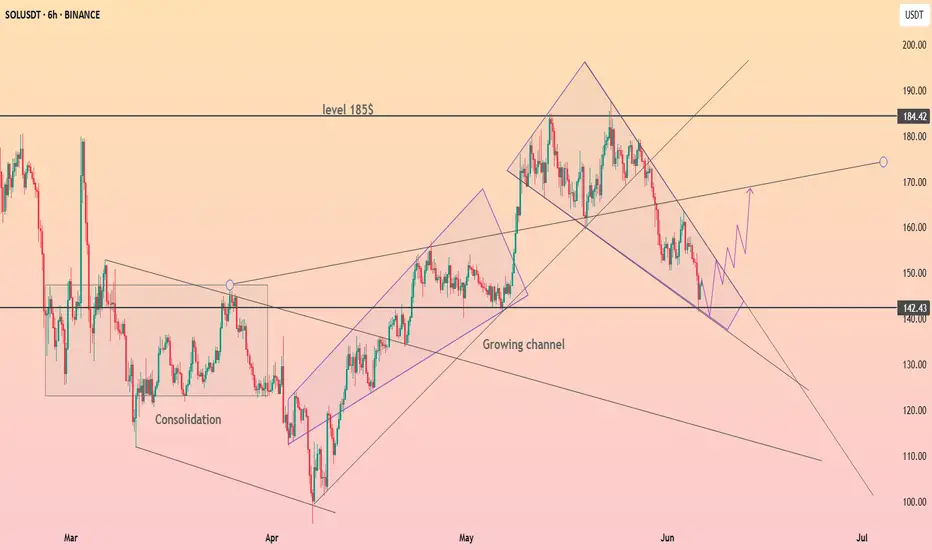
HolderStat┆SOLUSD rebound from 142CRYPTOCAP:SOL just kissed 142 support at the base of its growing channel. Solana price slips from a descending wedge, and holding above trend could propel bids toward 155, then the 170-184 supply band; lose the line and 125 beckons.
Is there hope for Solana?After a retest of support around $142, SOL is testing previous support as resistance around $152.
A strong break and retest of the $153 area could signal price reclaiming support and heading towards $166.
Failing to do so could lead to a retest and confirmation of $140 as support. Of course, losing support would signal further weakness towards $136 before a reversal potentially taking place.
As mentioned before, price is still trading below 1D 200MA, which could either be signaling weakness or the potential for more upside.
Considering the downward direction of the 1D 200MA could also be a bearish signal, however, this also usually happens before a reversal.

Solana >>> all trendlines are brokenHello guys!
As you can see, all of the trendline is broken, and after forming a double top in Solana, we can see a bearish trend is running!
I believe this downward movement will continue until the price touches the mentioned area!
The pointed area is the target level!
And the blue area has its own potential for getting long!
