#SOL/USDT Ready to take off upwards#SOL
The price is moving in a descending channel on the 1-hour frame and sticking to it well
We have a bounce from the lower limit of the descending channel, this support is at a price of 244
We have a downtrend, the RSI indicator is about to break, which supports the rise
We have a trend to stabilize above the moving average 100
Entry price 254
First target 261
Second target 269
Third target 278
SOLUSD

Why is SOLANA expected to reach $300 soon?Hello and greetings to all the crypto enthusiasts, ✌
In several of my previous analyses, I have accurately identified and hit all of the gain targets. In this analysis, I aim to provide you with a comprehensive overview of the future price potential for SOLANA, 📚💡
In addressing the query posed in the heading, Solana has demonstrated a consistent ability to outperform Ethereum in numerous key performance metrics over the past few months. This is further complemented by its highly proficient development team, which has implemented several strategic updates, positioning Solana at the forefront of blockchain technology with state-of-the-art innovations. 📚🎇
Given the project's robust fundamentals, a price target of $300, along with an anticipated 17% price appreciation, appears well within reach. 📚🐋
Moreover, the technical analysis corroborates this optimistic projection, reinforcing the likelihood of continued upward momentum. 📚✨
🧨 Our team's main opinion is Solana has outperformed Ethereum, backed by strategic updates, a strong development team, and solid fundamentals, with a $300 price target and 17% increase expected, supported by technical analysis. 🧨
Thank you for your attention. If you have any questions or comments, I’m here to respond to you. 🐋💡

SOLUSDT Market Structure Update👋Hello Traders,
Our 🖥️ AI system detected that there is an H1 or higher timeframe ICT Long setup in
SOLUSDT for session trade (a couple of Hours)
Here is a session trade idea (since it is near support surface, we should use small lot size)
Please refer to the details Stop loss, Buy Zone,open for take profit.
Next Long entry after retracement in any session.
For more ideas, you are welcome to visit our profile in tradingview.
Have a good day!
Please give this post a like if you like this kind of simple idea, your feedback will bring our signal to next better level, thanks for support!

SOLUSDT Bullish Flag PatternSOLUSDT Technical analysis update
SOLUSDT has been forming a bullish flag pattern over the last 230 days. The price is now moving toward the flag resistance line for a potential breakout. Once the breakout occurs, we can expect a price move of 50% to 150%. Additionally, the price is trading above the 100 and 200 EMA on the daily chart.
Buy level: After confirmation of the breakout from the flag pattern.

Solana to $750 - BUY & HODLSolana will not go bust, it's too big for that.
SOL ( SOLUSDT , SOLUSD , SOLBUSD ) has great value behind it.
The project is amazing, and it's on SALE!
So, I am holding and adding even more @ $5 .
Yeah... when people are panicking, I buy. :))))
My Technicals:
* Elliott Wave A-B-C Pattern
* Double Bottom
* Demand Zone
* Double Bottom
* Fibonacci Retracements
The Fibonacci Time Zones point me to a Bull Market Cycle starting with '23.
Good luck getting rich! :D

Solana (SOL) Price Technical Analysis - Nov, 2024Solana SOL, priced at currently ($256.83) picked up momentum after breaking out of $249 on Nov. 21st and hit a new all-time high above $264 on Nov. 22nd, breaking from the previous high from 2021.
The new all-time high is a bullish sign as it shows solid demand for the asset from the bulls. With no overhead resistance above the region now, a new high clears the path for further gains. If buyers maintain the price above $248, the SOL/USDT pair is likely to skyrocket to $300.

SOL looks bullish againsol seems to have completed a diametric correction as the g wave is dwarfed another bullish trend is expected to form.
By maintaining the green range, it can move towards the targets.
Closing a daily candle below the invalidation level will violate this analysis.
For risk management, please don't forget stop loss and capital management
When we reach the first target, save some profit and then change the stop to entry
Comment if you have any questions
Thank You

Solana (SOL): 430% Gain at 10x LeverageSolana (SOL) Trade Overview:
Solana (SOL) has delivered an incredible rally on the 4-hour timeframe. Using the Risological Swing Trader , the trade not only hit all predefined targets but exceeded expectations, achieving a 430% gain at 10x leverage.
Key Levels:
Entry Price: $175.68
Stop Loss (SL): $165.36
Take Profit Targets:
TP1: $188.45 ✅
TP2: $209.10 ✅
TP3: $229.75 ✅
TP4: $242.51 ✅
Analysis:
The Risological Lines perfectly highlighted a sustained bullish trend. Solana maintained its upward momentum, achieving rapid target hits. The Risological green lines provided a clear path for the trade's continuation, enabling traders to maximize their profits.
Outlook:
With all targets hit, Solana's trajectory remains strong. Traders may look for additional entries or secure profits as the bullish momentum shows no signs of slowing down. A well-executed trade like this emphasizes the power of Risological indicators for precision trading.

SOLUSDT: Bullish Momentum Building for a Potential All-Time HighSOLUSDT is demonstrating strong bullish potential after bouncing off a key support zone and breaking through a descending trendline. This breakout suggests a shift in momentum, indicating that we could see a significant upward movement in the near future. With the price gaining traction, traders should monitor the market for opportunities to enter positions as SOLUSDT approaches recent resistance levels.
To capitalize on this potential uptrend, consider placing entries on confirmed breakouts while managing risk with stop losses below the recent swing low. As bullish indicators align, the prospect of SOLUSDT reaching new all-time highs becomes increasingly likely. Stay vigilant, as this may be the beginning of an exciting phase for SOLUSDT traders!
SOLUSDT Currently trading at $146
Buy level: Above $146
Stop loss: Below $135
TP1: $152
TP2: $160
TP3: $175
TP4: $195
Max Leverage 3x
Follow Our Tradingview Account for More Technical Analysis Updates, | Like, Share and Comment Your thoughts

Understanding Solana: The Potential for Continued GrowthSolana's native cryptocurrency, SOL, has recently hit a new all-time high, sparking excitement and speculation among investors. This surge in price can be attributed to several factors, including the broader cryptocurrency market rally, increased institutional interest, and the growing popularity of Solana's blockchain network.
The Memecoin Mania Factor
One of the key drivers behind Solana's recent price surge has been the memecoin mania that has swept the cryptocurrency market. Solana has emerged as a popular platform for launching new memecoins, attracting significant trading volume and investor interest. The rapid growth of the memecoin ecosystem on Solana has led to increased demand for SOL, the network's native token.
Bitcoin's Influence
Bitcoin's recent price rally has also had a positive impact on Solana. As the dominant cryptocurrency, Bitcoin often sets the tone for the broader market. When Bitcoin's price rises, it tends to lift the prices of other cryptocurrencies, including Solana. This correlation between Bitcoin and Solana has contributed to SOL's recent upward momentum.
Increased Institutional Interest
Another factor driving Solana's price surge is the increasing interest from institutional investors. Many large financial institutions are now exploring opportunities in the cryptocurrency market, and Solana has emerged as a promising platform for building decentralized applications (dApps). Institutional investors' growing adoption of Solana could lead to further price appreciation in the long term.
Solana's Unique Value Proposition
Solana's unique value proposition, including its high throughput, low transaction fees, and fast block times, has attracted a significant developer community. The growing number of dApps being built on the Solana network has increased the demand for SOL, as it is used to pay transaction fees.
Potential Challenges and Risks
While Solana's future looks promising, it is important to acknowledge that the cryptocurrency market is highly volatile and subject to significant price swings. Several factors could potentially impact Solana's price, including regulatory uncertainty, network congestion, and competition from other blockchain platforms.
Additionally, the recent surge in Solana's price has raised concerns about the sustainability of its momentum. Some analysts believe that the current price levels may not be justified by the underlying fundamentals of the network. As such, investors should exercise caution and conduct thorough research before investing in Solana.
Conclusion
Solana's recent price surge has been impressive, but it is important to approach the future with a balanced perspective. While the long-term potential of Solana is significant, short-term price fluctuations are inevitable. Investors should focus on the underlying technology and the long-term growth prospects of the Solana ecosystem, rather than short-term price movements.
As Solana continues to attract developers, users, and institutional investors, it is likely to remain a major player in the cryptocurrency market. However, it is essential to manage risk and diversify investments to mitigate potential losses.
SOL / USD ConsolidationNeutral consolidation for a week heading into major economic data. Any sort of risk-on response from the overall market could lead to significant upside. However a breakdown could flush out a lot of bulls in quick fashion.
Upwards price targets of: 151, 158, 163, and 184+
Downwards price targets: 134, 110, 104

SOLANA ATH is near Hello and greetings to all the crypto enthusiasts, ✌
In several of my previous analyses, I have accurately identified and hit all of the gain targets. In this analysis, I aim to provide you with a comprehensive overview of the future price potential for SOLANA, 📚💣
The trading volume I am currently observing for this stock in the market is unparalleled compared to other coins or equities. This exceptional volume alone sets the stage for a potential explosive price movement toward significantly higher targets. 📚💡
Analyzing the chart, we have a primary scenario that features a period of temporary range-bound candles, underpinned by Fibonacci-based support levels. This setup clearly delineates the anticipated price trajectory in a simplified manner. 📚🙌
Should the primary scenario not hold, the price is expected to rebound upward from a lower Fibonacci indicator support level. 📚🎇
In essence, these support zones can be likened to invisible springs, poised to propel the price upward upon contact, reinforcing the upward momentum and potentially driving significant gains. 📚✌
🧨 Our team's main opinion is The exceptional trading volume in this stock suggests a potential explosive price surge, supported by Fibonacci levels that act like invisible springs, driving upward momentum. 🧨
Thank you for your attention. If you have any questions or comments, I’m here to respond to you. 🐋💡

#SOL/USDT Ready to go up#SOL
The price is moving in a descending channel on the 1-hour frame and sticking to it well
We have a bounce from the lower limit of the descending channel, this support is at a price of 230
We have a downtrend, the RSI indicator is about to break, which supports the rise
We have a trend to stabilize above the moving average 100
Entry price 236
First target 242
Second target 248
Third target 254

Bullish SOLUSDTThe market is very bullish right now and that applies to SOLUSDT
I think this coin can easily to to 1000+ as ETH did back in 2017
A newer but increasingly popular coin
The whole market will move from the current BTC fever to ETH then to SOL and other coins like this.
Daily timeframe

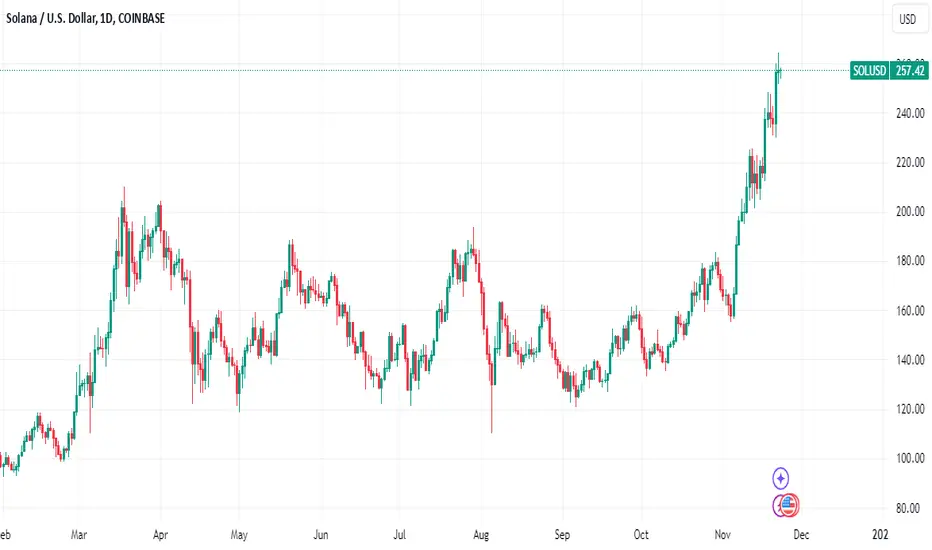
A close up of the solusd chartThe other version of this chart I posted was on the 1 month time frame so kinda zoomed out so I thought it would be fun to keep track of sol’s price action on the 1 day chart timeframe as well. I will link the 1 month version of the chart below. It’s currently steadily climbing its way to the first target. *not financial advice*

SOL/BTC is still bullishAfter a bullish wave, Solana has entered a range.
In this range, it has continuously created higher Ls and formed a bullish iCH.
This currency pair is ready to move towards the two specified targets.
Closing a daily candle below the invalidation level will violate this analysis.
Do not enter the position without capital management and stop setting
Comment if you have any questions
thank you

Solana's Rise: A Challenger to Ethereum's Throne?
Solana, the high-performance blockchain, has made significant strides in the cryptocurrency market, particularly against the long-standing Ethereum. With a 70% rally against Ethereum in 2024, Solana has positioned itself as a strong contender, despite its significantly lower market capitalization.
The Solana Advantage
Solana's ascent can be attributed to several key factors:
• High Throughput: Solana boasts impressive transaction speeds, capable of processing thousands of transactions per second. This is a significant advantage over Ethereum, which often faces scalability issues.
• Low Transaction Fees: Solana's low transaction fees make it an attractive option for users, especially for smaller transactions.
• Smart Contract Functionality: Solana supports smart contracts, enabling the development of decentralized applications (dApps) and other innovative projects.
The Dark Cloud Over Solana's Horizon
While Solana's performance has been impressive, concerns have emerged regarding the sustainability of its growth. A recent report revealed that a significant portion of Solana's record-breaking $318 billion transfer volume was driven by bots, rather than organic user activity. This raises questions about the true level of interest and adoption of the Solana network.
What Does This Mean for Solana's Future?
The revelation of bot-driven activity could have significant implications for Solana's future. If the network's growth is not supported by genuine user adoption, it may struggle to maintain its momentum. A decline in user interest could lead to a decrease in network activity and potentially a drop in the price of SOL.
The Impact on Your Crypto Holdings
As an investor, it's crucial to consider the potential impact of Solana's rise and the concerns surrounding its growth on your crypto portfolio. Here are a few things to keep in mind:
• Diversification: Diversifying your portfolio across multiple cryptocurrencies can help mitigate risks. Consider investing in a mix of established cryptocurrencies like Bitcoin and Ethereum, as well as promising altcoins like Solana.
• Due Diligence: Before investing in any cryptocurrency, conduct thorough research and analysis. Pay attention to factors such as the project's technology, team, community, and market sentiment.
• Risk Tolerance: Assess your risk tolerance and invest accordingly. If you're comfortable with higher risk, you may consider investing in Solana. However, if you prefer a more conservative approach, it may be wise to stick with more established cryptocurrencies.
• Stay Informed: Keep up-to-date with the latest news and developments in the cryptocurrency market. Follow reputable news sources and analysts to stay informed about potential risks and opportunities.
Conclusion
Solana's rapid rise has captured the attention of the cryptocurrency community. However, it's essential to approach this emerging blockchain with a critical eye. While its technology and performance are impressive, the concerns surrounding its growth and the potential impact of bot-driven activity cannot be ignored. As an investor, it's crucial to make informed decisions and carefully consider the risks and rewards before investing in Solana or any other cryptocurrency.
Disclaimer: This article is for informational purposes only and should not be construed as financial advice. Please consult with a qualified financial advisor before making any investment decisions.1

Solana Soars Close to Record: What Could Drive Prices in 2025?Crypto markets are betting big on Solana — the Ethereum rival pressed higher even as the broader digital-asset market pulled back last week. Now Solana needs a few stars to align so it could rocket to a fresh all-time high, surpassing its 2021 record of $260. And by the common consensus, record territory could be a few sessions away while a fuller, hulking dominance could be on the cards for 2025.
Solana SOLUSD is on a roll. Early on Tuesday, Solana neared its record high of $260 set back in 2021 when crypto bros were going all in on their favorite coins (birthing some meme coins in the process.)
The Solana token, which runs on the layer-1 blockchain of the same name, shot up to $245, staging a monster recovery from $8 a piece back in January 2023 when crypto markets were reeling from the fabulous implosion of Sam Bankman-Fried’s crypto exchange FTX and its sister company, trading house Alameda Research. (SBF was an early buyer of Solana, scooping it up for as low as 20 cents.)
Now Solana is no longer associated with the fallen crypto mogul who’s serving a 25-year prison sentence. Instead, the digital coin is running free and carving out its own reputation. And fast. Almost as fast as its ability to process transactions on the blockchain.
Solana is touted as a faster and cheaper alternative to Ethereum ETHUSD , the second-largest coin with a valuation of $375 billion. That’s some $260 billion more than Solana’s own market cap of about $115 billion.
Still, Solana’s gains outshine these of Ethereum:
Solana year-to-date gains: 142%
Ethereum year-to-date gains: 40%
Bitcoin year-to-date gains: 107%
Solana’s performance hinges on three very different sets of circumstances:
Its ability to handle the technical workload as a payment processor
Its infrastructure capacity for building up various projects
Its appeal as an investment asset (or why you’re here)
On the first one — payment processor — Solana boasts lightning-fast transactions to the tune of 50,000 per second. Ethereum? That’s about 15 to 45 transactions per second. Visa? A wide range between 1,500 and 65,000 (depends who you’re asking.) And Bitcoin gets you about 2 to 7 transactions per second (but no one really cares about this.)
With breakneck speed, Solana is shaping up as a worthy opponent to traditional payment processors, flexing high volumes in a decentralized environment.
On the second one — building grounds for projects — Solana is considered the go-to place to launch meme tokens based on dogs, cats and even politicians and business people. It has been handling these pretty well, considering the massive influx of dog-themed and Elon Musk-themed tokens.
On the third one — investing and trading — Solana is staring into exciting prospects for 2025. The cryptocurrency might get its own US spot exchange-traded fund soon and traders are buzzing from excitement. A Solana-based spot ETF could be a reality as soon as 2025 (most likely after Securities and Exchange Commission boss Gary Gensler gets fired.) Only two other cryptocurrencies have been granted permission to strut down the traditional ETF pathway — eleven Bitcoin ETFs and nine Ethereum ETFs .
Now that Donald Trump has secured another four years in the White House, the crypto industry expects big things to come its way.
The President-elect has embraced digital assets and even announced his own crypto gig — a Bitcoin strategic reserve . Which was shortly after complemented by the cost-cutting DOGE department led by Elon Musk.
All in all, Washington is expected to be super friendly to crypto, especially after large industry players such as Andreessen Horowitz and Coinbase spent $135 million backing more than 50 Congress candidates, most of them winning seats.
Where do you think Solana is heading next? Do you see lots of bullish momentum going into 2025? Or maybe you’re more inclined to believe it’ll come crashing down? Let us know your thoughts in the comments below!

Analyzing Solana's Bullish Surge: Is a $250 Rally on the Horizon
Solana (SOL), the high-performance blockchain platform, has recently embarked on a significant upward trajectory, surpassing the $220 resistance level. As the cryptocurrency market continues to exhibit bullish momentum, Solana's price action suggests a potential rally to the $250 mark.
Key Factors Driving Solana's Rise
Several key factors are contributing to Solana's bullish sentiment:
1. Enhanced Network Performance:
o Solana's robust network infrastructure, capable of processing thousands of transactions per second, has attracted developers and users alike.
o Recent upgrades and optimizations have further improved network performance, reducing transaction fees and latency.
2. Growing DeFi Ecosystem:
o Solana's DeFi ecosystem has witnessed substantial growth, with a diverse range of decentralized applications (dApps) emerging.
o Projects like Serum, Raydium, and Orca have gained significant traction, driving demand for SOL tokens.
3. Institutional Adoption:
o Institutional investors are increasingly recognizing the potential of Solana as a scalable and efficient blockchain platform.
o This growing institutional interest could lead to increased capital inflows and price appreciation.
4. Positive Market Sentiment:
o The broader cryptocurrency market has been experiencing a period of bullish sentiment, with Bitcoin and Ethereum leading the charge.
o This positive market sentiment has spilled over to altcoins like Solana, fueling its upward momentum.
Technical Analysis: A Bullish Outlook
From a technical perspective, Solana's price chart exhibits a bullish outlook:
• Breakout Above $220: The recent breakout above the $220 resistance level is a significant bullish signal, indicating a potential shift in market sentiment.
• Consolidation Phase: Solana's price is currently consolidating gains, which could be a precursor to a more substantial upward move.
• Target Price of $250: The next major resistance level for Solana lies at $250. A successful break above this level could trigger a further rally.
• Bullish Indicators: Technical indicators such as the Relative Strength Index (RSI) and Moving Average Convergence Divergence (MACD) are signaling1 bullish momentum.
Potential Risks and Challenges
While Solana's future looks promising, it's important to acknowledge potential risks and challenges:
• Network Congestion: As Solana's popularity grows, network congestion could become a concern, leading to increased transaction fees and slower processing times.
• Regulatory Uncertainty: Regulatory uncertainty surrounding cryptocurrencies could impact Solana's price and adoption.
• Market Volatility: The cryptocurrency market is inherently volatile, and sudden price swings can occur without warning.
Conclusion
Solana's strong fundamentals, growing ecosystem, and positive market sentiment have positioned it for a potential rally to $250 and beyond. However, investors should exercise caution and conduct thorough research before making investment decisions. As with any investment, it's crucial to diversify your portfolio and manage risk effectively.
Disclaimer: This article is for informational purposes only and should not be construed as financial advice. It's important to consult with a qualified financial advisor2 before making any investment decisions.

#SOL 4H. Road to $300. Analysis from 11/19/24For Solana, I'm expecting continued growth through intermediate flat corrections.
At the moment, I anticipate the price will continue its upward movement and reach higher levels. My nearest targets (including spot):
1 - $260
2 - $300
3 - $350
4 - $400
Growth of Solana = growth of its ecosystem.

SOL the Ethereum KillerIf ETH and SOL continues 1 more year following this red arrow... SOL has overtaken ETH and will be coin nr 2. ( isnt it sort of already ? )
im not really saying its going to happen this bullrun, but .. can it ?
details of how this chart is made:
ETH/SOL ( market caps )
and chart is inverted upside down

Is Solana (SOL) Poised to Reach $400 with Upcoming Breakout?
Solana, the high-performance blockchain platform, has been making significant strides in the cryptocurrency market. Recent data and technical analysis suggest that SOL is poised for a significant price surge, with the potential to reach $400.
Key Factors Driving Solana's Potential Breakout:
1. Network Upgrades and Scalability:
o Solana has been actively working on network upgrades and scalability solutions to address the challenges faced by other blockchain platforms.
o Recent improvements have significantly enhanced the network's capacity and transaction speed, making it more efficient and user-friendly.
o These advancements are likely to attract more developers and users to the Solana ecosystem, driving increased demand for SOL tokens.
2. Growing DeFi Ecosystem:
o Solana's DeFi ecosystem has witnessed rapid growth, with a diverse range of decentralized applications (dApps) being built on the platform.
o These dApps span various sectors, including finance, gaming, and NFTs, attracting a growing user base.
o As the DeFi ecosystem continues to expand, the demand for SOL tokens is likely to increase, as they are used for fees and staking.
3. Strong Community Support:
o Solana has a dedicated and passionate community of developers, investors, and users.
o This strong community support plays a crucial role in driving the adoption and growth of the Solana ecosystem.
o Community-driven initiatives and projects contribute to the overall development and success of the platform.
4. Positive Market Sentiment:
o The broader cryptocurrency market has been experiencing a positive sentiment, with Bitcoin and Ethereum leading the charge.
o This positive market sentiment can spill over to other cryptocurrencies, including Solana.
o As investor confidence in the cryptocurrency market grows, more capital may flow into Solana, driving up the price of SOL tokens.
Technical Analysis: A Bullish Outlook
Technical analysis of SOL's price chart reveals a bullish outlook. The token has formed a solid support level and is showing signs of breaking out of a consolidation phase. Key technical indicators, such as the Relative Strength Index (RSI) and Moving Average Convergence Divergence (MACD), are also indicating bullish momentum.
If Solana successfully breaks through the current resistance level, it could trigger a significant price surge. The next major price target for SOL is $400, which could be achieved in the near future.
Potential Risks and Challenges:
While Solana's future looks promising, it is important to acknowledge potential risks and challenges:
• Network Congestion: As the network grows, it may face scalability issues, leading to increased transaction fees and slower processing times.
• Regulatory Uncertainty: Changes in regulatory policies can impact the cryptocurrency market, including Solana.
• Market Volatility: The cryptocurrency market is highly volatile, and sudden price swings can occur.
Conclusion:
Solana's strong fundamentals, coupled with positive market sentiment and technical analysis, suggest a bullish outlook for the token. The potential for significant price appreciation, coupled with the growing adoption of the Solana ecosystem, makes it an attractive investment opportunity for both short-term traders and long-term investors. However, as with any investment, it is crucial to conduct thorough research and consider consulting with a financial advisor before making any investment decisions.

Gigachad is about to giga sendMurads top 2 picks, SPX6900 and Giga have been shitting the bed the past 2 weeks while BTC, Raydium, SUI and the entire solana ecosystem rip.
Got a feeling.. GIGA and SPX6900 are about to melt faces.. Murad isn't wrong.
He's having his Michael Burry moment..
All of a sudden Alex Becker has shifted from shilling 40m mcap game coins to posting Giga Chad memes..
There is a flood coming.. position accordingly.
