SOL Eyeing a Major Breakout - Potential for Explosive Growth#SOL/USDT #Analysis
Description
---------------------------------------------------------------
+ SOL is trading around $141.77, with the 21 EMA ($155.22) and 55 EMA ($144.13) in close proximity, which could serve as support and resistance levels, respectively. The 100 EMA is further down at $123. If SOL breaks above this resistance zone, it could signal the start of a new uptrend.
+ The primary resistance zones are around $165 to $205, with a potential breakout target toward the $920 leve
+ The RSI is currently neutral around 50, indicating that SOL is neither overbought nor oversold. This suggests room for further upward momentum if buyers step in.
---------------------------------------------------------------
VectorAlgo Trade Details
------------------------------
Entry Price: 142
Stop Loss: 112
------------------------------
Target 1: 172
Target 2: 200
Target 3: 251
Target 4: 400
Target 5: 700
Target 6: 900
------------------------------
Timeframe: 3D
Capital Risk: 1-2% of trading amount
Leverage: 5-10x
---------------------------------------------------------------
Enhance, Trade, Grow
---------------------------------------------------------------
Feel free to share your thoughts and insights.
Don't forget to like and follow us for more trading ideas and discussions.
Best Regards,
VectorAlgo
SOLUSD

SOL: Oversold TerritoryThe market sentiment for SOL is currently bearish, with technical indicators suggesting caution due to potential downside risks.
Key Factors Influencing SOL Price
MACD: The MACD is bearish, with the histogram at -0.93, MACD line at -9.31, and signal line at -8.38, indicating strong bearish momentum.
Stochastic Oscillator: With %K at 3.34 and %D at 6.16, the Stochastic Oscillator shows oversold conditions, suggesting a potential short-term rebound.
RSI: The RSI at 25.69 indicates that SOL is in oversold territory, which could signal a potential reversal or consolidation.
Price Trends and Resistance Levels:
Local Resistance: Found at $151.45, a key level to watch for a potential breakout.
Solid Resistance: Found at $171.21, which, if breached, could signal a strong upward trend.
Local Support: Found at $135.05, which could act as a support level in case of a pullback.
Dynamic Resistance: Aligns with the upper trendline, providing additional resistance around $151.45.
Potential Market Scenarios
Bullish Scenario:
A break above the local resistance at $151.45 could lead to further upward movement, potentially targeting the solid resistance at $171.21. This move would likely confirm bullish momentum and attract more buyers.
Bearish Scenario:
If SOL fails to break above the local resistance, it could retest the support levels at $135.05 and potentially fall to the solid support level at $121.00. A break below $121.00 could signal further declines, with dynamic support suggesting lower targets.
Conclusion and Market Outlook
SOL is currently positioned with significant support and resistance levels to watch. The bearish MACD and overall market activity suggest caution, as the potential for further declines exists. Monitoring the key resistance levels and potential support levels is crucial for making informed trading decisions.

SOL/USDT 4H Bearish Momentum-Oversold Conditions - What’s Next?The chart shows a clear downtrend in the recent period, with the price dropping from around $185 to $141.22.
Lower Highs and Lower Lows: The formation of lower highs and lower lows is evident, indicating a bearish market sentiment. current price is around $141.22, which is a significant drop from recent highs.
Resistance Levels:
Immediate resistance at around $160, where the price recently faced rejection.
Stronger resistance at around $180, the recent high before the downtrend began.
Support Levels:
Immediate support is observed at around $140.
Further support at $120 and $100 if the price continues to decline.
RSI:
Current RSI Value: The RSI is at 26.64, indicating that the asset is in oversold territory.
Historical RSI Movements: The RSI has dipped below 30 multiple times, suggesting periods of oversold conditions that could lead to a potential reversal or consolidation.
Patterns and Indicators
A potential bearish flag pattern can be identified, suggesting a continuation of the downtrend if the support at $140 is broken.
Bottom Line:
The SOL/USDT 4H indicates a strong bearish trend with the price consistently making lower highs and lower lows. The RSI suggests that the asset is currently oversold, which could indicate a potential for a short-term bounce or consolidation. the bearish flag pattern and the overall trend suggest caution, as further declines are possible if the support at $140 is broken. Traders should watch for confirmation of a reversal or a break of support before making any trading decisions.

Strong possibility of an upward movementSolana is in the $142 to $146 range, recognized as an important support level. This range acts as a key point to prevent further price declines and initiate an upward movement.
Upward Potential:
If the price is supported and stabilized in the $142 to $146 range, there is a strong possibility of an upward movement. The price targets for this upward movement are in the $160 to $170 range.

SOLANA/USD Bearish in a bullish Consolidation:War+RecessionAs the Russians and Ukr. are facing to end the war,another war, in the middle east is starting:Irand vs Israel As well strategically as economically and politicially this zone of our planet is ruling all economies around the world:Oil,Gas,International trades and very important strategical zones:The survival of the world is dependent on the middle east.The middle east is the heart and ouls of the world.
Also the very negative NFP last Friday confirming that recission will come.And All this factors will increase the pain and suffer of the stock markets,FOREX and ofcourse Crypto currencies.
As Solana is now for many months in a big consolidation range we can use this situations to generate profitable situations with high probabilities:The markets tend to consolidate 70% of times. The probability the we will have an uptrend is 15%,and bear trend also 15%.So why not to use the 70% probabilitiy?
As the trend is currently long,meaning the ranges are stepping higher, the dangerouse zone for the bulls is the,,negative CRV Target,,,in green colour!
There the Bulls will face the increased risk,to add postions, or the profit portential of holding long trades is nealy zero,becuaz the bears take control.
This stage is high potential Short entry for the bears,but also taking profit area optimally for the bulls.
As we can see eachtime the market met this zone, many false breakouts (white circles) have been generated, the bears started to ride down the trend to ,,Target Negative CRV,,,in ORANGE: There the bears closed their positions and took profits,or also the bulls who hedged their positions short at around 190-205 clsoedtheir hedge positions and added more long positions at around 117-124.
The current stage of the market ,Close below FBA,, is where we are right now. The bears still in control,the market closed below that zone and opened immediately lower.The probabiliy that the bears will force solana to 120 zone is increasing.
Remember we are bearish in a bullish trend!
Where do the bulls lose total control?
This will happen,if the market closes 3Days in row below 117,and a bullish impulse or pullback to 117 or above 117 will not be successfull:That means if the bear immediately react and send down Solana forcefully below 117.This is ultimate confirmation that Bearish trend has started and Solana will fall very deep.
If the impulse overcomes 117 and continues above 125+Close,then Solana will go back to 190-208 area again.As long as Solana can saty above 180.85 Solana will try to break above this range.Once it falls back, the game repeats

SOL down to $100 before bouncing backBefore the end of the year, it will make new highs. However,
For now, a buying opportunity will come: around $90-100.

$SOL primed for relaunchCRYPTOCAP:SOL has been hot as of lately and the crypto sector seems to be bullish overall. We have a nice breakout here on the daily timeframe and as we zoom in on the price action we can see that its a perfect retest for the next leg up! I think this has a good and i mean GOOD chance of seeing $200 very soon.

SOLUSD Bullish due to US Elections 2024The US Presidential elections is theonly catalyst that is currently driving crypto.
Green arrows: A pullback retrace can meet this areas(green arrow) to enter long or increase bullish positions.
First target: 210
A break above 210 can lead SOLUSD to 256
Yellow horizontal lines: Main supports with highest volume
The current breakout is valid,becuz the RSI dropped immediately and leaft oversold area

Solana Breaks Inverse H&S Neckline & Clears TriangleTraders,
Multiple indicators show Solana on the way to final target now of $230-250. My followers were given a signal at $120-140 and should easily double their $$$.
We have an inverse h&s pattern inside a bullish triangle. Additionally, a double bottom pattern forms the right shoulder. This all shows us clearly that it will be hard to stop Solana.
We have a little resistance rn and may retest the top side of our triangle, but in less than a week I anticipate further price action to the upside as we continue to smash through levels like we're karate chopping balsa wood.
Best,
Stew

#SOL/USDT#SOL
The price is moving within a descending channel pattern on the 1-hour frame and is expected to rise after it has been largely committed to it
We have a downtrend on the RSI indicator that is expected to break upwards and we have a trend to stabilize above it
We have a major support level in green at a price of 165.40
We have a trend to stabilize above the 100 moving average
Entry price 168.74
First target 173.74
Second target 179.42
Third target 186.14

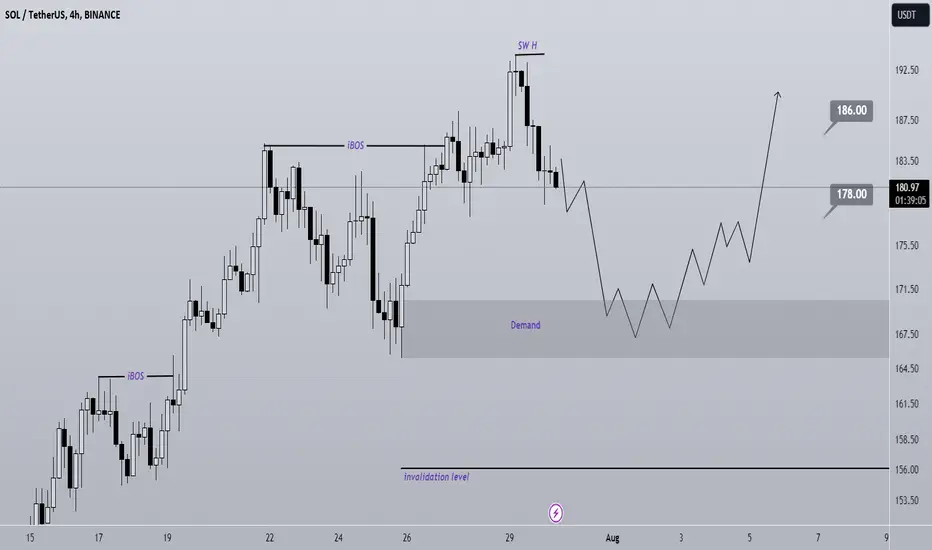
SOL buy setupThe structure of SOL is bullish and in this structure we are looking for positions aligned with the structure in the movement origins.
We have specified the support range as demand on the chart.
We are looking for buy/long positions on this range.
Closing a daily candle below the invalidation level will violate the analysis
Note that the financial market is risky, so:
Do not enter a position without setting a stop and capital management and confirmation and trigger.
When we reach the first TP, save some profit and try to move the stop continuously in the direction of your profit.
If you have any comments please post them, comments will help us improve our performance
Thanks
$SOLUSD's bull run = done until 2025, back to $50 or belowAs you can see from the chart, price has hit the top of the structure and has begun to reject off of it on the 2D timeframe. I think this is the start of a much larger move down for Solana.
I think it's likely that from here, Solana goes to test the $51 region at a minimum. If it can bounce there, then it's likely that it'll come back up to the top of the structure and break it.
However if it can't, then I think it's likely to continue down to the lower supports before bouncing and we'll see a longer accumulation before we see a breakout.
I lean towards altcoins going down/being in an accumulation phase until Jan - March 2025 then seeing a large move after that.
Once the structure breaks to the upside, initial target is $750.
Would be an amazing trade to accumulate at the lows should this play out.
Let's see what happens over the next 6-12 months and beyond.


SOL SHORT Building upAnalysis:
Market Structure Shift (MSS): Awaiting confirmation below 187.52 for entry trigger 🛑
Fair Value Gap (FVG): Identified on the 4H chart (shaded grey area) 📊
Price Action: Bearish momentum expected to continue 📉
🎯 Entry: Below 187.52 on confirmation
🛡️ Stop Loss: Above 194.00
🏆 Take Profit: Targeting 176.80 🎯
📅 Time Frame: 4H Chart ⏰
🔔 Trade Plan:
Wait for a close below 187.52 for entry confirmation.
Set stop loss above the resistance at 194.00 to protect against potential reversals.
Aim for the take profit target at 176.80, where significant support is expected.

Potential price reversal and renewed growthOn a 4-hour chart Solana has reached significant levels that could indicate potential price reversal and renewed growth.
Possible Reversal Zones:
One of the critical reversal zones for Solana is in the range of $169 to $177. This area acts as a strong support level and can potentially cause a price reversal. A price encounter with these levels is likely to lead to a renewed pump and a move towards 200.
Price Target:
In the event of a reversal and renewed price growth, the price target for this analysis is $200. This level acts as an important resistance, and reaching it would indicate a significant price increase for Solana.

SOL/USDT BUY ZONE BEFORE 200$Sol/usdt is looking below sell side liquidity. And we will target above 200$. Buying below sell side liquidity is second reason and first reason is breaker block in discount zone.

SOL Short building upSOL deviating about range high and indicating first signs of weakness.
Im pointing out a reversal trade and the potential confirmation we are looking for.

Solana Soars: Breakout and Futures Fuel RallySolana (SOL) has ignited a bullish flame, surging past a critical resistance level as investor appetite for risk intensifies. On Monday, the cryptocurrency's impressive performance comes amidst a broader market uptick, driven by anticipation for the Federal Reserve's interest rate decision and the release of key earnings reports.
The digital asset's ascent was marked by a decisive break above a key resistance point, a technical indicator often seen as bullish. This breakthrough suggests a potential shift in market sentiment, with investors becoming increasingly optimistic about Solana's prospects.
Adding fuel to the fire, Solana's futures open interest has been steadily climbing, nearing an all-time high. This metric, which represents the total number of outstanding futures contracts, is often interpreted as a measure of market interest and activity. The surge in open interest indicates growing investor engagement and potentially points to further price appreciation.
The broader cryptocurrency market has also experienced a resurgence, with a prevailing risk-on sentiment taking hold. As investors weigh the implications of potential monetary policy adjustments and corporate earnings, many opt to allocate capital to higher-risk assets like Solana.
While the recent rally is undoubtedly encouraging for Solana holders, it's essential to approach the market with caution. Cryptocurrencies are inherently volatile, and price fluctuations can be rapid and unpredictable. Factors such as regulatory developments, macroeconomic conditions, and project-specific news can all impact asset prices.
Technical analysts will be closely monitoring Solana's price action to identify potential support and resistance levels. If the cryptocurrency manages to consolidate its gains above the recently breached resistance, it could open the door for further upward momentum. However, a failure to hold onto these gains could lead to a retest of previous support levels.
As the cryptocurrency market continues to evolve, Solana's performance will be closely watched by investors and traders alike. The recent breakout and surge in future open interest has undoubtedly generated excitement, but it remains to be seen whether this momentum can be sustained.
Disclaimer: This article is for informational purposes only and does not constitute financial advice. Conducting thorough research or consulting with a financial advisor is strongly recommended before making investment decisions.

$SOL - LONG - SINCE $8CRYPTOCAP:SOL
July 2021 - CRYPTOCAP:SOL Breakout
vs
July 2024 - CRYPTOCAP:SOL Breakout
Patterns Don't Repeat, but Often Rhyme.
Been hooting and hollering on here since $8 CRYPTOCAP:SOL , this might be the last possible chance to safely enter $SOL.
GL HF. NFA.
#SOLANA
- @CryptoCurb

SOLANA to $300?SOLANA is approaching its higher timeframe key resistance.
If Bitcoin could hit 72k anytime this week, we can see SOL touching $200
I'd expect a rejection at this level, and a move down to $160-ish area is likely, where I would love to look for long.
$280 to $300 is the ideal short-term target in my opinion.

SOL new ATH soon ?SOL / USDT
SOL reclaimed the key support on HTF
and showing clear bullish pennant
As long as the above details are intact likely it is heading towards a new ATH soon

SOLUSDT : BULLISH W-Bottom PatternThe daily timeframe for Solana has revealed a key pattern - the W Bottom pattern.
If this pattern plays out, a healthy correction of around 16% is likely before another impulse wave(s) up.
It's important to note that according to this pattern, for the immediate/short term we will likely go lower to retest the key support zone, which is the W Neckline. But for the near/long term, this is a bullish pattern.
The one condition for this pattern, is that the daily candle cannot CLOSE underneath the support zone / neckline of the W .
Don't miss yesterday's update on why ALTSEASON 2.0 is upon us:
____________________________
COINBASE:SOLUSD

SOL/USDT Outlook ICT ConceptsSolana (SOL/USDT) Analysis
💰 Welcome to Your Channel!
Welcome to our channel where we delve into the intricacies of financial markets. Today, we focus on SOL/USDT, dissecting its current price action to uncover strategic trading opportunities. Join us as we analyze key levels and market dynamics, aiming to refine our trading strategies and maximize potential gains.
💡 Previous Analysis Review:
We expected a market structure shift after the sweep of the previous month's low, which occurred. The Intermediate Fair Value Gap (IFVG) held the price, leading to an expansion higher into the previous month's high.
📍 Current Market Overview:
The current price is around 184.18. We recently swept the previous week's high and are close to the buy-side liquidity (BSL) above the chart.
🔍 Identifying Key Levels:
• PMH: Previous Month High
• PWH: Previous Week High
• PWL: Previous Week Low
• BSL: Buy-Side Liquidity
• SSL: Sell-Side Liquidity
• Minor SSL: Minor Sell-Side Liquidity
• Daily FVG: Daily Fair Value Gap, highlighting areas of imbalance on the daily timeframe
📊 Key Considerations:
• Current Price Position: The price is trading around 184.18, close to sweeping the buy-side liquidity (BSL).
• Key Levels Swept: The price has taken out the previous week's high and is near the BSL.
• Potential Retracement: Anticipate the price to start moving lower from here, or wait for the BSL to be taken before looking for short positions.
Long Position Scenarios:
• For a long position, wait for the SSLs below the chart to be taken, then look for long opportunities.
A riskier long scenario involves a sweep of the Minor SSL, followed by entry on lower time frames targeting the BSL above the chart.
📈 Bullish Scenario:
Given the current price action and key considerations, a bullish scenario is possible if the following conditions are met:
• Sweep of Minor SSL: After sweeping the Minor SSL, look for entry on lower time frames targeting the BSL above the chart.
• Protected Lows: The SSLs below the chart act as protected levels, supporting a bullish continuation after being taken.
📉 Bearish Scenario:
A bearish scenario is likely if the following conditions are met:
• Sweep of BSL: The price sweeps the buy-side liquidity, indicating a potential reversal and bearish movement.
• Failure to Hold Above Key Levels: If the price fails to hold above the key levels and starts to decline, further bearish movement is likely.
📊 Chart Analysis Summary:
• Bullish Expectation: The expectation is for the price to potentially sweep the Minor SSL, retrace lower, and then look for long entries targeting the BSL above the chart. Alternatively, wait for the SSLs to be taken before looking for long opportunities.
• Bearish Expectation: If the price sweeps the BSL, it could signal a bearish scenario. If the price fails to hold above the key levels and breaks below the recent lows, further bearish movement is anticipated.
🙏 Thank you for joining us!
Exploring SOL/USDT today highlighted the importance of effective risk management in trading success. Prioritize research, implement robust strategies, and seek guidance for confident market navigation. Stay tuned for more insights on our channel. Here's to profitable trading and continuous learning!
⚠️ Disclaimer
The information provided here is for educational purposes only and should not be taken as financial advice. Always conduct your own research and consult a licensed financial advisor before making any investment decisions.
