Support around 148.18 is important
Hello, traders.
If you "Follow", you can always get new information quickly.
Please click "Boost" as well.
Have a nice day today.
-------------------------------------
(SOLUSDT 1D chart)
The OBV Line indicator on the 1M chart is formed at the 148.18 point.
Therefore, the key is whether it can be supported around 148.18 and rise above the M-Signal indicator on the 1W chart.
If not, and it falls, you should check whether it is supported near the M-Signal indicator on the 1M chart.
-
Since the M-Signal indicators of the 1D, 1W, and 1M charts are converging, I think the current location is an important support and resistance zone.
-
If it continues to rise, there is a possibility that it will touch the HA-High indicator point of the 1D chart, which is around 225.0.
However, since the HA-High indicator of the 1M chart is formed at the 179.74 point, we need to see if it can break through this area upward.
-
Since the StochRSI indicator is in the overbought zone, even if it rises further, it will eventually show a downward trend.
We need to create a response strategy by keeping this in mind.
In other words, we need to check whether the price is maintained above the M-Signal indicator of the 1D chart or above the M-Signal indicator of the 1W chart and create a response strategy.
-
Thank you for reading to the end.
I hope you have a successful transaction.
--------------------------------------------------
- Explanation of the big picture.
I used TradingView's INDEX chart to check the entire range of BTC.
I rewrote it to update the previous chart by touching the Fibonacci ratio range of 1.902 (101875.70) ~ 2 (106275.10).
(Previous BTCUSD 12M chart)
Looking at the big picture, it seems to have been maintaining an upward trend following a pattern since 2015.
In other words, it is a pattern that maintains a 3-year upward trend and faces a 1-year downward trend.
Accordingly, the upward trend is expected to continue until 2025.
-
(Current BTCUSD 12M chart)
Based on the currently written Fibonacci ratio, it is displayed up to 3.618 (178910.15).
It is expected that it will not fall again below the Fibonacci ratio of 0.618 (44234.54).
(BTCUSDT 12M chart)
Based on the BTCUSDT chart, I think it is around 42283.58.
-
I will explain it again with the BTCUSD chart.
The Fibonacci ratio ranges marked in the green boxes, 1.902 (101875.70) ~ 2 (106275.10) and 3 (151166.97) ~ 3.14 (157451.83), are expected to be important support and resistance ranges.
In other words, it seems likely that they will act as volume profile ranges.
Therefore, in order to break through these ranges upward, I think the point to watch is whether they can receive support and rise near the Fibonacci ratios of 1.618 (89126.41) and 2.618 (134018.28).
Therefore, the maximum rising range in 2025 is expected to be the 3 (151166.97) ~ 3.14 (157451.83) range.
In order to do that, we need to see if it is supported and rises near 2.618 (134018.28).
If it falls after the bull market in 2025, we don't know how far it will fall, but based on the previous decline, we expect it to fall by about -60% to -70%.
Therefore, if it starts to fall near the Fibonacci ratio 3.14 (157451.83), it seems likely that it will fall to around Fibonacci 0.618 (44234.54).
I will explain more details when the bear market starts.
------------------------------------------------------
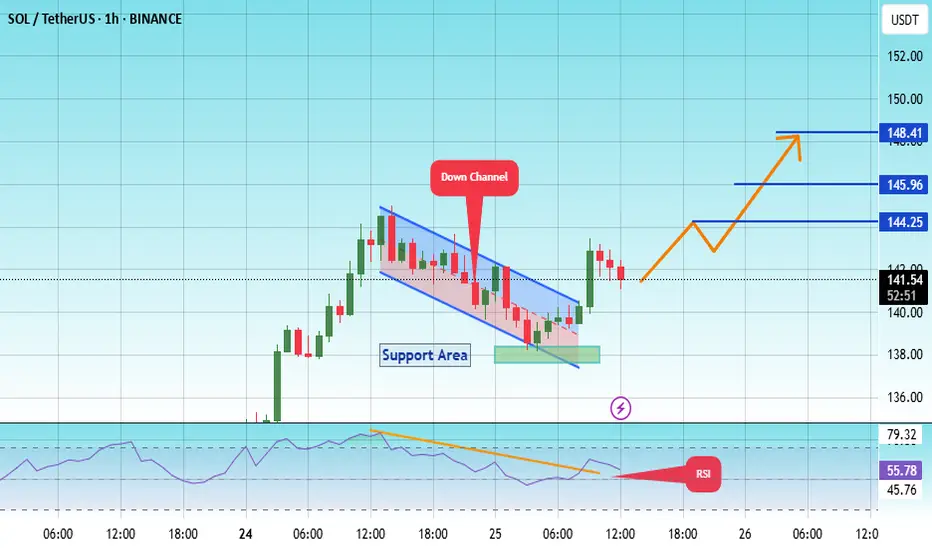
Solusdt

SOL Targets $175 With 20% Surge From Key SupportHello and greetings to all the crypto enthusiasts, ✌
All previous targets were nailed ✅! Now, let’s dive into a full analysis of the upcoming price potential for Solana 🔍📈.
Solana is currently trading within a strong descending channel. I anticipate a potential 20% price increase in the coming days, targeting the $175 level and a possible breakout to the upside. A key daily support zone has also been highlighted on the chart to provide additional context.📚🙌
🧨 Our team's main opinion is: 🧨
Solana’s stuck in a strong downtrend, but I’m eyeing a 20% bounce to $175 and a breakout soon—plus there’s a key support zone marked on the chart to watch.📚🎇
Give me some energy !!
✨We invest hours crafting valuable ideas, and your support means everything—feel free to ask questions in the comments! 😊💬
Cheers, Mad Whale. 🐋

Breaking: $PENGU Spike 33% Today Gearing For Another Leg UpThe price of Pudgy Penguins ( CSECY:PENGU ) a solana based NFT platform similar to Magic Eden saw notable uptick of 33% today, reclaiming $600 million market amidst breaking out of prolong oversold levels.
About
PENGU is the official coin of Pudgy Penguins.
Pudgy Penguins has become the face of crypto with one of the most influential communities in the industry. From large companies wearing the Penguin, to being featured in ETF commercials, to garnering millions of followers and over 50 billion views, the Pengu has become a cultural icon.
Technical Outlook
Since listing, CSECY:PENGU has seen a notable uptick of +2,000% before sharply consolidating losing about 94% of market value. Present market metrics hints at a possible move to the $0.0266 resistant point and a break above the ceiling of that pivot would spark a move to the ATH recorded.
With the RSI at 73, CSECY:PENGU is looking to capitalize on the dip and make a comeback, with all present metrics hinting at a bullish reversal to the ATH territory.
Pudgy Penguins Price Data
The Pudgy Penguins price today is $0.008763 USD with a 24-hour trading volume of $379,038,248 USD. Pudgy Penguins is up 31.78% in the last 24 hours. The current CoinMarketCap ranking is #107, with a market cap of $550,838,659 USD. It has a circulating supply of 62,860,396,090 PENGU coins.

SOL ANALYSIS🔮 #SOL Analysis 🚀🚀 Update
💲💲 As we said #SOL performed the same. #SOL is trading in a Ascending Broadening Wedge Pattern and there was a breakdown of the pattern. Now we can expect a breakout of the resistance and a bullish move
💸Current Price -- $151
⁉️ What to do?
- We have marked crucial levels in the chart . We can trade according to the chart and make some profits. 🚀💸
#SOL #Cryptocurrency #DYOR

SOL / USDT Update - Breakout in Play! Check out the 1H chart for SOLUSDT. Solana is showing strength in a rising channel, with a recent breakout from a symmetrical triangle to support at $150.
If we break to $165, we could see a strong move higher. But if rejected, watch for a pullback to $150 or lower.
What’s your take?

Is a great time for holding Solana?!Hello guys!
What I see:
Ascending Channel: Price has been moving inside a clearly defined upward-sloping channel since the start of 2023, showing a strong long-term uptrend.
33% Correction: Recently, SOL experienced a 33% correction from its local high, testing the previous breakout zone (highlighted in light blue). This area has now acted as a strong support.
Bullish Signal: Price is attempting to reclaim and close above a key horizontal resistance level (~$132), noted by the text: “If the price closes above this level, then buy it.” A close above this level would confirm a bullish reversal and suggest strength returning to the trend.
RSI Outlook: The RSI indicator at the bottom shows a potential reversal from the lower range, indicating possible bullish momentum building.
Projection: If the price successfully closes above the mentioned resistance zone, the structure supports a potential move toward a new high, as marked by the arrow pointing toward the upper channel boundary (above $250 and potentially up to $300+).

#SOL/USDT#SOL
The price is moving in a descending channel on the 1-hour frame and is expected to continue upwards
We have a trend to stabilize above the moving average 100 again
We have a descending trend on the RSI indicator that supports the rise by breaking it upwards
We have a support area at the lower limit of the channel at a price of 134
Entry price 137
First target 140
Second target 144
Third target 149

#SOL/USDT#SOL
The price is moving within a descending channel on the 1-hour frame, adhering well to it, and is heading for a strong breakout and retest.
We are seeing a bounce from the lower boundary of the descending channel, this support at 138.
We have a downtrend on the RSI indicator that is about to be broken and retested, supporting the upward trend.
We are looking for stability above the 100 moving average.
Entry price: 142
First target: 144
Second target: 146
Third target: 148
#SOL/USDT#SOL
The price is moving within a descending channel on the 1-hour frame and is expected to continue lower.
We have a trend to stabilize below the 100 moving average once again.
We have a downtrend on the RSI indicator that supports the upward move with a break above it.
We have a resistance area at the upper limit of the channel at 127.
Entry price: 126
First target: 124
Second target: 122
Third target: 119

SOL in coming weeksThe SOL will increase $150 and reach to the top of the wedge in the coming weeks .
Give me some energy !!
✨We spend hours finding potential opportunities and writing useful ideas, we would be happy if you support us.
Best regards CobraVanguard.💚
_ _ _ _ __ _ _ _ _ _ _ _ _ _ _ _ _ _ _ _ _ _ _ _ _ _ _ _ _ _ _ _
✅Thank you, and for more ideas, hit ❤️Like❤️ and 🌟Follow🌟!
⚠️Things can change...
The markets are always changing and even with all these signals, the market changes tend to be strong and fast!!

SOLANA (SOL) – Bearish Breakdown Incoming? Watch These Key LevelHey Traders!
#SOL is currently showing strong bearish signals on the 2H timeframe:
🔸 Rising Wedge Pattern spotted — a classic bearish reversal structure.
🔸 Bearish Divergence on RSI — momentum is weakening while price continues higher.
🔸 Breakdown from the wedge already occurred — confirming the initial weakness.
Next Key Support Zone: $120–$130
This zone has held multiple times, but a clean break below followed by a retest could offer a high-probability short setup.
🎯 Trade Plan:
We’re watching for:
Break of the $120–$130 support
Retest of the broken level
Entry on confirmation with strict risk management
💬 What’s your take on #SOL? Are you bullish or bearish? Drop your thoughts below!
🧠 Trade smart, manage your risk, and follow for more TA like this!
📌 Like, comment, and share if you found this helpful.
#SOL #Solana #CryptoTrading #BearishDivergence #RisingWedge #TechnicalAnalysis #TradingSetup #ShortTrade #CryptoTA #Altcoins

SOL/USDTInitially, there is a level, there is also a liquidity removal.. but I would like to show you the indicator that I came up with and prescribed and how it works. Thank you all so much!

Solana (SOL/USD) Elliott Wave Update – Countertrend Rally in ProBINANCE:SOLUSDT
🟠 Current Elliott Wave Outlook
After completing Wave ③, Solana began a sharp correction. This is how the current structure unfolds:
The initial leg down unfolded as a clear (1)-(2)-(3)-(4)-(5) structure in black – forming the white Wave A of a larger A-B-C corrective pattern.
We are now in the corrective counter-move, forming Wave B.
🔄 Zooming into Wave B: Internal Progression
The early part of Wave B is unfolding as a small impulse:
→ Wave 1, 2, 3, 4 have already played out.
→ We are currently moving from Wave 4 into Wave 5, which is expected to complete the black (A) of white B.
The top of Wave (A) is already marked on the chart, coinciding with key Fibonacci Extension levels, which reinforce the probability of local exhaustion.
🟨 Next Structure – Building Wave (B) of B
After the black (A) completes, we expect a retracement wave (B).
This would then be followed by a yellow 1-2-3-4-5 impulse to the upside – forming the full structure of white Wave B.
📉 What Comes After B?
Once Wave B (in white) is complete (built from the black (A)-(B)-(C)), we anticipate another larger leg to the downside – white Wave C.
This would complete the full A-B-C correction from the macro top of Wave ③.
🎯 Key Zones to Watch:
Black Wave (A) Top = short-term resistance
Fibonacci Extension Area = likely exhaustion zone for the current rally
Wave B (white) = potential bearish trap before the real drop (Wave C)
✅ Summary
Solana is currently in a countertrend corrective phase after finishing a macro Wave ③ top. We are in the midst of building Wave B, starting with a local impulse that forms black (A). After a minor pullback (black (B)), a 5-wave push (yellow) could complete Wave B before another major leg down kicks off in Wave C.

Solana – Bear Market Rally or Reversal?Like the rest of the crypto market, Solana started rebounding on April 8th, pushing more than 50% up from the recent lows. But just like with many altcoins, I'm not convinced this is a true trend reversal. Instead, it looks more like a classic bear market rally.
Let’s not forget: SOL is coming down from nearly $300. A bounce from $95 to $150 is strong, yes—but in the bigger picture, it’s still just a correction.
📍 Key resistance zone: $160–$170
As long as price remains under this zone, the probability of another leg down remains high.
🧠 My plan:
If Solana creates a new local high around $160, I’ll be looking to sell into the rally.
🎯 Target:
$100 at least, depending on how the market reacts.

PI UPDATEHello friends
According to the triangle pattern that the price has formed, you can see that we had a decline and after that the price has managed to create a small ascending channel that indicates the inflow of money and we can expect the price to grow to the ceiling of the channel within the channel itself and in case of failure in the lower ranges, other buying steps have been identified.
*Trade safely with us*

SOL/USDT:BUYHello friends
Due to the price correction, we can buy in two specified areas in a stepwise manner, with capital and risk management.
*Trade safely with us*

$136 Resistance Crumbles: Solana Bulls Take the Lead...Solana Breaks Key Resistance – Eyes Set on $150 and $180 Targets
Solana (SOL) has successfully broken through the strong resistance level at $136 after several failed attempts, signaling a potential continuation of its current uptrend. This breakout marks a significant technical milestone for SOL, which had previously struggled to maintain momentum above this price zone.
If Solana is able to hold above the $136–$137 level, it could open the door for further gains, with short- to mid-term price targets around $150 and $180. The breakout aligns with broader bullish sentiment in the crypto market and may attract new buyers looking to ride the trend.
For traders or investors interested in entering a position, the $136–$137 range could offer a potential entry point, provided the breakout holds and is supported by volume. As always, proper risk management is recommended, and watching for confirmation on the next few candles could be key.

SOLUSDT SOLUSDT Analysis 📊
🔹 Support Levels: 118, 112, and 107 USD
🔹 Resistance Levels: 130 and 150 USD
✅ The price has reacted positively after testing the 118-112 USD support zone, showing a short-term bullish move with increasing volume.
📉 If the price fails to break 130 USD, a pullback to 118 USD is possible.
📈 A breakout above 130 USD could pave the way for a move toward 150 USD.
🔍 Conclusion: The bullish trend remains unconfirmed until 130 USD is broken.

SOLUSDT Breakdown WarningYello Paradisers! Have you spotted what’s happening with SOLUSDT right now? A major breakdown just played out, and this could be the beginning of a much deeper bearish move that many are underestimating.
💎SOLUSDT has broken down from a rising wedge pattern—an important bearish structure that often signals upcoming downside pressure. Before the drop, it swept liquidity, a typical smart money move, and has now confirmed a bearish Change of Character (CHoCH). This combination significantly increases the probability of further decline.
💎If we see a pullback into the resistance zone—it could offer a strong short opportunity with good risk-to-reward ratio. That’s where professional traders start looking to position themselves carefully.
💎However, this bearish idea has a clear invalidation point. If price breaks out and closes a candle above that invalidation level, then the bearish outlook becomes void. In such a case, it’s wiser to stay patient and wait for more precise, high-probability setups to develop.
🎖Strive for consistency, not quick profits. Treat the market as a businessman, not as a gambler. Stay disciplined, Paradisers, and wait only for the cleanest, most reliable trading opportunities. That’s how you make it in this game.
MyCryptoParadise
iFeel the success🌴

$SOL - Pullback to $120 Likely?Solana recently rebounded from a key higher-timeframe support level. However, a short-term pullback to around $120 could be on the horizon before any significant upward move.
For a short-term outlook, check this video.

Sol Extremely Bullish FractalHi
Please click like
So this is as fractal from previous bull run in 2021, and used the same fibonacci targets for this bull run.
The chart here is SOLBTC, so if peak on this chart is 0.01BTC and BTC today is 100K =
SOL 1k.
If BTC peak is 200K -> Sol is 2K... etc.
----
This is a dreamy target, but it is in my opinion important to have some extreme targets.
I have been in crypto for 7 years, and havent we all seen extreme things happen ?
Perhaps this could be possible with SOL "eth killing" and taking the coin nr 2 place ?
Watch below some other SOL vs ETH ideas. It looks.. possible..
Or ? What do you think ?

SOLANA WILL RETURNCurrently, SOL is moving in bottom sides of a trendline which is not broken yet.
Despite being full of liquidity, this trendline for SOL might be the best opportuinty to buy for long term.
As long as the level 60$ is not broken, SOL will rise for a new all time high.
Remember, The Ecosystem of Solana build on casino. Gambler always return.
If SOL closes below the level of 60$ in weekly timeframe, the analysis is invalid and you can assume that SOL is diving through a bearish season.

SOLUSDT heading towards resistance 180SOLUSDT has bounce from monthly support MS1. A weekly support marked as WS1 on the chart is also sitting just above it. Therefore, this zone 95-110 was a confluece of these support levels and a bounce was justified. Now the price is heading towards weekly resistance which is sitting around 165-180 zone. However, it is facing daily resistance DR1 and currently pushing there. With a bit of struggle, it shall pierce through this DR1 resisatnce to head towards weekly resistance. And exactly above that weekly resistance, monthly resistance MR1 is also sitting with zone 180-200. Therefore, this is a confluence of the resistances and will cause the upward movement of the price to stall there and cause some push back. Lets see how it reacts there but if in long some profit taking on that resistance confluence zone is definitely a rational behavior.
