TRUMP(UPDATE)Hello friends
Given the good price growth, now in the pullbacks that the price makes, we can buy in the specified support areas and move with it to the specified targets.
Of course, with capital and risk management...
*Trade safely with us*
Solusdt

Nothing !!!Currently, SOL is forming an ascending triangle, indicating a potential price increase. It is anticipated that the price could rise, aligning with the projected price movement (AB=CD).
However, it is crucial to wait for the triangle to break before taking any action.
Give me some energy !!
✨We spend hours finding potential opportunities and writing useful ideas, we would be happy if you support us.
Best regards CobraVanguard.💚
_ _ _ _ __ _ _ _ _ _ _ _ _ _ _ _ _ _ _ _ _ _ _ _ _ _ _ _ _ _ _ _
✅Thank you, and for more ideas, hit ❤️Like❤️ and 🌟Follow🌟!
⚠️Things can change...
The markets are always changing and even with all these signals, the market changes tend to be strong and fast!!

Solana’s Cup-and-Handle Setup: A Bullish Trap or Opportunity?Recent analysis suggests Solana (SOL) is forming a large cup-and-handle pattern, with a potential false breakout on the fifth wave before a flash crash in mid to late April. Some traders believe this correction could set the stage for a stronger breakout on the seventh wave, possibly pushing SOL past its current pattern high and toward the upper boundary of a broadening wedge formation. Despite short-term volatility, this multi-year structure supports a long-term bullish outlook.
In the near term, market structure remains uncertain, with SOL facing downward pressure despite bouncing from $120. While this level has historically been strong support, the depth of the correction and multiple broken levels suggest caution. Analysts remain divided on the next move—some expect consolidation between $120 and $180, while others warn of a potential drop to $80 if market conditions worsen. Monitoring key support and resistance levels will be crucial for traders navigating the next phase.

SOL - One SOL for a SOULThe Guided help can help you enjoy some sol move. THE untested OB can proove to do wonders!!

SOL/USDT 1H: Bullish Trend Holding – Can $137 Be Reached?SOL/USDT 1H: Bullish Trend Holding – Can $137 Be Reached?
🚀 Follow me on TradingView if you respect our charts! 📈 Daily updates!
Current Market Conditions (Confidence: 8/10):
Price at $134.34, confirming strong momentum and trend continuation.
RSI at 72, indicating overbought conditions, but trend remains strong.
Hidden bullish divergence observed on the recent pullback, signaling further upside.
Market Makers completed accumulation in the $126 - $128 zone, now shifting toward markup.
LONG Trade Setup:
Entry: $133.50 - $134.00 zone.
Targets:
T1: $136.00 (first resistance).
T2: $137.00 (next liquidity zone).
Stop Loss: $131.20 (below recent support).
Risk Score:
7/10 – Favorable setup, but overbought RSI suggests potential pullbacks.
Market Maker Activity:
A
ccumulation phase completed, transitioning into a distribution phase.
Clean break above $133.00 confirms institutional interest and trend continuation.
Higher low formation with increasing volume, supporting further bullish momentum.
Strong support established at $131.20, reinforcing the uptrend.
Recommendation:
Long positions remain favorable within the $133.50 - $134.00 entry range.
Scaling in on pullbacks to $133.50 is recommended to optimize entry.
Monitor price reaction at $136.00, as this level may see short-term resistance.
🚀 Follow me on TradingView if you respect our charts! 📈 Daily updates!

An overall look at SOL with my April flash crash thesis embeddedSOL is forming a massive cup-and-handle pattern overall. However, when zooming into the short-term pattern currently unfolding, I believe we will see a false breakout leg on the fifth wave, leading to a 'flash crash' in mid to late April. After this occurs, the true breakout will likely happen on the seventh wave, taking out the pattern high and running to the top of the broadening wedge pattern—or perhaps even higher—given the bigger picture of a massive cup-and-handle formation that has been developing for over three years.
Good luck, and always use a stop-loss!

The handle is now forming on a massive cup & handle on SOL.SOL is now forming the handle of a massive cup-and-handle pattern that has taken over three years to develop. If SOL breaks out of this pattern in the coming months, we could very well see a four-digit price moving forward.
Keep your eyes on this.
Good luck, and always use a stop-loss!

KDAUSDT UPDATEKDAUSDT is a cryptocurrency trading at $0.4898. Its target price is $0.8000, indicating a potential 90%+ gain. The pattern is a Bullish Falling Wedge, a reversal pattern signaling a trend change. This pattern suggests the downward trend may be ending. A breakout from the wedge could lead to a strong upward move. The Bullish Falling Wedge is a positive signal, indicating a potential price surge. Investors are optimistic about KDAUSDT's future performance. The current price may be a buying opportunity. Reaching the target price would result in significant returns. KDAUSDT is poised for a potential breakout and substantial gains.

SOL Looks Bearish (1D)A major trendline has been lost despite positive news, and SOL is prone to further drops towards the green box.
A large liquidity pool exists below the price, which is likely to be taken out, pushing the price toward the marked zone.
The price structure has turned bearish with a CH on the chart.
A daily candle closing above the invalidation level will nullify this analysis.
For risk management, please don't forget stop loss and capital management
Comment if you have any questions
Thank You

Solana’s Price Action: Aftermath of the Blow-Off TopThe recent peak for Solana, approaching $300, has proven to be a classic blow-off top. The subsequent decline has broken through three key support levels, retracing around 60% and ultimately reaching the $120 level—a price point that has acted as a strong floor over the past year, with multiple reversals from this zone.
While this may seem positive, the chart structure at the moment doesn't appear encouraging for bulls.
Current Market Structure: A Bearish Outlook
Looking at the price action, it’s clear that the market has faced significant downward pressure. Despite the bounce from $120, the overall structure suggests caution. While the $120 level is historically strong, there’s no guarantee it will hold again. The series of broken support levels and the depth of the correction point to a market that is struggling to regain its previous strength.
Optimistic vs Pessimistic Scenarios: Where Could Solana Go Next?
In my opinion, the optimistic scenario for Solana would see the price range between the $120 zone and the $180 zone. This would represent a consolidation pattern, as the market tries to establish a new equilibrium. However, given the overall trend and recent price action, it’s also important to consider a more pessimistic scenario. In the worst case, the price could fall as low as $80, especially if the broader market continues to face downward pressure.

#SOL/USDT#SOL
The price is moving in a descending channel on the 1-hour frame and is expected to continue upward.
We have a trend to stabilize above the 100 moving average once again.
We have a downtrend on the RSI indicator that supports the upward move with a breakout.
We have a support area at the lower boundary of the channel at 121.60.
Entry price: 126
First target: 129
Second target: 132
Third target: 135

Sol trade idea for short SOL has formed buy side liquidity just below the bearish OB and FVG. This is the area where I’m looking for short.

SOL: Current SituationYou asked, and we delivered:
Solana (SOL) is trading at $129, navigating a volatile phase amid a broader crypto market downturn, with the total market cap down 4.4% in the last 24 hours. Sentiment is mixed: some traders eye a potential cup-and-handle pattern for a bullish breakout, while others flag oversold conditions and bearish signals. Rumors of a Solana ETF add speculation, though unconfirmed. For now, SOL’s price action hinges on key support and resistance levels.
Technical Indicators and Key Levels
Short-Term (1-Hour Chart):
Support: $125 (critical), $110
Resistance: $140, $150
Indicators: RSI near oversold (~30), MACD bearish. A break above $140 with volume could target $150, but a drop below $125 risks $110.
Long-Term (Weekly Chart):
Support: $125, $90
Resistance: $140, $180
A hold above $125 could set up a rally to $180 if the cup-and-handle pattern confirms. Below $125, a deeper correction to $90 is possible.
Potential Scenarios
Bullish Case: Hold $125, break $140 with volume → target $150 (short-term), $180 (long-term).
Bearish Case: Break below $125 → test $110 (short-term), $90 (long-term).
Volume is key, watch for spikes to confirm moves.
Broader Context and Tips
SOL’s long-term outlook is promising due to its fast blockchain and ecosystem growth, but short-term risks loom. External factors like US inflation data or ETF news could sway the market. Traders should use tight stops, focus on $125 support, and stay flexible. Long-term investors should monitor $125 as a critical floor for bullish continuation.

Solana ($SOLUSD) - Monthly Demand InboundQuick TA for Solana $SOL. Many cryptos are at inflection points and will likely break higher or roll over from current prices (I think a move down is more likely, per long-term charts, and am hoping this happens for the sake of buying opportunities). Solana, like many other cryptos, has failed to develop meaningful 1D bullish momentum (RSI holding below 50). Should COINBASE:SOLUSD get another leg down, I'll be watching its behavior as it enters lower demand zones. 101.75-78.87 = monthly demand; 74.85-51.37 = weekly demand, but there are also buy areas higher. If Solana trades lower and approaches the aforementioned levels, use LTFs for signs of exhaustion/downtrend reversal. Personally, I wouldn't use "set-and-forget" buy limit orders; higher-beta cryptos may keep selling off until majors bottom/reverse and/or prices might not trade low enough to hit your limit price. I prefer more of a "hands-on" approach to trading, but to each their own.
On the road, so truncated analysis. Will update when I can. Thank you for your interest and let me know what you think!
Jon
@JHartCharts

SOL/USDTHello friends
Given the downward trend we had, the price has reached a good support area and if the area is maintained, you can enter a buy trade and move to the specified targets with it.
*Trade safely with us*

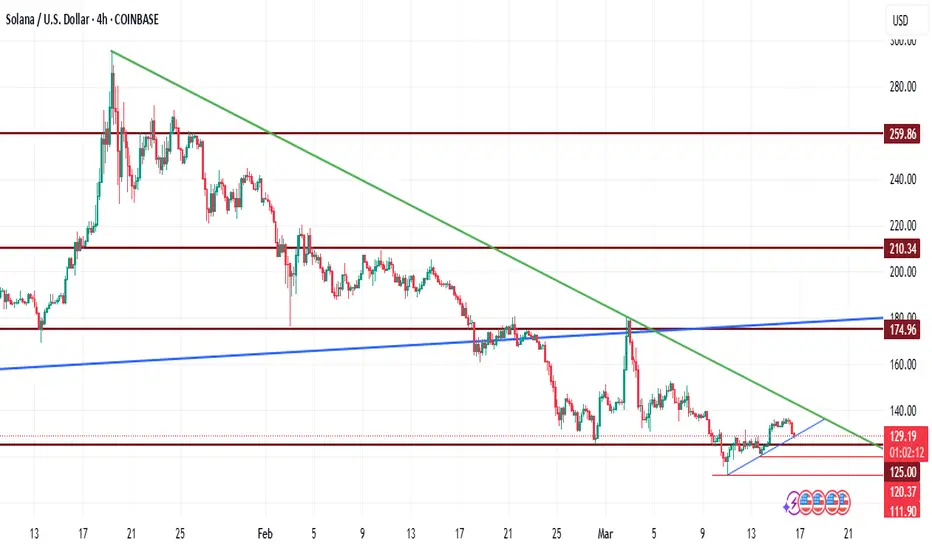
4H view for SOLANA4H view for SOLANA
A push above the current zone might send this asset to $136 - $137
A fall below might push this asset down to $120, or the worst case scenario $111 zone.
This is a short term trade anlysis
GMXUSDT UPDATEGMXUSDT is a cryptocurrency trading at $15.52. Its target price is $30.00, indicating a potential 90%+ gain. The pattern is a Bullish Falling Wedge, a reversal pattern signaling a trend change. This pattern suggests the downward trend may be ending. A breakout from the wedge could lead to a strong upward move. The Bullish Falling Wedge is a positive signal, indicating a potential price surge. Investors are optimistic about GMXUSDT's future performance. The current price may be a buying opportunity. Reaching the target price would result in significant returns. GMXUSDT is poised for a potential breakout and substantial gains.

SOLANA; Heikin Ashi Trade IdeaBINANCE:SOLUSD
In this video, I’ll be sharing my analysis of SOLUSD, using my unique Heikin Ashi strategy. I’ll walk you through the reasoning behind my trade setup and highlight key areas where I’m anticipating potential opportunities.
I’m always happy to receive any feedback.
Like, share and comment! ❤️
Thank you for watching my videos! 🙏

SOL/USD "Solana vs U.S Dollar" Crypto Market Heist Plan🌟Hi! Hola! Ola! Bonjour! Hallo!🌟
Dear Money Makers & Robbers, 🤑 💰🐱👤🐱🏍
Based on 🔥Thief Trading style technical and fundamental analysis🔥, here is our master plan to heist the SOL/USD "Solana vs U.S Dollar" Crypto Market. Please adhere to the strategy I've outlined in the chart, which emphasizes short entry. Our aim is the high-risk Green Zone. Risky level, oversold market, consolidation, trend reversal, trap at the level where traders and bullish robbers are stronger. 🏆💸Book Profits Be wealthy and safe trade.💪🏆🎉
Entry 📈 : "The heist is on! Wait for the breakout (160.00) then make your move - Bearish profits await!"
however I advise placing Sell Stop Orders below the breakout MA or Place Sell limit orders within a 15 or 30 minute timeframe. Entry from the most recent or closest low or high level should be in retest.
Stop Loss 🛑:
Thief SL placed at the recent / nearest low level Using the 1D timeframe (200.00) swing trade basis.
SL is based on your risk of the trade, lot size and how many multiple orders you have to take.
Target 🎯:
1st Target - 125.00 (or) Escape Before the Target
Final Target - 90.00 (or) Escape Before the Target
🧲Scalpers, take note 👀 : only scalp on the Short side. If you have a lot of money, you can go straight away; if not, you can join swing traders and carry out the robbery plan. Use trailing SL to safeguard your money 💰.
📰🗞️Fundamental, Macro, COT, Sentimental Outlook:
SOL/USD "Solana vs U.S Dollar" Crypto Market is currently experiencing a bearish trend,., driven by several key factors.
⚡⭐Fundamental Analysis
Blockchain Trends: Solana's blockchain growth is expected to slow down, driven by increasing competition from other blockchain platforms.
Smart Contract Activity: Smart contract activity on Solana's blockchain is expected to decrease, driven by growing competition from other blockchain platforms.
Mining Difficulty: Solana's mining difficulty is expected to decrease, driven by decreasing network hash rate.
Transaction Volume: Solana's transaction volume is expected to decrease, driven by decreasing demand for cryptocurrency transactions.
⚡⭐COT Data
Non-Commercial Traders (Institutional):
Net Short Positions: 55%
Open Interest: 100,000 contracts
Commercial Traders (Companies):
Net Long Positions: 30%
Open Interest: 50,000 contracts
Non-Reportable Traders (Small Traders):
Net Short Positions: 15%
Open Interest: 20,000 contracts
COT Ratio: 0.6 (indicating a bearish trend)
⚡⭐Sentimental Outlook
Institutional Sentiment: 40% bullish, 60% bearish.
Retail Sentiment: 35% bullish, 65% bearish.
Market Mood: The overall market mood is bearish, with a sentiment score of -50.
⚡⭐On-Chain Analysis
Network Hash Rate: Solana's network hash rate has decreased by 10% over the past month, indicating a decline in mining activity.
Transaction Volume: Solana's transaction volume has decreased by 20% over the past month, indicating a decline in network activity.
Active Addresses: Solana's active addresses have decreased by 15% over the past month, indicating a decline in network adoption.
⚡⭐Market Data Analysis
Order Book Analysis: The SOL/USD order book is showing a significant imbalance, with more sell orders than buy orders, indicating a bearish market sentiment.
Liquidity Analysis: Solana's liquidity has decreased by 10% over the past month, indicating a decline in market participation.
Volatility Analysis: Solana's volatility has increased by 20% over the past month, indicating a more unpredictable market.
⚡⭐Positioning
Long Positions: 30% of total positions
Short Positions: 70% of total positions
Neutral Positions: 0% of total positions
Leverage: 2:1 (average)
⚡⭐Next Move Prediction
Bearish Move: Potential downside to 140.00-125.00.
Target: 125.00 (primary target), 90.00 (secondary target)
Next Swing Target: 80.00 (potential swing low)
Stop Loss: 190.00 (above the 30-day high)
Risk-Reward Ratio: 1:2 (potential profit of 30.00 vs potential loss of 15.00)
⚡⭐Overall Outlook
The overall outlook for SOL/USD is bearish, driven by a combination of fundamental, technical, and sentimental factors. The expected slowdown in Solana's blockchain growth, decreasing smart contract activity, and bearish market sentiment are all supporting the bearish trend. However, investors should remain cautious of potential upside risks, including changes in global economic trends and unexpected regulatory developments.
⚠️Trading Alert : News Releases and Position Management 📰 🗞️ 🚫🚏
As a reminder, news releases can have a significant impact on market prices and volatility. To minimize potential losses and protect your running positions,
we recommend the following:
Avoid taking new trades during news releases
Use trailing stop-loss orders to protect your running positions and lock in profits
📌Please note that this is a general analysis and not personalized investment advice. It's essential to consider your own risk tolerance and market analysis before making any investment decisions.
📌Keep in mind that these factors can change rapidly, and it's essential to stay up-to-date with market developments and adjust your analysis accordingly.
💖Supporting our robbery plan will enable us to effortlessly make and steal money 💰💵 Tell your friends, Colleagues and family to follow, like, and share. Boost the strength of our robbery team. Every day in this market make money with ease by using the Thief Trading Style.🏆💪🤝❤️🎉🚀
I'll see you soon with another heist plan, so stay tuned 🤑🐱👤🤗🤩

Solana SOL Will Bounce, But Then Scam!Hello, Skyrexians!
Couple of weeks ago we told you that BINANCE:SOLUSDT will reach $110 in the wave 5 inside the major wave A. You can find this analysis here . Exactly from this zone we have seen the bounce. This bounce is a major correction and those who listen this analysis could already be in the great profit. But anticipated bounce is not the bull run continuation and finally Solana will drop hard because its era is finished.
Let's take a look at the weekly time frame. Here we can see that 5 Elliott waves with the Awesome Oscillator's divergence. After that the major correction has been started. Wave A has been finished at $110 with the green dot at the Bullish/Bearish Reversal Bar Indicator and now we will see wave B, which will reach the Fibonacci 0.5 approximately at $200. From there we will see the scam drop in wave C. It will likely break the major Fibonacci 0.61 support. In this case game is over and Solana can fall for a years or even scam.
Best regards,
Skyrexio Team
___________________________________________________________
Please, boost this article and subscribe our page if you like analysis!

Solana defended the crucial 120-125 zoneCOINBASE:SOLUSD managed to defend the super important 120-125 support zone. As long as it stays above it, we can hope it would climb higher. On the contrary, if Solana breaks down below this then it can go much much lower.
Keep an eye.

How far can $125 support SOLANA from fallingSolana (SOL) Price Analysis and Forecast: Can the $125 Support Hold?
Solana (SOL) recently experienced a sharp dip to the $110 zone before rebounding swiftly. From a technical analysis (TA) perspective, the $125 support level is currently a key defence zone for the asset.
If SOL maintains its position above $125, we could see a continuation of bullish momentum. However, a decisive break below this level could expose the cryptocurrency to further downside, with the next major psychological support resting at $100.
For long-term investors, the current price action presents potential accumulation opportunities.
Maintaining a strategic approach with proper risk management will be crucial as market volatility persists.

SOLUSDT: Strong Bounce from Major Support!!BINANCE:SOLUSDT has shown a strong recovery after hitting a major support zone around $110. This bounce is accompanied by good trading volume, indicating growing interest. Investors who missed the previous rally are now accumulating, which adds further strength to the bullish sentiment.
As market conditions improve, the entry of bigger players could push SOL towards higher highs. If momentum continues, there’s potential for SOL to breach its previous all-time high, with a long-term target of $500 in sight.
For investors, this presents a solid buying opportunity to hold for the long term. Traders, however, should manage their risk carefully and always set a stop loss to protect their capital.
BINANCE:SOLUSDT Currently trading at $132
Buy level: Above $110
Stop loss: Below $90
Target : $500
Max Leverage 3x
Always keep Stop loss
Follow Our Tradingview Account for More Technical Analysis Updates, | Like, Share and Comment Your thoughts
