SOL - Time to buy again! (Update)Be careful with SOL !!!
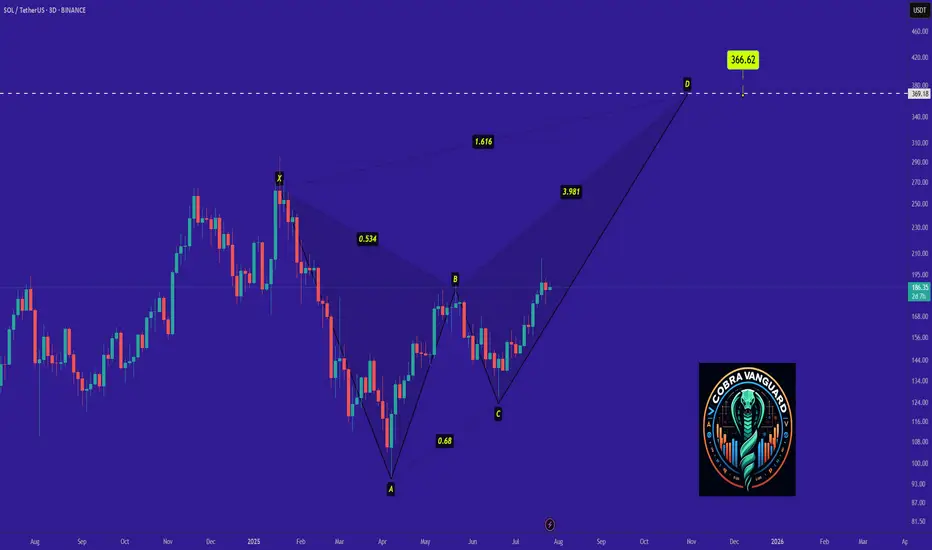
we can hope that the price will act like a Crab pattern and the price will grow well.
I expect that the price will grow very quickly...
Solusdt
SOL/USDT Technical OutlookPrice may push higher towards the $194 resistance zone.
From there, a sharp rejection is expected, targeting the $171 support area.
If the market fails to hold $171, the next potential downside target lies around $140.
Key Levels:
Resistance: $194
Support: $171, then $140
Structure: Rising channel breakdown in play
📉 Bearish scenario activated if $171 fails to hold.

Just like #AKRM, #SOL can also pump 100%Just like #AKRM, #SOL can also pump 100%..
SOL will also have this kind of exit rally. Whether there is a war between the US, Iran, and Israel or not, the market will crash very badly.

Opened longI opened a long position.
Ideally it is safe to wait for EMAs to line up for the bull trend (EMA21 > 55> 200) in the Daily chart. However, there are many indications that the price will start to move to the upside and the upside move might be quite aggressive. So I decided to open a long position with a small position size.
The reasons for opening a long position:
Daily:
Bull candle has closed above EMA21 for a few times.
RSI lines have crossed and entered the bull zone.
MACD lines are about to enter the bull zone.
Stochastic lines are above to cross and move up.
The price has been staying above Fib 0.236 level for about 10 days.
The price has broke and closed above the descending parallel channel.
4H:
All momentum indicators are in the bull zone.
EMA21 is above EMA 55.
The price has closed above EMA200.
The price is consolidating above the top descending parallel channel.
It is not the perfect bull trend set up, however, there are enough confluences for the price to start to move to the upside.
Entry price: $142.59 (blue horizontal line in 4H chart)
Stop Loss: $130.40 (red horizontal line in 4H chart)
Target: $195 (green horizontal line: Fib 0.5 level in Daily chart and fair value gap zone)
$178 is a strong support and resistance area, so if it starts to stall, I might take a partial profit.
Fingers crossed.

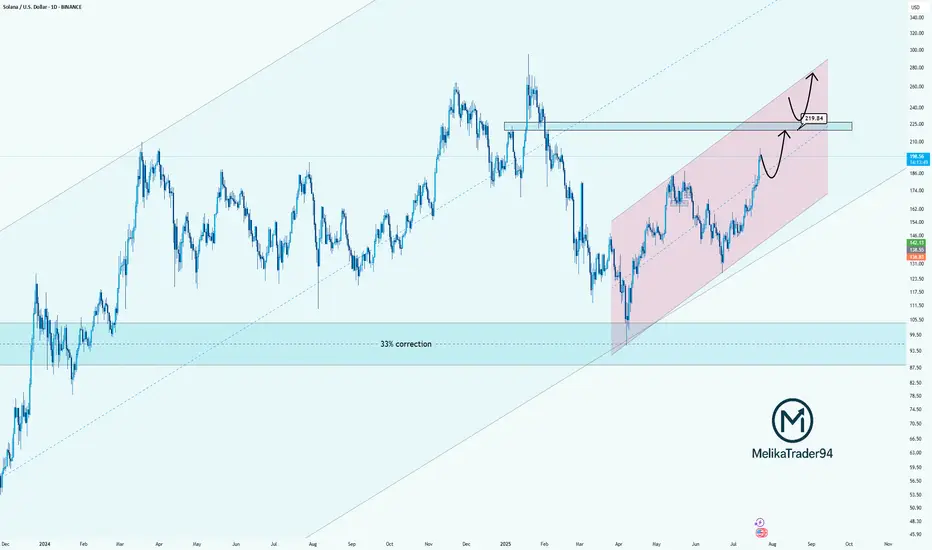
Solana Approaching Key Resistance: watch for $219Hello guys!
Solana has been trending strongly inside a rising parallel channel, recovering steadily after a significant 33% correction. The bullish momentum is clear, and the price is now approaching a key resistance zone near $219.84, which previously acted as a major turning point.
Here’s what I’m watching:
Strong uptrend within the pink channel shows controlled and healthy growth.
$219.84 is a critical decision zone. Price could:
React with a pullback before pushing higher,
Or break through it and flip the level into support for the next bullish leg.
The reaction in this zone will determine the next structure.
Whether we see a temporary correction or continuation to new highs.
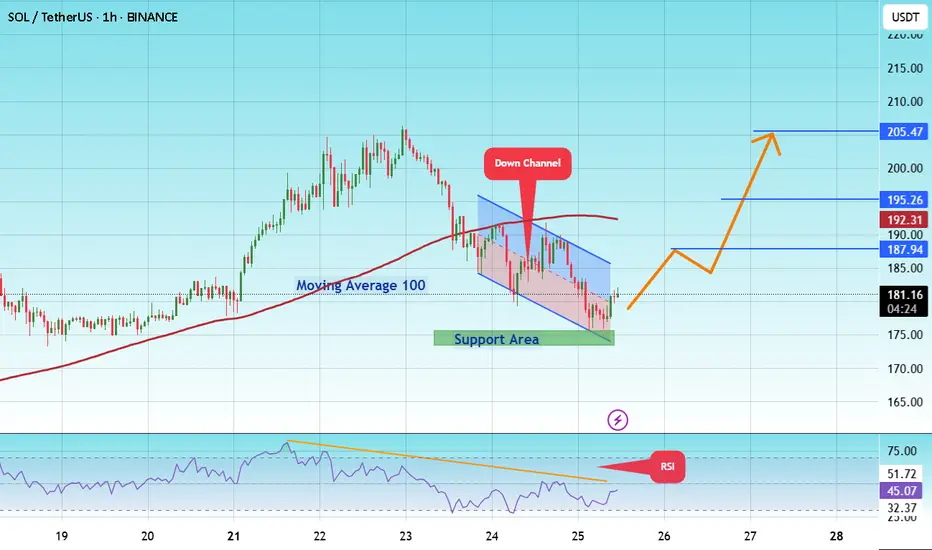
#SOL/USDT coin market structure analysis#SOL
The price is moving within a descending channel on the 1-hour frame and is expected to break and continue upward.
We have a trend to stabilize above the 100 moving average again.
We have a downtrend on the RSI indicator that supports the upward move with a breakout.
We have a support area at the lower boundary of the channel at 175, acting as strong support from which the price can rebound.
We have a major support area in green that pushed the price upward at 174.
Entry price: 181.
First target: 187.
Second target: 195.
Third target: 205.
To manage risk, don't forget stop loss and capital management.
When you reach the first target, save some profits and then change the stop order to an entry order.
For inquiries, please comment.
Thank you.
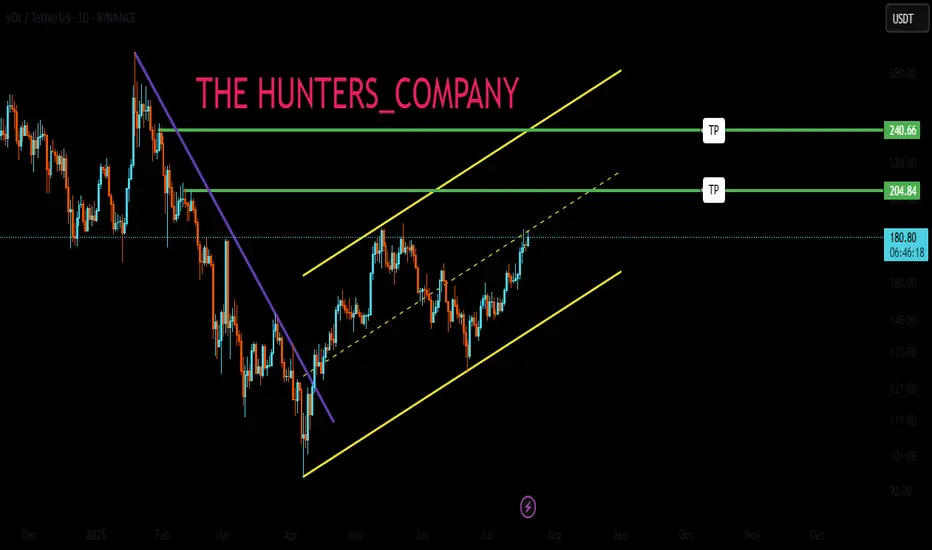
SOLANA UPDATEHello friends🙌
📉Given the decline we had, you can see that buyers came in and supported the price and were able to change the trend and create an ascending channel.
📈Now, considering that the price is hitting higher ceilings and floors, we can expect an ascending wave until the ceiling of the channel.
Don't forget risk and capital management.⚠
🔥Follow us for more signals🔥
*Trade safely with us*
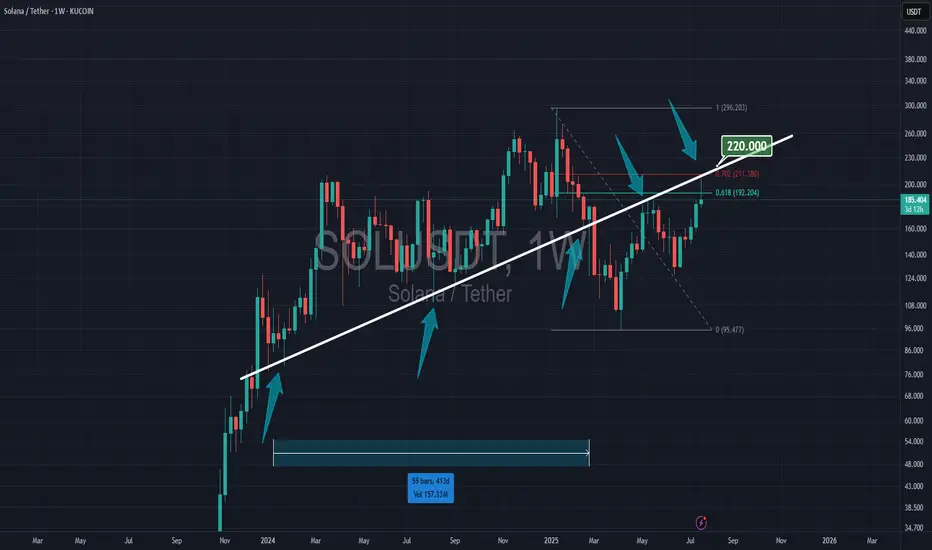
SOLANA & 220 RESISTANCESolana is at 61% of Fibonacci, and the trendline has held since early 2024. To stay in the bull run, Solana must break the 220 resistance.
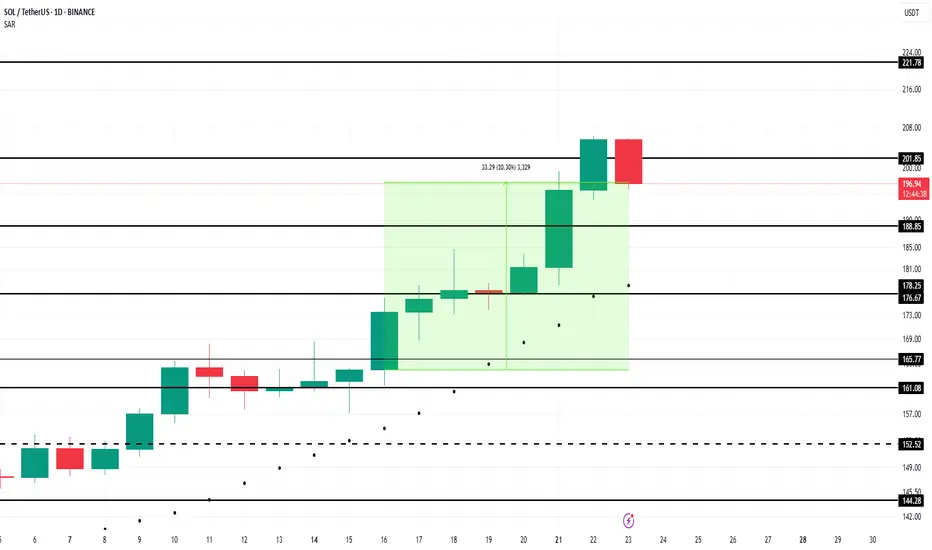
Solana Price Faces Reversal At $200 As Profits Hit 5-Month HighBINANCE:SOLUSDT price has risen 21% in the past week , now trading at $199. Despite breaching the $200 mark, Solana has failed to maintain this level, marking a five-month high.
The Net Unrealized Profit/Loss (NUPL) indicator for BINANCE:SOLUSDT shows that profits have reached a five-month high . This signals that many investors are in profit, raising concerns about a potential sell-off.
If these factors hold true, BINANCE:SOLUSDT price could decline toward the support levels of $188 or even drop to $176 . A move below these levels could erase a significant portion of the recent gains and shift the altcoin into a bearish trend.
However, if investor confidence remains strong and the market continues to show bullish signs, BINANCE:SOLUSDT could stabilize above $200 . Securing this level as support could propel the price back toward $221, invalidating the bearish outlook.
Your Technical Analysis Improved, But Your Account Didn't. Why?You're learning more. Your charts look cleaner.
But somehow... your losses just keep getting worse?
If that feels familiar, this breakdown might explain exactly why.
Hello✌️
Spend 3 minutes ⏰ reading this educational material.
🎯 Analytical Insight on Solana:
BINANCE:SOLUSDT is testing a key trendline and daily support that aligns with Fibonacci levels 🔍. A clear break above the psychological resistance at $210 could trigger at least a 16% rally, targeting $230 🚀.
Now, let's dive into the educational section,
🧬 The Precision Trap
The better your analysis gets the narrower your entries become.
You start avoiding trades unless every single box is ticked. But guess what Markets don’t tick boxes. They break them.
Overanalysis creates tighter stops smaller buffers and a mind that’s too afraid to pull the trigger.
💰 The Hidden Greed in Smart Trades
Better analysis often brings a false sense of confidence. You expect more precision more profit.
This turns into silent greed masked as logic. Suddenly you risk bigger positions because this one is obvious.
But pros don't risk more when they’re more confident. They risk consistently.
💭 The Mind That Blocks Your Profits
You didn’t lose because you didn’t know. You lost because you knew too much and became a slave to it.
When your brain seeks confirmation not clarity it sabotages trades that were ready to work.
Don't let analysis chain you to hesitation.
🔄 Analysis or Addiction
Ask yourself honestly
Are you using your analysis to take action or to avoid it
Charts should guide you not paralyze you. If you need six signals to feel safe you’re not analyzing you’re hiding.
🧃 Every Chart Has a Bias
What looks like a sell to you might be a buy to someone else.
Why Perspective. Some buy the bounce others short the breakdown.
So if your top-tier analysis still leads to losses maybe it's time to stop upgrading tools and start upgrading your lens.
🧨 The Overanalysis Spiral
Your brain can’t juggle thirty signals. But most traders try anyway.
This doesn’t make you smarter. It makes you slower more anxious and emotionally drained.
Good trading isn’t about more info. It’s about clearer action.
🧱 The Mind That Won’t Let You Win
The more you lean on your indicators the more you fear breaking their rules.
You skip solid trades just because one tool says maybe not yet.
At that point it’s not risk management. It’s dependency. Let tools guide not dominate you.
🛠️ TradingView Tools That Help Or Hurt Your Mindset
It’s not about what tools you use. It’s how you use them.
Here are a few tools that when used right can actually improve both your decision-making and emotional control:
Session Volume and VWAP
Don’t just chase setups blindly. Check price versus VWAP. Often entries you feel are great are just late reactions to intraday rebalancing.
RSI and Auto Divergence
Don’t focus on RSI values alone. Use divergence indicators that highlight hidden bullish or bearish signals. Many traders miss moves by ignoring the tension RSI reveals.
Long Short Position Tool
Try using this for mental reps. Plot fake trades. Watch how the market behaves without risking capital. Over time you’ll train your brain not just your account.
These tools won’t fix your psychology but they’ll mirror it. And that’s where real change begins
🎯 Final Thoughts
Great analysts don’t trade everything they understand.
They understand what not to trade.
If better charts aren't bringing better results stop upgrading your screen and start rewiring your mindset.
✨ Need a little love!
We pour love into every post your support keeps us inspired! 💛 Don’t be shy, we’d love to hear from you on comments. Big thanks , Mad Whale 🐋
📜Please make sure to do your own research before investing, and review the disclaimer provided at the end of each post.

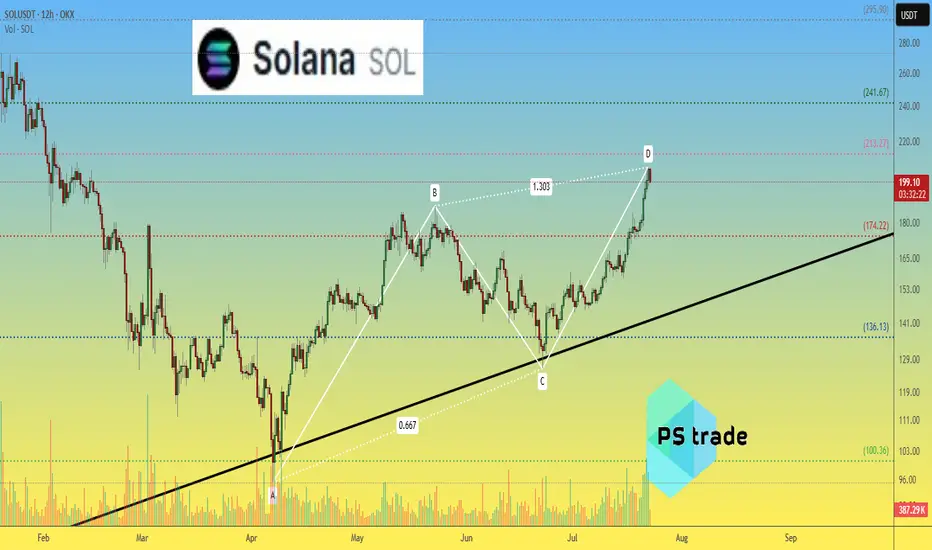
Solana SOLusdt: ABCD Completion & Reversal Candle Forming?The ABCD pattern on the 12H OKX:SOLUSDT chart is nearly complete near $213.
🔻 Current candle attempts to engulf the previous bearish one — an early reversal signal.
📊 Volume is declining after impulse — adding confluence.
📉 Correction targets:
$175 — Fibo 0.5 + support
$136 — consolidation area
$100 — start of CD move
❌ Breakout above $213 invalidates reversal scenario.
_____________________
Did you like our analysis? Leave a comment, like, and follow to get more
SOLUSDT on Fire! Bullish Wedge Fuels INSANE Upside Potential!BINANCE:SOLUSDT has been exhibiting strong bullish momentum, currently trading within a broadening wedge pattern. This technical structure often signals increased volatility and the potential for decisive moves in either direction. In the present scenario, the breakout above the psychological $200 resistance level suggests that bulls are firmly in control, fueling hopes of further upside.
The continuation of momentum hints at the market preparing for another leg up. The immediate price target lies at $300, where traders may expect some profit-taking and resistance. However, should momentum sustain and buying pressure persist, BINANCE:SOLUSDT has the potential to surge toward the $700 region, aligning with the pattern’s projected price expansion.
As always, managing risk is key. Use a well-placed stop loss below the support level to protect your capital. Breakouts can be explosive, but discipline and proper risk management make all the difference.
BINANCE:SOLUSDT Currently trading at $201
Buy level : Above $200
Stop loss : Below $150
Target 1: $250
Target 2: $300
Target 3: $500
Target 4: $700
Max leverage 2x
Always keep stop loss
Follow Our Tradingview Account for More Technical Analysis Updates, | Like, Share and Comment Your thoughts

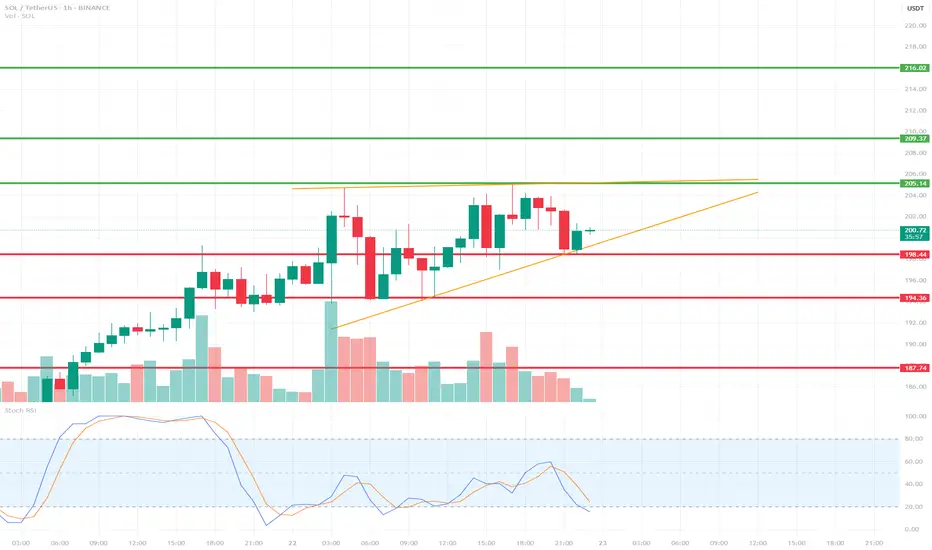
SOLUSDT 1H Short-Term🔍 Technical Structure:
Short-Term Trend:
SOL is currently in an uptrend, with local higher lows. This is evident from the orange uptrend line, which has been tested multiple times.
Local Resistance:
205.14 USDT – yellow line – a resistance level that the price has touched several times but failed to break (this could be a double-top formation).
Local Support:
198.48 USDT – the price is currently testing this level as support.
194.36 USDT – lower, more crucial support (stronger upon a trend breakout).
187.74 USDT – important support that would be tested in the event of a larger breakout.
📉 Oscillator – Stoch RSI:
The Stoch RSI is currently in oversold territory (below 20), suggesting the possibility of a local rebound.
However, there has been no upward crossover yet, so there is no strong buy signal.
🔊 Volume:
We are observing a decrease in volume during the current correction, suggesting that the declines are relatively weak – there is no strong supply impulse.
🧠 Short-term scenarios:
✅ Bullish scenario:
Price is rebounding from the trend line (orange) and the 198.48 USDT level.
A break of the 205.14 USDT resistance could open the way to:
209.37 USDT
216.02 USDT (next target)
❌ Bearish scenario:
A break of the trend line and the 198.48 USDT level with the 1-hour candle closing below.
Possible decline to:
194.36 USDT (first support)
and further to 187.74 USDT if selling pressure increases.
Shiro is about to explode in the next few daysWith a real potential of +20,000%, Shiro is on track to join the top meme coins.
This year, the target is clear: $2 billion+ market cap — or even more.
This is your chance to buy the bottom.
Don’t wait until it hits $500 million market cap to jump in.
Remember Pepe... Floki...
Those who got in early made life-changing gains. The rest just watched.
Do your research, check the chart, and get in while you still can. BINANCE:BTCUSD COINBASE:ETHUSD COINBASE:SOLUSD CRYPTO:SHIROUSD BINANCE:SHIBUSDT

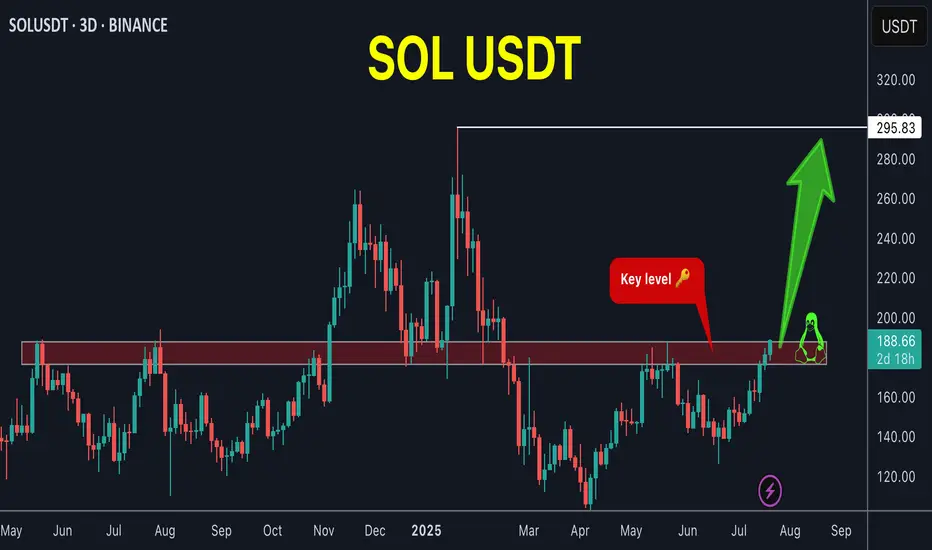
SOL is preparing for new ATHSOL / USDT
Solana didn't make a move since long time but i think its time will come very soon
Currently SOL is trying to breakout the most important key level in chart
Breaking out here => very high chance of making a new ATH
For those who interested in SOL …its the time
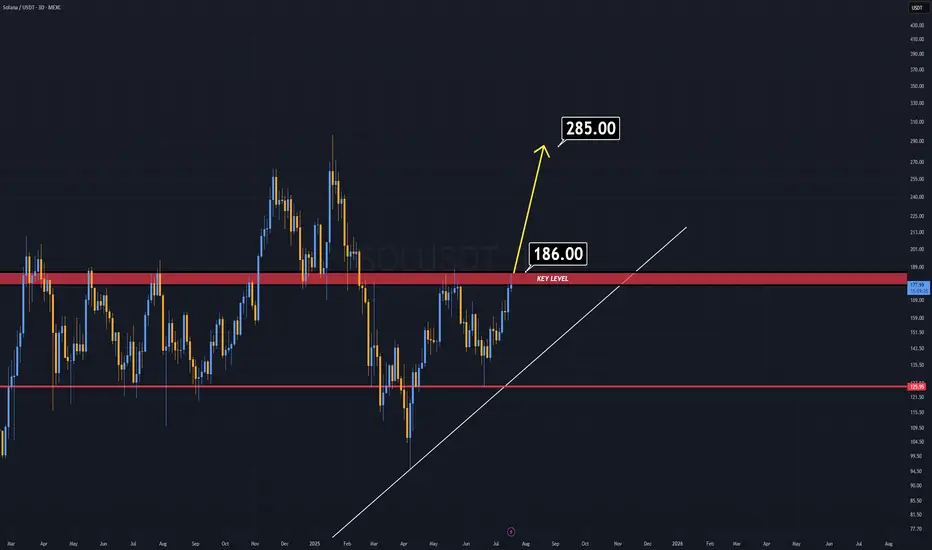
SOL Analysis (3D)There is no need to explain why if you are in this market for a while.
A weekly candle close above $186 will ignite a rally on SOL.
The important key word in here is "weekly" , not "daily" .
Good Luck.
Solana About To Gain Bullish Momentum Towards $420, Later $1000+It seems like Solana has been taking forever to grow, to recover; it seems like a long time. Let's do some maths. The bottom was in 7-April and we are now on July 21. 98 days. A little over three months. That is how long it has taken Solana to move back above $200. Seeing that the all-time high is $295, this isn't a long time, we are getting close to resistance and this resistance will break easily just as it happened with Bitcoin. Solana is set to grow to $420 mid-term and this bull market is likely to give us a target of $620 and potentially $1,000. $1,000 is the bright spot we want to hit on the bull run phase.
Why aim so high? Because the correction was really small in comparison to Solana's major bullish cycle since 2022. Solana crashed and crashed really hard but this hard-crash led to the strongest bullish cycle ever. Only in January 2025 did Solana stop too breathe and it did so by doing a 60% drop-market flush. With this drop over, Solana can produce the continuation of its long-term, eternal bullish cycle. Higher and higher, week after week, month after month.
If you are a Solana holder I just want to tell you to be patient on this pair. All the gains that have not been done in the past will be fulfilled in a matter of days. Solana will catch up with the rest of the giants and grow strong. Once Solana is up there at a new all-time high, the rest of the market will continue to grow.
Think of Solana behaving just like Bitcoin; when it reaches high up, instead of crashing we can experience some consolidation followed by additional growth. When we are close to the true cycle top, money will flow out of these big projects into the smaller ones, creating a major bull run.
All is good and perfect and it is early still today. Think about it, would it be late to buy below $200 when you know the potential is 1K?
Thanks a lot for your continued support.
Namaste.

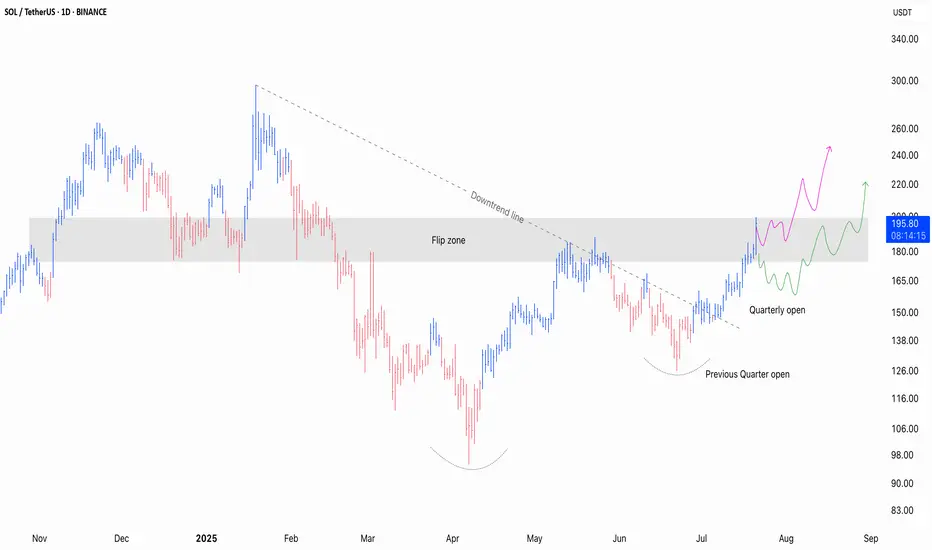
SOL / USDT - Current ThoughtsSolana’s been stealing the spotlight again and not just for the memes this time!
After months of getting smacked down at key levels, it’s finally reclaiming the lost ground with conviction. Price is grinding its way through zones that had been solid resistance for ages, flipping sentiment along the way.
The combination of structure, volume, and market psychology paints a clear story here. Let's break it down piece by piece in simple terms.
———x———x———x———
Table of Contents
⦿ Volume Profile
⦿ Key Technical Levels & Insights
⦿ Market Structure
———x———x———x———
⦿ Volume Profile
The Volume Profile offers crucial insight into where meaningful participation has taken place throughout this range and how these levels continue to influence the current structure.
Point of Control (POC) – ~145 USDT
This is the level where the highest volume changed hands during the entire consolidation. In simple terms, this is where buyers and sellers were most active in establishing positions.
The POC is like a price magnet where the market finds equilibrium when direction becomes uncertain. If bulls lose momentum, the price may gravitate back towards it.
Value Area Low – ~123.50 USDT
Below this threshold, prior market interest thinned out significantly. A breakdown here would likely accelerate downside as it signals acceptance below value, typically inviting stronger bearish flows and forcing trapped longs to capitulate.
Value Area High – ~213 USDT
This area marks a logical short-term upside target if the current rally can sustain its footing. VAH is where the prior range began to thin out and sellers historically pushed back. If buyers want to reclaim control, this is a key level to watch.
Currently, the price has cleanly reclaimed the POC and is now pressing into what I’d define as the Flip Zone (an area where former resistance is getting retested as potential support). Acceptance above the VAH will lead a rally towards the ATH.
⦿ Key Technical Levels & Insights
Several key factors are aligning here to create a compelling case and it’s about the broader narrative these levels are constructing together.
Quarterly Open – ~150 USDT
The recent breakout and push above the QO shows a clear intent buyers' intent. It’s a important reference point for ongoing structure.
Yearly Open – ~188 USDT
Reclaiming the Yearly Open is rarely a trivial event. Currently, the price is flirting with the YO. If the price manages to reclaim it with a strong push, it'll shift the broader sentiment back in favour of the bulls.
Flip Zone – 175–190 USDT
This zone has historically been a battleground, serving as both support and resistance since March 2024. A clean breakout above this zone won't just clear resistance, it'll open the door for further upside as sidelined participants as well as trapped shorts will be forced to react.
Downtrend Line – Broken
The trend line that was established earlier this year has been breached now, adding another positive factor for the bulls.
200 EMA / 200 SMA – ~163 USDT
Both KMAs are converging here, adding weight to this level as a reference for long-term trend direction. Price reclaiming and holding above these MAs often signals a meaningful shift in market sentiment.
The confluence of reclaiming major opens, breaking downtrend resistance, and positioning above critical moving averages strengthens the bullish case.
⦿ Market Structure
The current structure shows a market transitioning from bearish exhaustion, through a phase of accumulation, and now stepping confidently into breakout territory.
Double Bottom Formation (April lows ~95 USDT to recent highs):
This is a textbook accumulation. It’s not a fast V-shape reversal but a slow build. These kinds of structures often lay the groundwork for sustained trends.
Higher Lows in Place: 95 → 126 → 150 → 190 USDT
Each successive low is higher than the last, showing consistent buyer strength and deliberate positioning by participants with a longer-term view.
Breakout Above Prior Range Highs (187–190 USDT):
This area acted as clear resistance in previous attempts, capping price for months. Once this range is reclaimed with force, expect higher prices for multiple weeks/months.
TLDR
✅ Current Bias: Bullish while above 175–190 USDT.
✅ Structure: Breakout of multi-month downtrend, reclaiming key levels.
✅ Volume: Strong above POC, targeting Value Area High next.
✅ Invalidation: Failure below 150 USDT flips bias back to bearish.
I’m only focused on bullish continuation or healthy pullback scenarios for now, as I plan to keep holding my existing spot positions.
If you found this breakdown helpful, drop a like and let me know your thoughts in the comments. Always keen to hear how others are seeing the market. 👇
⚠️ Disclaimer
As always, this post is purely for educational purposes. I am not a financial advisor, and nothing here should be taken as financial advice. Always consult your financial advisor before making any investment or trading decisions. Or at the very least, consult your cat. 🐱
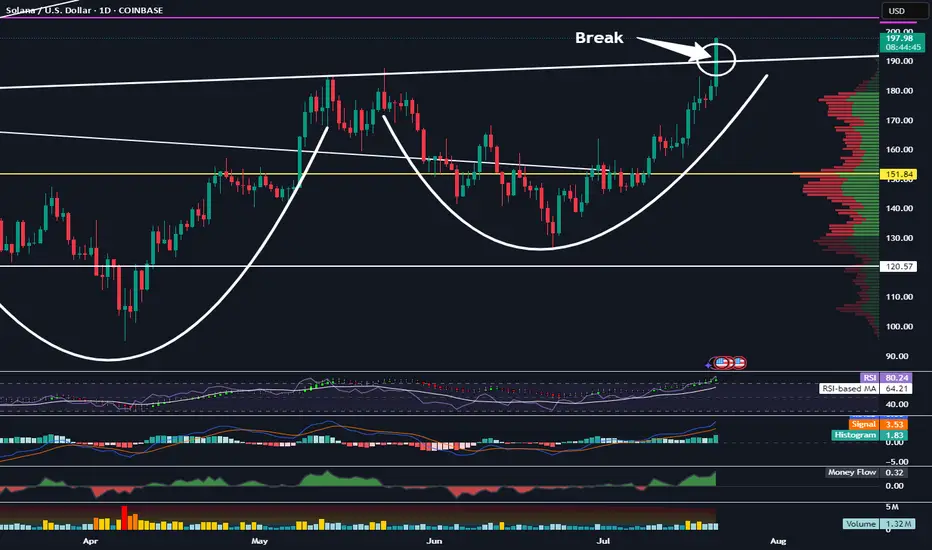
Solana Has Broken This Important Resistance LevelTrading Fam,
Things are definitely heating up in the altcoin space. Two big key movers are ETH and SOL. Right now SOL has broken a very important resistance level in the neckline of this inverse H&S pattern. Watch closely. If the body of our daily candle closes above this today and remains above it tomorrow, this pattern is in play and our target would be around $275.
✌️Stew
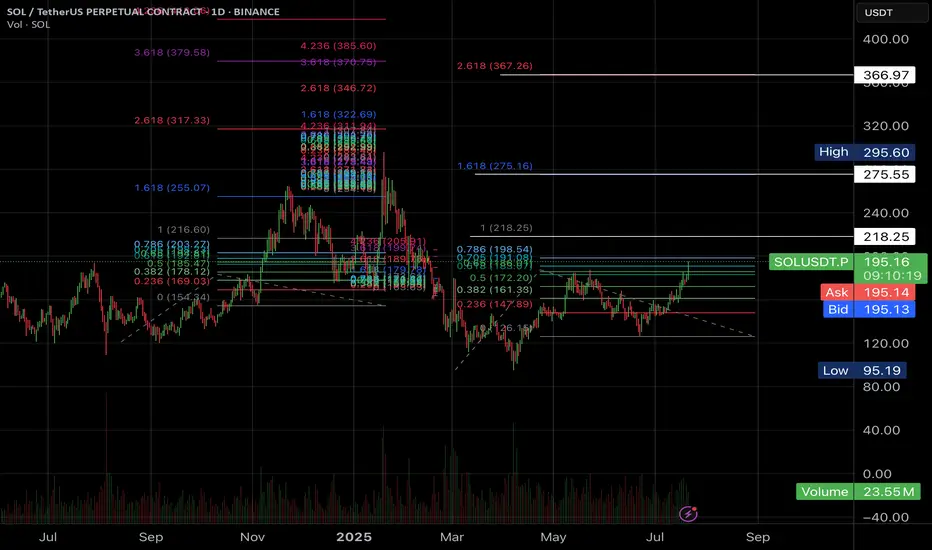
#SOL for 367$?Hi Padawans,
Hope you’re all doing well.
The charts don’t lie — but remember, this isn’t financial advice.
I’m currently eyeing long positions up to the levels highlighted in the chart.
Best regards,
CryptoObi
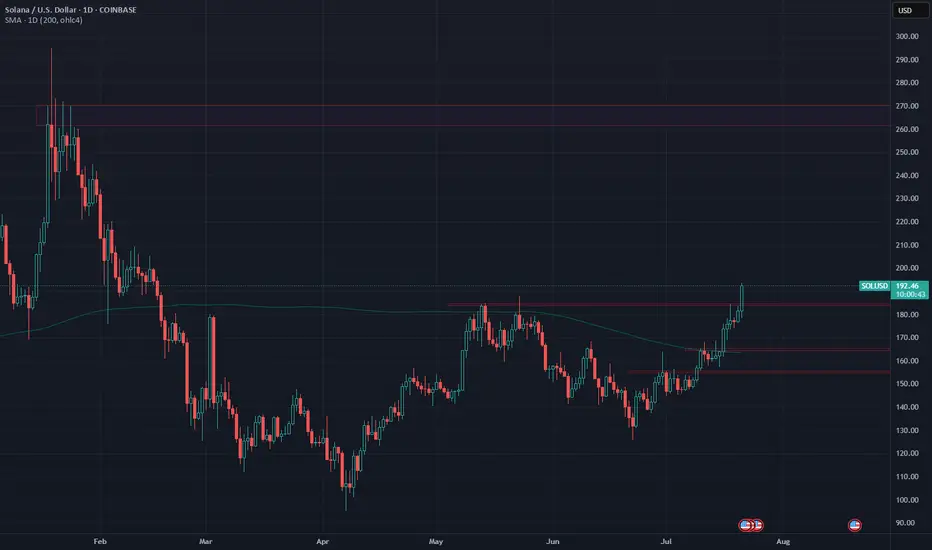
Solana Enters Bullish TerritorySOL has been showing strength since it reclaimed the 1D 200MA last week.
Currently trading around $192 - above May's highs - continued bullish momentum could see price test Jan highs around $270.
Until then, any retracement could be a buying opportunity.
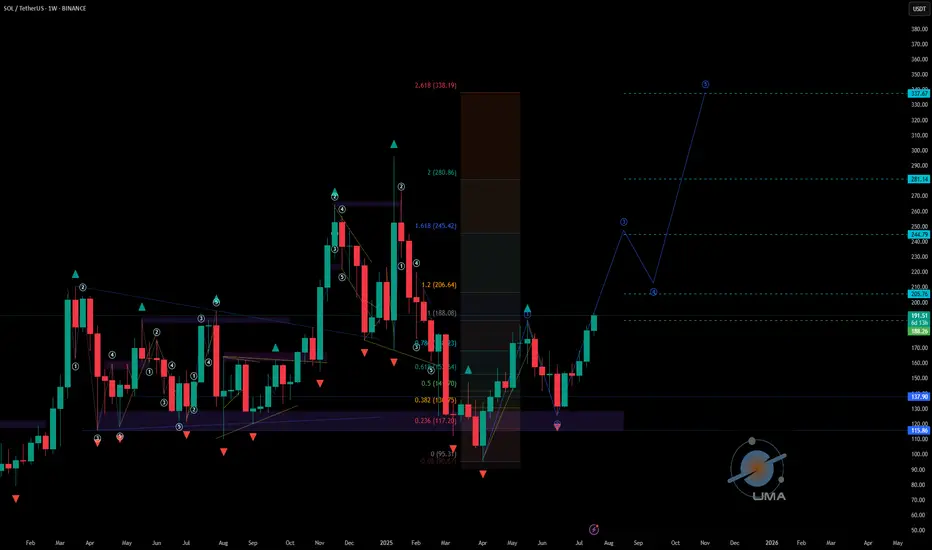
SOLUSDT - UniverseMetta - Analysis#SOLUSDT - UniverseMetta - Analysis
The price on W1 formed a double 3-wave structure. It is also worth considering the previous development for 2-3 months to reach all levels and update ATH. Against the background of the growth of all other assets, and the possibility of the beginning of the altseason, this pattern can be considered for a set of positions in the portfolio. The nearest targets will be at the level of 206 - 245. When the entire structure is realized, we can see a price of 338 per asset. Observe the risks.
Target: 206 - 338
Bullish SOL Setup: $350, $480, $600 Main Price TargetsHello✌
Let’s analyze Solana’s upcoming price potential 📈.
BINANCE:SOLUSDT , I expect a long-term upward bullish trend.
There are three main targets in this analysis: $350, $480, and a final target of $600, which could be reached within 2 to 6 years.
The price may form parallel channels at times, which are shown on the chart. I also expect the current bullish channel to remain valid and continue upward.
✨We put love into every post!
Your support inspires us 💛 Drop a comment we’d love to hear from you! Thanks , Mad Whale🐋
🐋Many of the points and levels shown on the chart are based on personal experience, feeling, and over 7 years of research and daily study of crypto charts.
Some of the lines, channels, and price zones are drawn to make the chart easier to understand and to help imagine possible future price movements.
I’ve also included one very big drop in price even bigger than the others because in the crypto market, it’s common for prices to suddenly fall hard and push out small investors and traders with positions.
The targets on the chart are not guaranteed; they might be reached, or they might not.📚
📜Please make sure to do your own research before investing, and review the disclaimer provided at the end of each post.
