SOLANA: $1,000 Incoming?This chart shows how Solana (SOL) follows market cycles, long periods of low prices (accumulation) before big price spikes (breakouts).
- We’re in a similar phase to 2021, just before SOL’s last huge rally.
- $500 and $750 are key resistance levels—breaking them could send SOL much higher.
- Alt & Meme Season matters—when memes pump, demand for SOL rises.
- Bitcoin’s bull run is key, when BTC moves up again, SOL will likely follow fast.
- Price could rise quickly past $1,000 once key levels break.
Solusdt

Solana Market Analysis according to current market ( SOL )
Timeframe: 4 Hours
As observed over the past few days, Solana has experienced a significant downward move, which was expected. If you look at the chart, a pennant pattern had formed, which was squeezing and eventually broke to the downside. This breakdown led to a complete fulfillment of the supply zone, with Solana’s price moving toward the 155–165 range, which acted as a strong order block and support zone.
This move confirms two key points:
Strong Order Block: The 155–165 zone is a robust support area and order block.
BTC Correlation: Bitcoin has also been moving toward its strong support zone (89k–92k), which aligns with Solana’s price action.
Two Possible Scenarios for Solana
Scenario 1: Demand Creation at Current Levels (Higher Probability)
Solana is likely to create demand from its current levels, with two strong zones to watch:
$195 Zone: A key level where demand could materialize.
$230 Zone: A secondary target if the price gains momentum.
This is the more probable scenario, where Solana stabilizes and creates demand, either at
195 or 230, leading to a potential upward move.
Scenario 2: Further Downside (If BTC Breaks Support)
If Bitcoin breaks its strong support zone (89k–92k), which seems increasingly likely, Solana could experience another significant downward move. In this case, Solana might break below the 150–140 range, leading to a further decline. This would mirror the previous supply-driven move, potentially taking Solana much lower.
Summary
Current Support Zone: Solana has found support in the 155–165 range, which is a strong order block.
Scenario 1 (Higher Probability):Demand creation at 195 or 230, leading to an upward move.
Scenario 2 (If BTC Breaks Support): Further downside, potentially breaking the 150–140 range.
Note
My goal is to simplify the chart and help you understand the price action clearly. I avoid overloading the chart with unnecessary indicators or creating confusion. My analysis focuses on keeping the chart clean and straightforward.
Thank you!


SOL - Birbs eye view!PRETTY amazing to see sol to come to 151.12 to again move to 246, i am marking direct stances with regards to Quasimodo being formed, Matter of fact wont fomo here to buy here before would Limit wait for it to come to 162.1 and 50% more at the down mentioned

Phemex Analysis $60: How to Trade SOL Amidst the FTX UnlockThe FTX’s decision to unlock 11.2 million SOL tokens (worth around $2 billion) at March 1st has sent shockwaves through the market. Fear of a potential sell-off has triggered panic among investors, leading to a sharp decline in SOL’s price from $200 to the $160 area.
With uncertainty in the air, traders are now asking: Will SOL continue its downward spiral, consolidate, or stage a strong comeback? In this analysis, we’ll explore three possible scenarios and how to trade them like a pro.
Possible Scenarios
1. Continued Downward Trend – More Selling Pressure Ahead?
Currently, SOL has dropped into the $165-$155 support zone, but if fear continues to dominate and selling pressure increases, further downside is possible. Key support levels to watch:
• $135-$126 – A critical demand zone where buyers may step in.
• $110 – A strong historical support level that could serve as a bottom.
For long-term investors, this could be an opportunity to accumulate SOL at a discounted price. However, for those who entered near $200, this scenario is less favorable.
Pro Tips:
• Use scaled orders to gradually enter the market instead of going all-in at once.
• Set limit buy orders around key support zones to secure an optimal entry.
• Monitor volume and Relative Strength Index (RSI)—if SOL becomes oversold on high volume, it could signal a potential reversal.
2. Bouncing Between $155 & $210 – A Range-Bound Market
While some traders fear a deeper decline, institutional buyers and long-term holders may step in to absorb the selling pressure. This could lead to a sideways trading range between strong support at $155 and resistance at $210.
Pro Tips:
• Use grid trading bots to capitalize on price swings:
• Start a long grid bot near the $155 support level to profit from rebounds.
• Start a short grid bot near the $210 resistance level to take advantage of pullbacks.
• If SOL repeatedly tests $210 but fails to break through, consider taking partial profits.
• Stay cautious—if the $155 support fails, be ready to adjust strategy for a deeper correction.
3. Breakout Rally – A Surprise Upside Move?
While less likely, a major bullish catalyst—such as the approval of a Solana ETF—could spark a breakout. If SOL gains regulatory or institutional backing, it may defy expectations and surge past resistance levels.
Pro Tips:
• Watch for a breakout above $210 with strong volume—this could signal a move toward $250+.
• Consider momentum trading strategies, setting stop-loss orders below $200 to manage risk.
• Stay updated on ETF-related news and broader crypto sentiment.
Final Thoughts
All eyes are on March 1st, when FTX’s SOL unlock event could bring heightened volatility. Whether SOL drops further, consolidates, or stages a breakout, traders need to stay alert and adjust their strategies accordingly.
• For bulls: Look for accumulation zones and wait for a confirmed reversal.
• For range traders: Take advantage of price swings between support and resistance.
• For breakout traders: Keep an eye on volume and fundamental catalysts.
No matter which scenario plays out, staying disciplined, managing risk, and reacting to market conditions is key to trading SOL like a pro.
🚀 How are you planning to trade SOL during this event? Drop your thoughts below! 🚀
Pro Tips:
Trade Smarter, Not Harder with Phemex. Benefit from cutting-edge features like multiple watchlists, basket orders, and real-time strategy adjustments. Our unique scaled order system and iceberg order functionality give you a competitive edge.
Disclaimer: This is NOT financial or investment advice. Please conduct your own research (DYOR). Phemex is not responsible, directly or indirectly, for any damage or loss incurred or claimed to be caused by or in association with the use of or reliance on any content, goods, or services mentioned in this article.

SOL how have you been?SO SOLANA is trying to recover from here but ideal recovery position is from the stances marked, Expecting moves till both nPoC's. Very good swing buys!

SOL/USDThello friends
Due to the price drop and the new bottom, now we have two scenarios:
1_ According to its downward trend, the price hits the resistance range and hits a new bottom.
2- The price succeeds in breaking the resistance range and our trend becomes upward.
In our opinion, scenario 1 is more tolerant.
*Trade safely with us*

SOLUSDT - Long Trade IdeaTrade Details:
Entry : Buy at the current market price or place a buy limit at $160
Stop Loss : $152
Take Profit :
Reason for Trade:
SOL is showing strong bullish momentum and trading near a key support level.
Potential rebound from the demand zone around $160.
Favorable risk-to-reward setup with a tight stop-loss.
Disclaimer : This trade plan is for educational purposes only and not financial advice. Always conduct your own research and risk management before trading.

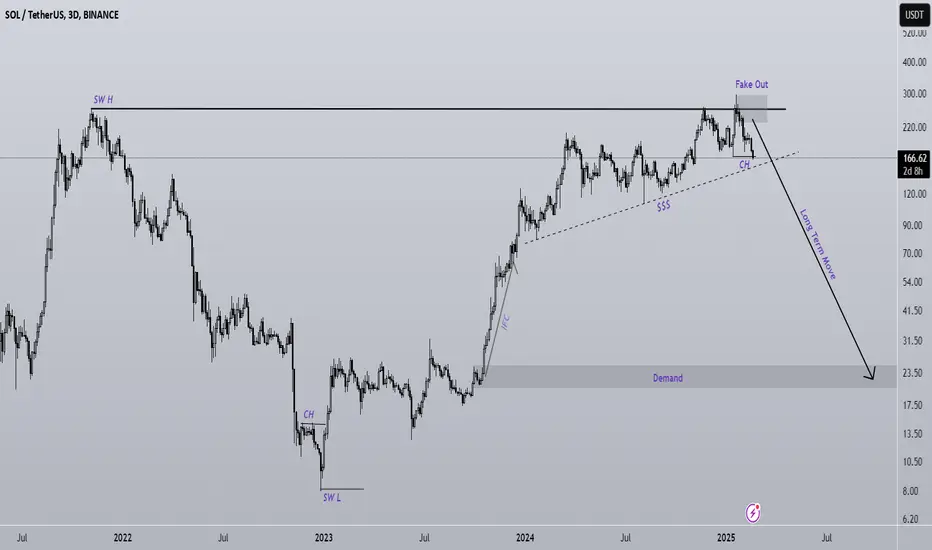
The bearish superwave of SOL has begun (3D)It seems that the The bearish superwave of SOL has begun.
A large liquidity pool has formed below the price, which is likely to break soon.
The all-time high has been broken falsely. This could lead to heavy drops in the weekly timeframe.
In the mid-term and long-term, Solana appears bearish.
Do not enter the position without capital management and stop setting
Comment if you have any questions
thank you
SOLANA price is retesting for another bull run?#solana #sol price is now again testing the major support zone. Also, this may be the retest of CRYPTOCAP:SOL price to have another bull run. If #solusd loses 140 usd region , then the invalidation of bullish retest will occur.

MKRUSDT UPDATEMKRUSDT is a cryptocurrency trading at $1,116. Its target price is $1,700, indicating a potential 55%+ gain. The pattern is a Bullish Falling Wedge, a reversal pattern signaling a trend change. This pattern suggests the downward trend may be ending. A breakout from the wedge could lead to a strong upward move. The Bullish Falling Wedge is a positive signal, indicating a potential price surge. Investors are optimistic about MKRUSDT's future performance. The current price may be a buying opportunity. Reaching the target price would result in significant returns. MKRUSDT is poised for a potential breakout and substantial gains.

Solana: Poised for a Breakout Towards a New All-Time HighSolana (SOL) is currently trading at the expanding channel support level of $163.69, a critical demand zone that presents a strategic entry point for long positions. A successful rebound from this level could drive the price toward the initial resistance at $206.38.
If SOL manages to break above and sustain momentum beyond this minor resistance, it could confirm a bullish continuation, targeting the expanding channel resistance. A breakout at this level would pave the way for a potential rally towards a new all-time high at $327.32.
However, if SOL fails to hold the expanding channel support and experiences a breakdown, selling pressure may intensify, pushing the price toward the major support level at $124.29. This level could serve as a crucial re-entry point for buyback opportunities.
Fundamental analysis :
On March 1, 2025, approximately 11.2 million SOL tokens—equivalent to 2.29% of the total supply—are scheduled to be unlocked. This event could introduce significant downward pressure on SOL's price, potentially triggering a bearish movement as market participants anticipate increased sell-side liquidity.

SOL Retesting the Descending ChannelBINANCE:SOLUSDT drops back to retest the descending channel.
The last two times it touched this level, it held and bounced up.
Let’s see if it can hold again this time—if not, it might drop to $146.
From the last two experience of bouncing back, we might know if it can hold this key support within a week.
🔴 Read my signature & publications for more info you don’t want to miss.
🔥 for more future "guesses" like this!

SOL/USDTThere is a breakout of the January low + complete filling of the daily FVG. Growth targets:
Target 1 = 220
Target 2 = 244
Target 3 = 271

SOL/USDT – Critical Reversal or Major Breakdown?🚀 Key Market Insight:
Solana ( BINANCE:SOLUSDT ) is testing a high-stakes demand zone at $156-$162, aligning with major trendline support and previous liquidity grabs. This level will dictate the next big move—a strong bounce could fuel a rally, while a breakdown may trigger a deeper correction.
🛑 Key Levels to Watch:
✅ Support Zone: $156-$162 – Holding above = potential reversal.
🚨 Break Below $154: Could lead to $145-$135 and lower targets.
⚡ Resistance to Reclaim: $182, $195, $204, $212, and $219.
🧠 What to Look For:
🔹 Bullish Signal: Price reclaims $170+ with strong volume → Higher targets unlocked.
🔹 Bearish Signal: Price fails to hold $154 → Expect deeper downside.
🔹 Liquidity Trap? Smart money may hunt stop-losses before a reversal— watch for fakeouts .

$SOL: warning!**🚨 CRYPTOCAP:SOL Analysis: Major Unlock & Market Impact 🚨**
📅 **March 1st Unlock:**
Approximately 11.16 million SOL tokens (~$2 billion) are set to be released into the market.
🔗 Source: (www.eblockmedia.com)
### **What’s Happening with CRYPTOCAP:SOL ?**
After the $TRUMP pump, Solana faced a significant pullback, which was expected after such hype. However, a more concerning effect of the meme craze is the liquidity drain from the Solana ecosystem.
🔻 **Liquidity Issues:**
- Rug pulls often result in selling SOL for cash, CRYPTOCAP:USDT , or even $CRYPTOCAP:BTC.
- Exchanges like Raydium and Meteora made huge profits from fees in SOL and typically "sell to cash out".
This has led to a liquidity squeeze, causing a prolonged consolidation.
📉 **Technical Outlook:**
- Daily timeframe: Consolidation appears to be ending, and MACD is about to cross bullish, signaling a short-term relief for 1-2 weeks.
- Weekly timeframe: The bearish divergence remains strong and still needs to play out.
- A double top bearish pattern is identified, likely to push the price down.
⚠️ **March 1st Unlock - The Biggest Bearish Factor**
While 11M SOL represents only 2% of circulating supply, it comes at a bad time, adding selling pressure just as the ecosystem struggles with bearish sentiment.
### **Price Outlook:**
🛑 Short-term impact: Likely downside pressure.
✅ Long-term: Solana remains a solid and popular blockchain—it will recover.
**📉 Price Targets:**
- $160 or lower seems likely.
- Worst-case scenario: $120 , which is a major support level.
💡 Potential Buy Opportunity for long-term holders!
**DYOR!**

Breaking News - SOL MartyBoots here , I have been trading for 17 years and sharing my thoughts on SOL here.
SOL looks bad overall and this news may make SOL drop more
Do not miss out on SOL as this can affect the entire market
Watch video for more details

Sol short/Bearish!Here is another idea for the sol, it is falling from the pattern with double top on 1D time frame. Let's see how it goes.
Bounce zones are marked on previous idea!

Solana (SOL) Faces Major Trouble – Could Drop Below $170 SoonSolana’s struggle below $200 continues, now down 17% from its monthly highs above $220. Despite previous bullish momentum, SOL is facing serious downside risks, with multi-month support levels in danger.
🔻 Why Is Solana Dropping?
- Memecoin Controversy – Scams linked to LIBRA, Pumpfun, and Meteora have shaken investor confidence.
- Declining TVL & Volume – TVL fell from $12B to $8.9B, while trading volume collapsed from $35B to $2.5B.
- Open Interest (OI) Drops – Fell from $6.5B to $4.1B after rejection from its ATH of $296.
🔍 Technical Breakdown Signals Bearish Divergence
📌 Breaking Below 200-Day MA ($183.47) – SOL is losing critical support.
📌 OBV Downtrend – Lower highs and lows confirm bearish divergence.
📌 Pivotal Resistance Zone: $181.99 - $178.50 – If bulls fail to hold this range, expect a drop below $170.
What’s Next for SOL?
- Bullish Case: SOL needs to reclaim $185+ quickly to regain momentum.
- Bearish Case: If support at $178 fails, SOL could dip below $170 this week.
With memecoin uncertainty hitting Solana’s ecosystem, will the bulls step in, or is a deeper drop coming?

Sol turning bearish!Sol swept the highs but failed (which was a short signal). Marked zones are the bounce levels, first zone has been tapped already with bounce, now it is showing weakness in the zone, next zones are untapped, so a bounce at marked levels is highly likely, however if first zone breaks, I will look for swing short.
In short, marked zones are good for long, if broken, we can look for short at the bounce.

ELFUSDT UPDATEELFUSDT is a cryptocurrency trading at $0.3090. Its target price is $0.5000, indicating a potential 60%+ gain. The pattern is a Bullish Falling Wedge, a reversal pattern signaling a trend change. This pattern suggests the downward trend may be ending. A breakout from the wedge could lead to a strong upward move. The Bullish Falling Wedge is a positive signal, indicating a potential price surge. Investors are optimistic about ELFUSDT's future performance. The current price may be a buying opportunity. Reaching the target price would result in significant returns. ELFUSDT is poised for a potential breakout and substantial gains.


SOL/USDT 4H Chart ReviewHello everyone, let's look at the 4H SOL to USDT chart, in this situation we can see how the price has moved sideways from the downtrend line, while currently we see movement in the triangle marked with blue lines, in which we are also approaching the exit, and therefore the price should take the direction of movement.
Let's start by defining the goals for the near future that the price must face:
T1 = 206 USD
T2 = 224 USD
Т3 = 239 USD
Т4 = 255 USD
Now let's move on to the stop-loss in case the market continues to fall:
SL1 = 192 USD
SL2 = 174 USD
SL3 = 160 USD
SL4 = 146 USD
When we look at the RSI indicator, we can see how energy is approaching the lower limit of the range and here we can see that we often had descents significantly below the lower range, but we are approaching the zone where we could previously observe price rebounds.
