SOLUSDT - Buy high sell higher!More than 300 days trading above 125$
Take this whole time of consolidation to make a bullish pennant pattern in 7d chart
Sol looks bullish as BTC keep going high and higher
We are five days away from the weekly close
And it's obviously sol looking for breakout... successful breakout will take us to 400$ in midterm
Best regards Ceciliones 🎯
Solusdt

Solana vs. Ethereum: The Battle for Blockchain SupremacyThe cryptocurrency market is dynamic, constantly evolving with new technologies and innovative projects. Solana (SOL) and Ethereum (ETH) are two of the most prominent players in this space. Both platforms have made significant strides in recent years, attracting developers and investors alike. However, as the cryptocurrency market continues to mature, the question arises: Will Solana be able to challenge Ethereum's dominance, or will ETH maintain its position as the leading blockchain platform?
Solana's Rise to Prominence
Solana, a high-performance blockchain platform, has gained significant traction due to its ability to process many transactions per second at a low cost. This scalability advantage has made it attractive to developers seeking to build decentralized applications (dApps) that require fast and efficient transaction processing. Solana's unique Proof-of-History (PoH) consensus mechanism, combined with its parallel processing capabilities, enables it to achieve impressive transaction speeds.
One of the key factors driving Solana's popularity is its vibrant ecosystem. A growing number of dApps, including decentralized exchanges (DEXs), non-fungible token (NFT) marketplaces, and DeFi protocols, are being built on the Solana platform. This expanding ecosystem has led to increased demand for the SOL token, which is used to pay transaction fees and secure the network.
Ethereum's Enduring Dominance
Despite the emergence of strong competitors like Solana, Ethereum remains the undisputed leader in the blockchain space. Its long-standing history, extensive developer community, and robust security infrastructure have solidified its position as the go-to platform for many dApps. Ethereum's transition to a proof-of-stake (PoS) consensus mechanism, known as The Merge, has further enhanced its scalability and energy efficiency.
Moreover, Ethereum's dominance in the DeFi and NFT markets is undeniable. A vast array of DeFi protocols, including lending platforms, decentralized exchanges, and yield farming platforms, are built on Ethereum. The platform's popularity in the NFT space is evident from the success of projects like CryptoPunks and Bored Ape Yacht Club.
The Battle for Market Share
As the cryptocurrency market enters a period of increased volatility and potential altcoin season, the competition between Solana and Ethereum is likely to intensify. Solana's scalability advantages and growing ecosystem could attract more developers and investors, leading to increased demand for the SOL token. However, Ethereum's established position, strong developer community, and ongoing technological advancements may enable it to maintain its dominance.
The outcome of this battle will depend on several factors, including:
• Network Performance: Both platforms will need to continue to improve their network performance and scalability to meet the growing demand for decentralized applications.
• Developer Adoption: Attracting and retaining top developers will be crucial for both platforms.
• Security: Ensuring the security of the network and protecting users' funds is paramount.
• Regulatory Environment: The regulatory landscape for cryptocurrencies could significantly impact the adoption and growth of both platforms.
Conclusion
While Solana has emerged as a strong contender in the blockchain space, Ethereum's established position and ongoing development efforts make it difficult to displace. The future of the cryptocurrency market is uncertain, and both platforms will need to adapt to evolving technologies and changing market dynamics. Ultimately, the success of Solana and Ethereum will depend on their ability to deliver value to users and developers.

SOLANA (SOLUSDT) 4H Timeframe, BIG LONG TRADE Targets Done!SOLANA (SOLUSDT) 4H Timeframe Trade Overview:
Position: Long
Entry: 143.38
Targets: TP1 (148.33), TP2 (156.32), TP3 (164.32), TP4 (169.26)
Stop Loss: 139.39
Performance Recap: Solana surged and achieved all targeted levels in this 4H trade setup. Riding above the Risological dotted trend line, the bullish momentum was strong enough to reach TP4, capping a well-structured move.
Market Stats:
Volume: 3.98M
Average Volume (30D): 9.02M
Performance:
Weekly: +8.96%
Monthly: +15.53%
Year-to-date (YTD): +77.77%
Annual: +451.45%
Analysis : With sustained volume and remarkable performance metrics over the past year, Solana’s upward trend reinforces the bullish sentiment. Given the fulfilled targets, it’s wise to monitor volume and possible retracement levels for future entries.
This setup exemplifies a solid risk-reward scenario, demonstrating precision in capturing price momentum across predefined take-profit levels.

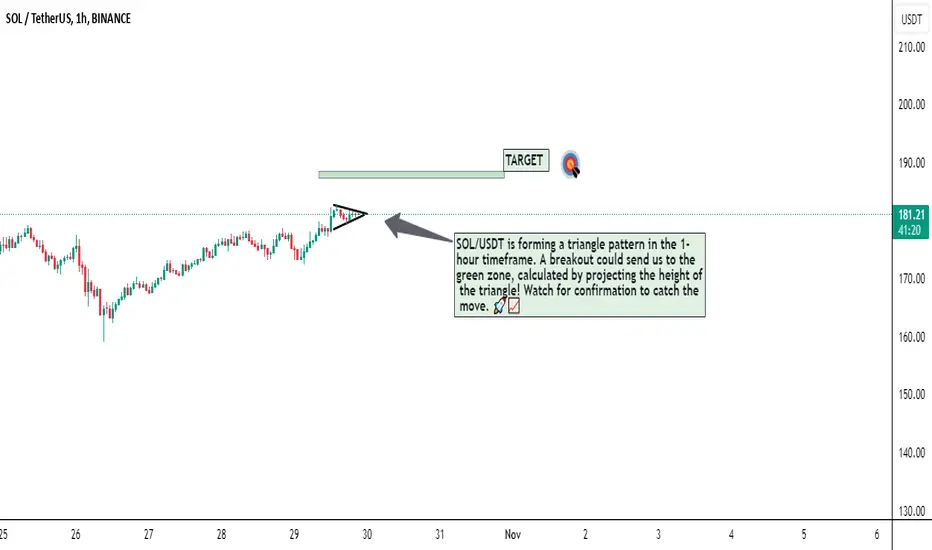
SOL/USDT Triangle Breakout Incoming? Targeting the Green Zone!Looking at a potential breakout for SOL/USDT in the 1-hour triangle setup. If we break out, the green zone is my first target – aligned with the triangle’s height projection
SOL/USDT: Bull Flag Breakout: Potential 10x Opportunity Ahead!Hey everyone!
If you’re finding value in this analysis, don’t forget to hit that 👍 and follow for more updates!
SOL is looking very promising on the higher time frame. It’s breaking out of a bull flag structure on the 2-day chart. We’re just waiting for one more candle for confirmation, but once confirmed, SOL could be set for a potential 10x move. Consider accumulating on dips!
Entry Range: $145 - $175
Target: $800 - $1000
What do you think of SOL’s current price action? Are you spotting this bullish setup too? Share your analysis in the comments, and let’s ride this wave together!

Will Solana (SOL) trigger a 15% rise before the month-end?The rising DEX volumes than Ethereum have made the market participants bullish on Solana’s (SOL) price rally. The growing popularity of the Solana-based memecoins has contributed to the rise in the network activity and eventually the DEX volumes too. Meanwhile, the SOL price remains stuck within a consolidated range and demonstrates the possibility of reaching $200 in the coming days but here’s the twist.
The long-term trade suggests the SOL price is about to repeat a previous trend as the token breached the resistance but is failing to sustain above the gains. The recent drop from the levels close to $180 suggests the bulls are facing some exhaustion, which could remain only for a short time frame.
The weekly chart suggests the price testing the resistance of the decisive symmetrical triangle. In an attempt to breach above the range, the bulls have lost strength but as long as the levels remain elevated above $170, the probability of a rebound remains high. In such as case, a monthly close above the level could trigger a notable rise beyond $200 may materialise in a short while. Besides, in the short term, the selling pressure has increased which has paved the way for a small pullback.
However, a rise above $178 may invalidate the bearish scenario and a rise above $180 could validate a strong ascending trend for the Solana (SOL) price rally.

SOLUSDT range market with potential for huge gain Hello and greetings to all the crypto enthusiasts, ✌
SOLUSDT is one of the most promising assets in the crypto market and my favorite stock. I previously shared its upward charts with you, and in this analysis, we will have a brief overview of its future behaviors. 📚
As is clearly evident, the price is in a parallel channel, forming close highs and lows, indicating that the market for this asset is ranging. The most important resistances and supports are marked on the chart. 💡✌
For further upward movement, the price needs to break its main resistances. During this process, we may witness ranging candles or even some downward candles, but our overall outlook is bullish. ✔🙌📚
Our team’s perspective on this asset is that it has the potential for significant upward movement following the ranging phases. 🙌
Thank you for your attention. If you have any questions or comments, I’m here to respond to you. 🐋

Solana decline levelsThese in green and red lines solana deline levels, After touching these levels Solana could decline.
Note: This is not a buy /Sell Call. Trader at your own decisions.

#SOL/USDT
#SOL
The price is moving in an ascending channel on the 1-hour frame and is sticking to it well
We have a bounce from the lower limit of the descending channel and we are now touching this support at a price of 169
We have an upward trend on the RSI indicator that is about to be broken, which supports the rise
We have a trend to stabilize above the moving average 100
Entry price 176
First target 185
Second target 191
Third target 198

BTC and SOL Form Bullish Cup and Handle PatternBINANCE:BTCUSDT and BINANCE:SOLUSDT technical analysis update.
BTC and SOL are showing similar chart patterns, each forming a cup and handle. Currently, both SOL and BTC prices are trading within the handle, moving toward a potential breakout. If this breakout occurs, we could see a strong bullish move in both assets.
SOL has already risen 2600% from its bottom, and a breakout could potentially lead to a further 200-500% increase. BTC, on the other hand, has gained 360% from its bottom, and a breakout from this cup and handle pattern could yield an additional 100-200% upside.

SasanSeifi| Will the $185 Resistance Break? Hey there, ✌In the weekly timeframe, as shown in the chart BINANCE:SOLUSDT , the price, after a prolonged consolidation phase, surged from the $30 price range with a notable upward trend, reaching as high as $200. This significant bullish movement stalled upon encountering the $200 supply zone, leading to a correction and a phase of price fluctuation.
Currently, after testing the bearish order block level twice and failing to break through, the price is once again approaching this critical area. If we witness a breakout above the $185 level with weekly candle closures above it, the price could continue its upward momentum, potentially reaching higher levels such as $218 to $240. In this scenario, monitoring price reactions to these key levels can provide a better understanding of future price movements.
On the other hand, if the price fails to break through the $185 level, and we receive a SELL confirmation in lower timeframes, there is a possibility of a pullback towards lower ranges like $140 to $120, which could be accompanied by further corrections.
This analysis is my personal viewpoint and not financial advice. If you found this helpful, please like and comment – I’d love to hear your thoughts! Happy trading! ✌😊

SOLANA (SOLUSDT): Bullish Momentum Achieves All Targets!SOLANA (SOLUSDT) Analysis: Bullish Momentum Achieves All Targets!
Time Frame: 15-minute
Trade Type: Long
Entry: $168.54
Stop Loss (SL): $167.82
Targets (TP):
TP1: $169.43 - Achieved ✔️
TP2: $170.86 - Achieved ✔️
TP3: $172.30 - Achieved ✔️
TP4: $173.19 - Achieved ✔️
Technical Overview:
Solana (SOLUSDT) displayed a strong bullish trend, successfully hitting all projected targets in the 15-minute timeframe. The price maintained an upward trajectory supported by the Risological dotted trend line (a custom trend indicator) reflecting solid market support and increasing momentum.
Key Stats:
Volume: 2.91M (compared to an average 30-day volume of 14.55M)
Performance:
1 Week: +9.02%
1 Month: +11.98%
3 Months: -5.79% (slight retracement)
6 Months: +26.41%
Year-to-Date (YTD): +71.06%
1 Year: +448.54% (significant yearly growth)
The successful completion of all targets showcases strong buying interest and consistent volume support. With a sharp yearly growth rate, Solana’s current performance aligns well with its historical bullish trajectory. Traders who entered at the set entry point reaped the benefits as SOL maintained its bullish momentum.

Raydium - Load The Truck Raydium.
Higher 24H Fees Generated Than ETH
800M Mcap, 1.6b FDV
Breakout against BTC..
Nobody uses Jupiter.. Raydium is where it's at..
Pump.Fun is the real catalyst for this bull run, and Raydium is the LP they've partnered with..
It's not just a DEX...Raydium grants you , with no experience, and no money.. the power to create your own currency celebrating your overweight cat.. and give people something to believe in.
But it also allows people to create communities around things that matter.. community is the new narrative. People believing in something is the spark of this new movement.
Doge was the first crypto example..
GME and AMC were the first trad fi examples ..
Then came the OG memes DOGE, SHIB...
The space grew to other chains..
PEPE.. BOME... WIF...
Then .. bang. Tweets are being tokenized. Videos are being tokenized..
The merge is happening, between media and money... And it's Raydium at the center of it
Raydium is the pick. Just buy it and don't think about it until end of 2025. Initial target, depth of the cup.. 700ish% against BTC (while btc is breaking out we're assuming).. so 20x in USD more or less.

SOLUSDT Cup and Handle Pattern Suggests Potential Bullish MoveSOLUSDT Technical analsysi uopdate
SOLUSDT has formed a cup and handle pattern on the weekly chart over the past 1080 days, which is a bullish signal. The price is currently forming the handle, and once it breaks above the handle's resistance, we can expect a strong upward move, signaling the continuation of the long-term uptrend.
Regards
Hexa

SOL ANALYSIS🔮 #SOL Analysis 💰💰
🌟🚀 There is a complete formation of Cup and Handle Pattern in #SOL in weekly timeframe. We are just waiting for a perfect breakout. If #SOL breakout with good volume then we will see a very good bullish move.🚀🚀
🔖 Current Price: $168
⏳ Target Price: $250
⁉️ What to do?
- We have marked some crucial levels in the chart. We can trade according to the chart and make some profits in #SOL. 🚀💸
#SOL #Cryptocurrency #DYOR

SOL (1M_Journey) Entry ( 168.8 ) Target ( 190) Stop ( 160 )BINANCE:SOLUSDT
1 Million Journey.
It is a long journey with NO FOMO & NO RUSH.
In those trades i will try to make 1 million USD from 1000 USD.
*********************************************************************************
(4)
Entry ( 168.8) 1000$
Target ( 190)
Stop ( 160 )
*********************************************************************************
General information
************************
1. throw this challenge i will try to make 1 million USD from 1000 USD
2. It will be very long journey not fixed by time with NO FOMO & NO RUSH.
3. I will take this challenge by my personal money and my personal decisions so please if you need to follow ( do your own plan).
4. May be i can achieve that target and may be not.
5. I think it will be educational challenge.
6. May be a lot of challenges Throw the journey, i will try to correct the path every fall.
6. I do not need 1000X in one coin but i need small profit with a lot of successful trades depend on the following formula for 10% Profit
NST= ( IN(FV/C) ) / ( IN (1+P) )
NST = Number of successful trades (NST)
FV = Final value
C = Capital
P = Profit percentage
IN = Natural logarithms ( IN from calculator)
NST = ( IN ( 1000 000 / 1000 ) / ( IN ( 1 + 10% ) ) = 6.908 /.09531 = 73.5 Successful trade. with no loses.
Risk management
**********************
1. Entry by 50% or 75% depend on the market situation.
2. Maximum 5% loses per trade.
3. Maximum 1 lose per day.
4. Maximum 2 loses per week.
5. Maximum 2 trades per day.
6. Minimum rewards has to be 5% and the maximum depends the coin targets & market situation.
Trading rules
****************
1. Figuring the best entry point.
2. After achieving more than 5% profit moving stop loss to secure 5% profit .
3. Trading available opportunities in the market ( everyday - every week - every month)
4. Trading will be spot only.
5. Trading will be with trusted & high liquidity platform ( Binance coins).
6. (Monitoring coins - low liquidity coins) will not be traded .
7. (High rewards -low risks - fast trades - lower time frames ) will be traded.
Notes
********
1. these rules can be changed due to the market situations and new challenges.
Remember always, NO FORMO - NO RUSH It is a long journey.
Thank you for reading,
@Crypto_alphabit
