Solusdt

BTC / ETH / SOL / XRP / HYPE: Potential Trend StructuresIn this video, I share my current daily and weekly analysis on the trend structures of BTC, ETH, SOL, XRP, and HYPE, highlighting key support and resistance zones to watch in the coming sessions.
Charts featured in the video:
BTC
ETH
SOL
XRP
HYPE
Thank you for your attention and I wish you successful trading decisions!
If you’d like to hear my take on any other coin you’re tracking feel free to ask in the comments (just don’t forget to boost the idea first 😉).

LONG - I am going to add more position when this happensI currently have a small size of long position but I am planning to add more (please see my previous article for my first trade set up), but I am waiting for a certain set up to come up:
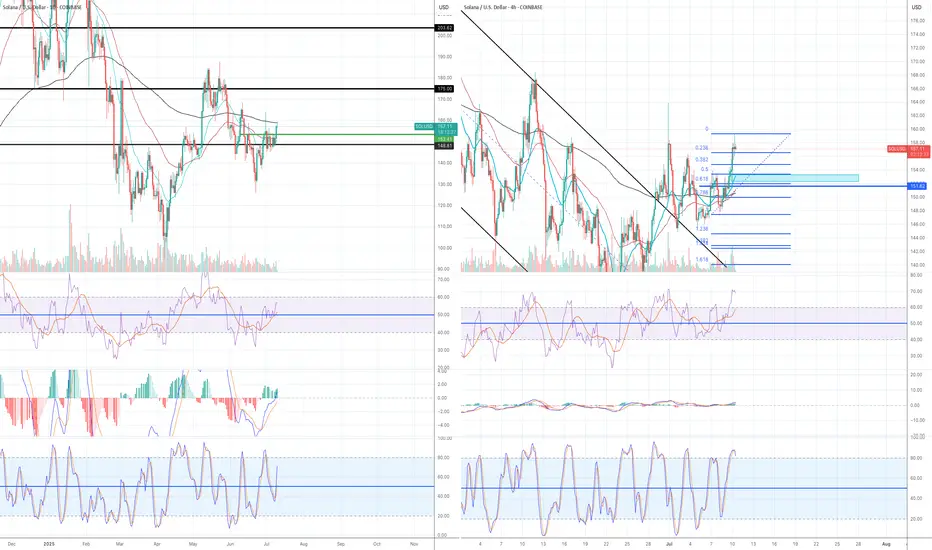
Daily:
1) all momentum indicators are entering the bull zone, so there is a plenty of room to move to the upside.
2) The candle has crossed and closed above both EMA 21 and 55, but EMA 200 is currently working as a resistance.
3) EMAs have not crossed and lined up for the bull trend - 21> 55> 200
4H:
1) EMA55 has finally crossed above EMA200!! But when they cross, the price very often has a decent pull back before taking off.
2) Stochastic and RSI are already in the overbought territory which tells me the pull back is likely to happen.
The chart is looking really good for the bull but I am going to wait for the price to retrace to Fib0.5-0.618 zone (see blue rectangular box in 4h chart).
If the price rebounces from that zone and momentum indicators reset to move to the upside, I am prepared to go big on long.
$SOL | Triple Top or Launchpad?Macro to Micro Context:
SOL is now testing a third rejection in the upper 153s, forming a textbook triple top just under a multi-month descending trendline and major Fib resistance. This ceiling has held firm since late June, despite higher lows grinding up from below. Price is now squeezed tightly between compressing demand and stacked supply, with volatility contraction apparent across the board.
The structure is coiling hard but momentum and volume must confirm resolution before positioning aggressively.
Structural & Momentum Breakdown:
Resistance Layering (Reinforced):
Triple Top: Price has repeatedly failed to break above the upper 153s.
Fib Overlap: 50%–61.8% retracement range aligns with both trendline resistance and OB stack.
Order Block Stack: Resistance from mid-153s to low-154s is now reinforced across timeframes (30M → Daily).
Momentum Shifts:
RSI Divergence: Lower highs on RSI across 2H/1H, despite flat or slightly higher price.
PVT Flattening: No fresh accumulation during recent tests.
Volume Decline: Progressive volume deterioration on each retest distributional tone building.
Demand Shelf:
Key demand and support range from low-150s to mid-151s has held through three separate dips.
This is the immediate pivot zone — lose it and vacuum effect likely down into the upper 140s.
Updated Trade Plan:
Rejection Short Setup:
Entry: Breakdown through mid-151s with confirming sell volume.
Stop: Above low-154s to account for potential deviation wicks.
TP1: Upper 148s (first OB cluster).
TP2: Mid-146s (Fib + minor support).
TP3: Low 140s (macro demand + wedge base).
Bear Confirmation: RSI breakdown + volume expansion + OB flips into resistance.
Breakout Setup (Only on Clear Validation):
Entry: Strong candle close above low-154s with breakout volume.
Stop: Below low-151s — invalidation of reclaim.
TP1: Upper 157s (Fib zone).
TP2: Low 160s (swing high area).
TP3: Upper 160s (macro breakout expansion).
Bull Confirmation: RSI > 62 on 2H, strong PVT rise, and flip of local OB into demand.
Risk Warning:
Triple tops near macro resistance are high-risk unless clearly broken. This zone is overloaded with historical rejection. Don't front-run the breakout — volume will show you who's in control.
Closing Thoughts:
With a confirmed triple top now visible, SOL is facing its most important rejection zone in weeks. Bulls must reclaim with strength or this becomes a clean setup for rotation into the mid to low 140s. Patience and confirmation are key here. Keep risk asymmetric.
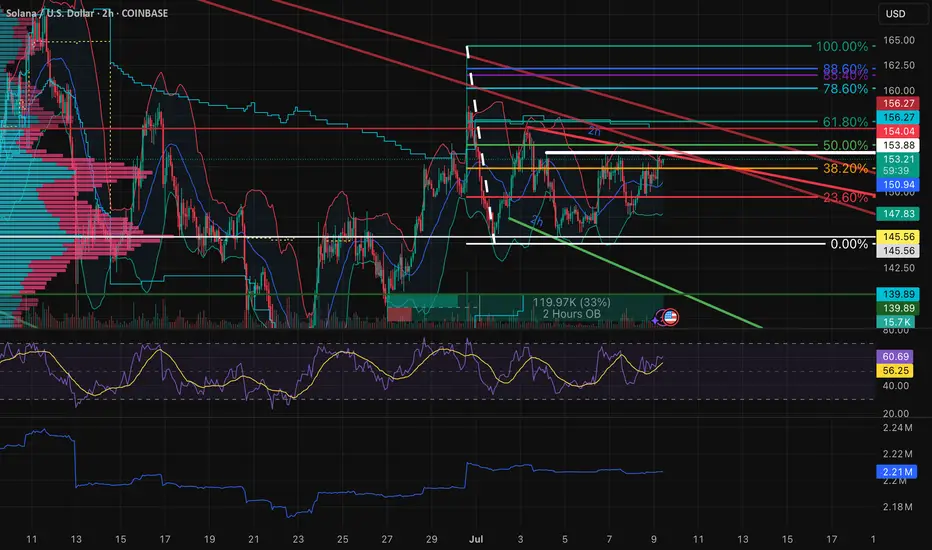
Altseason, just a thought ! Basically, right now we’re chilling in a major confluence zone — a whole bunch of important levels are stacked right here.
We’ve got:
The 0.78 Fib retracement holding it down
Volume profile support giving us a comfy cushion
That good old accumulation support from 2019–2021 saying “welcome back”
…just to name a few.
IMO, we’re in that sneaky “deviation/manipulation” phase before the real markup begins — a.k.a. altseason is warming up in the locker room.
If we actually hit the bull flag target… well, let’s just say the numbers start looking spicy. But hey, let’s not get ahead of ourselves — things can (and probably will) move faster than you think.
Alright, that’s the vibe. Let’s see how it plays out. Good night! 😴🚀

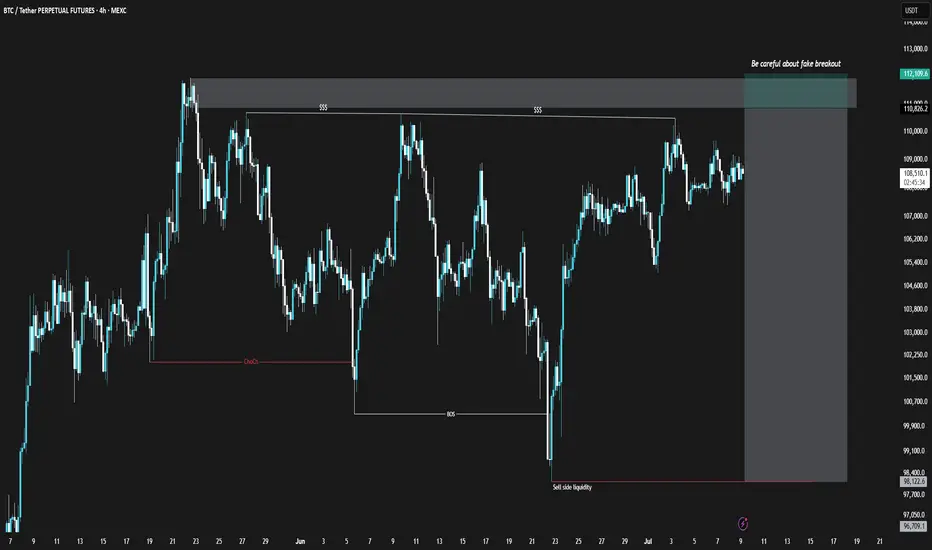
BTCUSDT Short Position (25/Jul/9)Bitcoin, similar to the TOTAL chart, is showing weakness in its bullish momentum. However, unlike TOTAL, the divergence in Bitcoin is clearly noticeable. Additionally, within the marked zone on the Bitcoin chart, there is a possibility of a fake breakout and liquidity grab. I suggest entering only with proper confirmation.
⚠️ This Analysis will be updated ...
👤 Sadegh Ahmadi: GPTradersHub
📅 2025.Jul.9
⚠️(DYOR)
❤️ If you apperciate my work , Please like and comment , It Keeps me motivated to do better
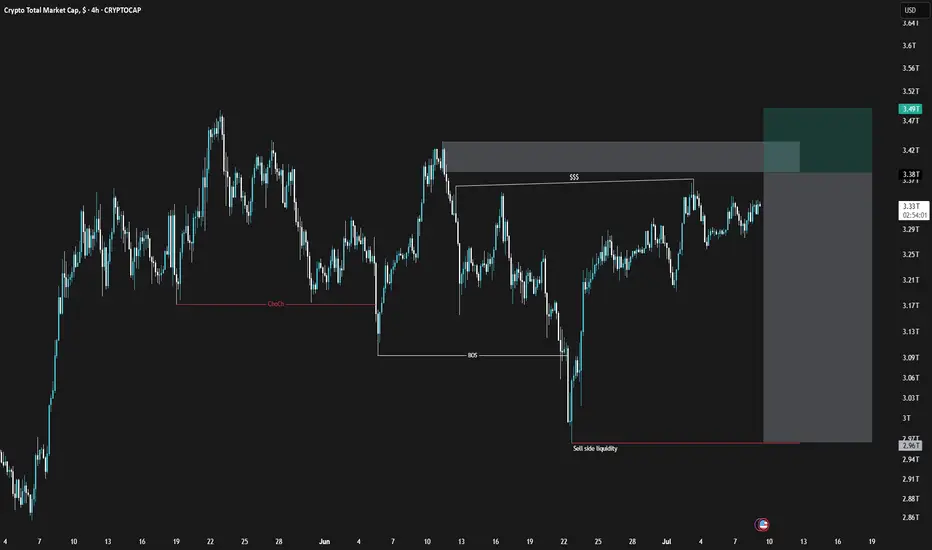
TOTAL SELL SIGNAL 25/Jul/9The TOTAL chart has shown a structural change in the 4-hour timeframe, indicating weakness in the bullish trend. Don't rush into buying and avoid falling into FOMO.
⚠️ This Analysis will be updated ...
👤 Sadegh Ahmadi: GPTradersHub
📅 2025.Jul.9
⚠️(DYOR)
❤️ If you apperciate my work , Please like and comment , It Keeps me motivated to do better
SOLANA Loves THIS Pattern | BULLISHSolana usually increases alongside ETH. Possible because its a big competitor.
We can see SOL follows ETH very closely, with the exception of dipping earlier than ETH by a week:
In the 4h, we see a push to breakout above the neckline resistance:
In the daily timeframe, SOL is just about to break out above the moving averages - which would be the final confirmation of a bullish impulse to come:
Could this pattern be the confirmation of the start of another big pump for SOL?
_______________________
BINANCE:SOLUSDT

#SOL Update #3 – July 8, 2025🟠 #SOL Update #3 – July 8, 2025
Solana, much like Litecoin, is still undergoing corrections following its latest impulsive move. While it currently holds above a strong support level, two significant resistance zones are ahead.
The market is undecided, and Solana's direction remains uncertain, making it one of the riskiest assets to trade today.
If the $145 support fails, the price may drop toward $137. Conversely, a daily close above $159 could trigger a move toward $167. For now, it's best to stay on the sidelines and monitor the price action closely.

Solana Moving Averages: Patience is KeySolana is trading above EMA89 while at the same time trading below EMA55, we have a mixed situation. When in doubt, stay out. Anything is possible on this chart.
There was a major correction already that lasted 84 days. Solana lost more than 65% in this correction. A -67% drop. This correction removed all gains from 2024 sending prices back below $100. This is to say that Solana already went through a full and major flush.
The market could very easily continue lower and produce a lower low compared to 7-April, a major crash leading to August and I can easily see this scenario developing. Will it develop? Is it really necessary?
I can also see a slow but sure change of course. A few days red at the start of the week, as it is usual and then Boom!, the market turns green. And it grows day after day after day. It is already happening, patience is key. Better focus on the numbers.
» If Solana trades weekly above $142, we are bullish, strongly bullish and can expect additional growth.
» If Solana moves and closes weekly below $142, market conditions still remain bullish but we can approach this pair with caution.
» On a broader perspective, any trading above $95, the 7-April low, is bullish long-term. As long as this level holds, we can expect higher prices. The last low sits at $126...
It doesn't matter how you slice it, the price is good and is more likely than not to continue to increase. Patience is key.
Namaste.

Live trade hello friends👋
Considering the fall that we had, you can see that the buyers supported the price at the support point and caused it to grow. Now with the return of the price and the construction of an upward pattern, you can see that we can enter into the transaction with capital and risk management and move to the specified goals with it.💰
🔥Join us for more signals🔥
*Trade safely with us*

SEI LIMIT FOR BUYHello friends
Due to the price drop, we can buy on the drop within the specified limits and move with it to the specified targets, of course with capital and risk management.
*Trade safely with us*

MOVE : Where to buy ?Hello friends
Given the upcoming token release, the price is expected to continue to fall, so be careful.
In case of a fall, we have identified important support levels for you, where you can buy with capital and risk management.
*Trade safely with us*

ENA : The largest token release...Hello dears
Given the long-term price decline that we have witnessed, it has now been announced that this currency is going to do a token release, which will naturally cause the price to fall, so be careful.
In case of a fall, we have identified important supports for you so that you can buy with risk and capital management.
The target has also been identified.
*Trade safely with us*

Solana's fate: pump or dump ?Hello friends
You see that Solana, after its good growth, got stuck in a range and is gathering strength. Now, considering the strong upward trend of this currency, it can be said that this force can push the price upwards, but everything is possible in the market, so observe capital management and trade with your will and wisdom.
*Trade safely with us*

SOL – Compression at Resistance IISolana remains locked in a corrective sequence, unwinding from the mid-June $164 high. Price has now respected a clearly defined descending trendline, recently validating it with a third consecutive rejection—establishing it as dominant short-term resistance. Compression is now occurring just above a well-tested 2H order block near 144–139, where bulls must respond or risk cascading into inefficiency zones.
Structural and Momentum Breakdown:
Descending Resistance Structure: Three clean rejection wicks off the same trendline establish this as firm structural resistance. The latest failed bounce confirms this diagonal as active seller control.
Fib Cluster Rejection: Price has struggled below the 50–61.8% retracement (152–155 zone) from the June high, marking that cluster as distribution resistance.
Volume Profile (VRVP): Sitting atop a low-volume pocket between 144.88 and 139.71; below that lies high-acceptance around 132.
Volumized OB Zones: 2H OB between 144–139 overlaps with key support shelf—any breakdown from here opens path to 132–129 range sweep.
RSI: Persistently sub-40 with no bullish divergence—momentum continues to degrade.
PVT: Flat-to-declining, showing no inflow response to support retests—suggests buyers are stepping back even at local lows.
Example Trade Strategy:
Bullish Reclaim Setup:
Entry: Only with breakout and 2H close above 152–153 (above OB and breaking descending resistance).
SL: Below 144.50 (reclaim invalidation).
TP1: 158–160 (Fib 78.6%)
TP2: 164 (100% retrace)
Confirmation Criteria: RSI >50 + breakout volume + PVT uptick.
Bearish Continuation Setup (If OB breaks):
Entry: 2H close under 144.88, confirming OB loss and trend continuation.
SL: Above 148.
TP1: 140
TP2: 138
TP3: 132–129 (macro demand + HVN)
Confirmation Criteria: Momentum stays sub-40 RSI, increased sell volume, and continued PVT drop.

#SOL Update #2 – July 5, 2025🔴 #SOL Update #2 – July 5, 2025
Yesterday, I mentioned that Solana was at a critical level and not suitable for long or short entries. I also noted that I’d stay in watch mode and that hasn’t changed.
Right now, SOL is trying to hold above the support box, but volume remains quite low. Even worse, footprint data is showing negative pressure. If SOL loses the $144.5 level, I expect a move toward the $137–136 zone, as mentioned in my previous update.
Let’s also not forget that the $150 area is a strong resistance. At this stage, I don’t see any high-probability setup on either side. I’m still watching. No trade for now.

SCRUSDT UPDATE
Pattern: Falling Wedge Breakout
Current Price: \$0.268
Target Price: \$0.398
Target % Gain: 50.1%
Technical Analysis: SCR has broken out of a falling wedge pattern on the 12H chart with a clean close above resistance. The breakout is backed by bullish candles and increasing volume, suggesting a potential 50% move upward.
Time Frame: 12H

SOL SCALP SetupSOl can retrace to 175$ on ltf, must use sl before taking any trade. Market is too volatile now

SOL – Compression at ResistanceAfter retracing up toward the 50% Fib level (around 154.3–154.4 on the daily chart), SOL/USDT has now stalled beneath key resistance and is rolling back into the reaction range. A close look at both the 1D and 2H charts reveals a clear case of a failed swing high rather than a trend reversal.
1. Structural Context
SOL remains inside its broader downtrend channel (green lines). The bounce off the June low carved out a higher low, but the subsequent rally ran into:
The daily descending trendline (red) from the June high
The 50% Fib retracement of the June down-leg (154.3–154.4)
A sell-side order block (red volume bars on the left VPVR)
The daily 20-period SMA and upper Bollinger Band
Because price could not clear these layers, the move shows the characteristics of a lower high inside a downtrend rather than a genuine breakout.
2. Multi-Timeframe Confirmation
Daily (1D) Chart
Retracement: Peaked at 50% Fib then reversed.
Volume Profile: Thick VPVR node at 154–156 acted as a supply shelf.
Bollinger Bands: Upper band contained the rally.
RSI: Pulled back from ~55 and printed a lower high as price challenged 50%.
PVT: Flat, indicating no real net buying during the bounce.
2-Hour (2H) Chart
Trendlines: A shorter-term red downtrend line capped the local rally near 154.
Order Blocks: Green buy-block around 137–140 held the low; red sell-block around 154–157 limited upside.
RSI: Printed a lower high on the second leg up, even as price revisited prior highs.
Volume: Tapered off on the approach into the 50% Fib zone, then increased on the pullback — a sign of distribution.
3. Key Levels & Next Moves
Immediate Support:
152.2–152.5 (38.2% Fib)
151.1–151.9 (23.6% Fib & daily BB midline)
Structural Support Zones:
146.1–144.6 (prior consolidation & lower Bollinger band)
141.5–140.9 (secondary order block)
134.0–137.0 (major demand cluster)
Immediate Resistance:
154.3–154.4 (50% Fib + daily trendline + SMA)
156–158 (78.6–100% Fib band + higher-timeframe supply)
If SOL fails to hold 152.2–152.5, look for a retest of the 146–144 zone. A breach below 144 opens the path back toward the 137–134 order block. Conversely, a sustained reclaim of 154.4 on volume would be needed to shift the short-term bias neutral.
4. Conclusion
This sequence—bounce into 50% Fib, capped by overlapping resistance, followed by divergence in momentum and rising volume on the pullback—confirms another lower high in SOL’s downtrend. Until price can clear 154.4 with conviction, the path of least resistance remains downward.

SOL/USDT : Strong Bullish Move Ahead?By analyzing the #Solana chart on the daily timeframe, we can see that the price is currently trading around $149.62. If the price holds above the key level of $146.28, we could expect the beginning of a strong bullish wave, potentially delivering over 25% short-term returns.
If this scenario plays out, the next bullish targets are $168.50, $187, $220, and $263.
(Personal research is strongly recommended for long-term investment decisions.)
Please support me with your likes and comments to motivate me to share more analysis with you and share your opinion about the possible trend of this chart with me !
Best Regards , Arman Shaban

HolderStat┆SOLUSD got out of the triangleBYBIT:SOLUSDT is trading in a well-structured upward channel with a history of consolidation zones acting as breakout springboards. The price recently bounced off trend support and now targets the resistance at 170. Structure remains bullish as higher lows continue to form.

Can Solana reach $175 target after breaking $160 level?Hello,✌
let’s dive into a full analysis of the upcoming price potential for Solana 🔍📈.
BINANCE:SOLUSDT is approaching a crucial daily resistance level between $150 and $160. A clear break above this zone could lead to a 15% upside, with a target near $175 🚀. Keep an eye on volume for confirmation before entering the trade 📈.
✨ Need a little love !
We pour love into every post—your support keeps us inspired! 💛
Don’t be shy, drop a comment—we’d love to hear from you.
Big thanks , Mad Whale 🐋
