#SOLUSDT: Price to turn extreme bullish! Get ReadyHey there everyone! 👋
I’ve got some updates on the BINANCE:SOLUSDT price. It’s been testing a crucial level, and it’s showing some really strong bullish signs and patterns. But here’s the thing, we’re starting to think there might be a possible reversal coming up in the next few days. If we’re right, the price could hit all three targets we’ve been tracking.
Remember, though, that this is just our analysis, and it’s always a good idea to use accurate risk management when you’re trading.
Thanks for your support! 😊
If you want to help us out, here are a few things you can do:
- Like our ideas
- Comment on our ideas
- Share our ideas
Team Setupsfx_
Solusdtbuy

"Solana Heist in Progress! Will the Breakout Hold or Fake Out?"🔥🚨 "SOLANA HEIST ALERT: The Ultimate Bullish Raid Plan (Breakout or Fakeout?)" 🚨🔥
🌍👋 Greetings, Market Pirates & Profit Bandits!
(English, Spanish, Portuguese, French, German, Arabic—we speak MONEY.)
💎 STRATEGY BASED ON THIEF TRADING STYLE 💎
(High-risk, high-reward—steal the trend or get caught in consolidation!)
🎯 MISSION: SOL/USD (Solana vs. Dollar) CRYPTO HEIST
🐂 Direction: LONG (But watch for traps—cops & bears lurk nearby!)
🚀 Escape Zone: ATR line (High-Risk Profit-Taking Area)
⚠️ Warning: Overbought? Reversal? Police line at resistance? TAKE PROFITS EARLY!
📈 ENTRY: "THE BREAKOUT HEIST BEGINS!"
Trigger: Wait for candle close ABOVE 148.50 (MA)
Alternative Entry: Buy stop above MA OR buy limit on pullback (15m-30m TF)
🛎️ SET AN ALERT! Don’t miss the breakout—thieves strike fast.
🛑 STOP LOSS: "DON’T GET CAUGHT!"
Thief SL: 136.00 (2H Previous structure Swing Low) (Adjust based on your risk & lot size!)
⚠️ Warning: If you ignore this, you’re gambling—your loss, not mine.
🎯 TARGET: "LOOT & BOUNCE!"
🎯 167.00 (or escape earlier if the trend weakens!)
🧨 Scalpers: Only play LONG—use trailing stops to lock in gains!
📢 NEWS & RISK WARNING
🚨 Avoid new trades during high-impact news! (Volatility kills heists.
🔒 Use trailing stops to protect profits if the market turns.
💥 BOOST THIS HEIST! (More boosts = more profit raids!)
👉 Like ✅ | Follow 🚀 | Share 🔄
💬 Comment your take—bullish or bearish trap?
🚀 Next heist coming soon… Stay tuned, bandits! 🤑

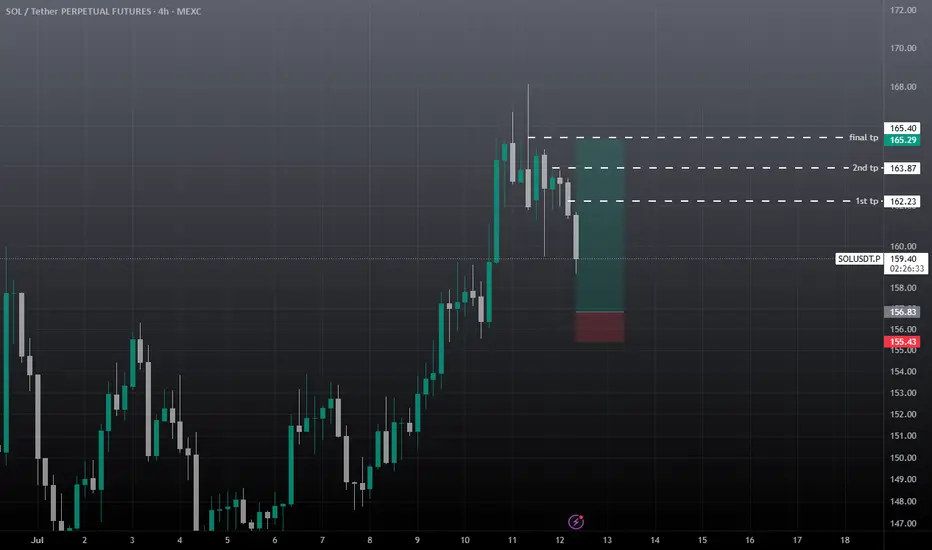
SOL USDT SCALP Long / Buy Setupwait for the entry and then take, as liquidation still lies upside, chances are high that sol will re-visit 164, before any major move to the downside. SL is important on any side. We took good profit on previous SOL short setup.
SOLANA ABOUT TO EXPLODE?CRYPTOCAP:SOL just broke out and is surging within a long-term bullish channel
Price action is clean, momentum is strong, and if this channel holds — we might be eyeing $700+ in the next run.
This is not the time to ignore Solana.
Chart says it all.
DYOR. Stay sharp.

SOL/USD "Solana vs U.S Dollar" Crypto Heist Plan (Day/Swing)🌟Hi! Hola! Ola! Bonjour! Hallo! Marhaba!🌟
Dear Money Makers & Robbers, 🤑 💰💸✈️
Based on 🔥Thief Trading style technical and fundamental analysis🔥, here is our master plan to heist the SOL/USD "Solana vs U.S Dollar" Crypto Market. Please adhere to the strategy I've outlined in the chart, which emphasizes long entry. Our aim is to escape near the high-risk Yellow MA Zone. Risky level, overbought market, consolidation, trend reversal, trap at the level where traders and bearish robbers are stronger. 🏆💸"Take profit and treat yourself, traders. You deserve it!💪🏆🎉
Entry 📈 : "The heist is on! Wait for the MA breakout (156.00) then make your move - Bullish profits await!"
however I advise to Place Buy stop orders above the Moving average (or) Place buy limit orders within a 15 or 30 minute timeframe most recent or swing, low or high level for Pullback entries.
📌I strongly advise you to set an "alert (Alarm)" on your chart so you can see when the breakout entry occurs.
Stop Loss 🛑: "🔊 Yo, listen up! 🗣️ If you're lookin' to get in on a buy stop order, don't even think about settin' that stop loss till after the breakout 🚀. You feel me? Now, if you're smart, you'll place that stop loss where I told you to 📍, but if you're a rebel, you can put it wherever you like 🤪 - just don't say I didn't warn you ⚠️. You're playin' with fire 🔥, and it's your risk, not mine 👊."
📍 Thief SL placed at the nearest/swing low level Using the 4H timeframe (130.00) Day / Swing trade basis.
📍 SL is based on your risk of the trade, lot size and how many multiple orders you have to take.
🏴☠️Target 🎯: 175.00 (or) Escape Before the Target
🧲Scalpers, take note 👀 : only scalp on the Long side. If you have a lot of money, you can go straight away; if not, you can join swing traders and carry out the robbery plan. Use trailing SL to safeguard your money 💰.
💰💵💸SOL/USD "Solana vs U.S Dollar" Crypto Market Heist Plan (Swing/Day) is currently experiencing a bullishness,., driven by several key factors. .☝☝☝
📰🗞️Get & Read the Fundamental, Macro, COT Report, On Chain Analysis, Sentimental Outlook, Intermarket Analysis, Future trend targets... go ahead to check 👉👉👉🔗🔗🔗
⚠️Trading Alert : News Releases and Position Management 📰🗞️🚫🚏
As a reminder, news releases can have a significant impact on market prices and volatility. To minimize potential losses and protect your running positions,
we recommend the following:
Avoid taking new trades during news releases
Use trailing stop-loss orders to protect your running positions and lock in profits
💖Supporting our robbery plan 💥Hit the Boost Button💥 will enable us to effortlessly make and steal money 💰💵. Boost the strength of our robbery team. Every day in this market make money with ease by using the Thief Trading Style.🏆💪🤝❤️🎉🚀
I'll see you soon with another heist plan, so stay tuned 🤑🐱👤🤗🤩

$136 Resistance Crumbles: Solana Bulls Take the Lead...Solana Breaks Key Resistance – Eyes Set on $150 and $180 Targets
Solana (SOL) has successfully broken through the strong resistance level at $136 after several failed attempts, signaling a potential continuation of its current uptrend. This breakout marks a significant technical milestone for SOL, which had previously struggled to maintain momentum above this price zone.
If Solana is able to hold above the $136–$137 level, it could open the door for further gains, with short- to mid-term price targets around $150 and $180. The breakout aligns with broader bullish sentiment in the crypto market and may attract new buyers looking to ride the trend.
For traders or investors interested in entering a position, the $136–$137 range could offer a potential entry point, provided the breakout holds and is supported by volume. As always, proper risk management is recommended, and watching for confirmation on the next few candles could be key.

SOLUSDT 1DSOL ~ 1D Analysis
#SOL Buy gradually after successfully penetrating this resistant line with a short -term target of at least 10%+.

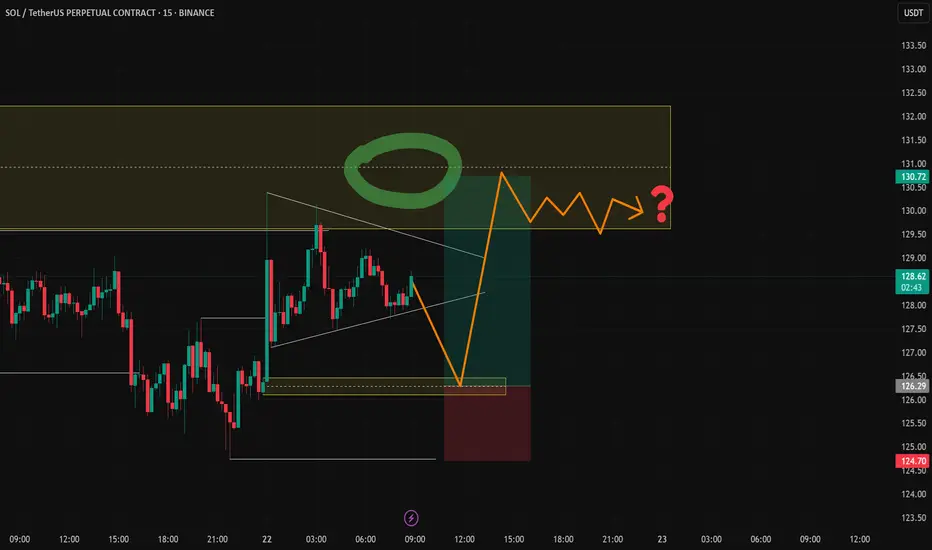
solana trade setup 15min chart* if you are trading on market orders need to set limit order *
i say this because last week it has going all directions and playing with strict levels are important
just spotted a triangle forming which could be drying up in volume as of recording this chart setup it saturday where major market remains closed the volume and volatility will be low
buy area 126-126.50 target 130.5 to 131 sl 124.70-50
triangle is trap for liquidation be careful !!
SOLUSDT: Strong Bounce from Major Support!!BINANCE:SOLUSDT has shown a strong recovery after hitting a major support zone around $110. This bounce is accompanied by good trading volume, indicating growing interest. Investors who missed the previous rally are now accumulating, which adds further strength to the bullish sentiment.
As market conditions improve, the entry of bigger players could push SOL towards higher highs. If momentum continues, there’s potential for SOL to breach its previous all-time high, with a long-term target of $500 in sight.
For investors, this presents a solid buying opportunity to hold for the long term. Traders, however, should manage their risk carefully and always set a stop loss to protect their capital.
BINANCE:SOLUSDT Currently trading at $132
Buy level: Above $110
Stop loss: Below $90
Target : $500
Max Leverage 3x
Always keep Stop loss
Follow Our Tradingview Account for More Technical Analysis Updates, | Like, Share and Comment Your thoughts

SOLUSDT 1DSOL ~ 1D Analysis
#SOL Re -testing this support and so far continues to maintain this support. Bullish again holds control as long as this support continues to be maintained. Minimum target of 15%++

#SOL/USDT #SOL
The price is moving in a descending channel on the 1-hour frame and is adhering to it well and is heading to break it strongly upwards and retest it
We have a bounce from the lower limit of the descending channel, this support is at a price of 187
We have a downtrend on the RSI indicator that is about to break and retest, which supports the rise
We have a trend to stabilize above the moving average 100
Entry price 203
First target 219
Second target 234
Third target 250

Next motive wave on SolanaHi fellow traders, SOLUSDT is getting ready to make a move higher after it completes the correction. Target the 313.6902 level. Good luck and trade safe!

SOLUSDT Breaking Barriers on the Path to NEW ALL TIME HIGH!!TRADENATION:SOLANA ( BINANCE:SOLUSDT ) is making waves in the crypto market, breaking past all key resistance levels with strong volumes, signaling a potential long-term bullish trend. The recent price action suggests growing confidence among traders and investors, fueled by Solana’s ecosystem developments and rising adoption. This breakout is catching the attention of the market as it mirrors similar patterns seen in XRP, which recently reached a new all-time high.
With the current momentum, CRYPTOCAP:SOL has the potential to chart new heights, and the hype surrounding it could push the price towards $600 in the long term. Key short-term resistance levels have already been tested, and the continued surge in volume could pave the way for a sustained rally.
This could be the perfect opportunity for traders and investors looking to capitalize on Solana’s upward trajectory. Is this the beginning of SOL’s journey to new all-time highs? Stay tuned as the market unfolds.
BINANCE:SOLUSDT Currently trading at $220
Buy level: Above $210
Stop loss: Below $154
Target : $600
Max Leverage 3x
Always keep Stop loss
Follow Our Tradingview Account for More Technical Analysis Updates, | Like, Share and Comment Your thoughts

SOLUSDT 1DSOL ~ 1D
#SOL In Time Frame 1D this is very strong support for now. Buy from here with a minimum target of 15%++

SOL to go back to 232Solana is looking good for a mean reversion back to continuation of the bull trend. It has a perfect retracement to the .5 fib level and bounced from there nicely.
I will start new trades at 195 and below for the capture the move back to the 230 level.
Stop loss right below 190. Not a financial advise so DYOR.

SOLUSDT 2DSOL ~ 2D
#SOL the price got a pretty good reaction at this support block area.
This is also the Golden Fibonacci area.
Buy gradually on this support block,. with a minimum target of 20%++

Solana (SOL/USD): Eyeing a Return to All-Time HighsSolana is in a critical phase, attempting to reclaim its all-time high (ATH) of $260 as it builds bullish momentum. With Bitcoin (BTC) stabilizing in the $92,000–$103,000 range, the broader crypto market is ripe for a rally, providing the perfect environment for SOL to break its ATH and target a new high of $400 by March 2025.
Key Factors for SOL’s Rally:
Bullish Momentum Curve:
December will be pivotal as Solana needs to form a steady, upward momentum curve. This means a series of higher highs and higher lows, with minimal volatility to maintain investor confidence.
Critical Support Levels:
$200: Key psychological and technical support. Staying above this level will signal strength and resilience.
$180 (Worst Case): If SOL drops to this level, it must find strong buying support to avoid breaking the bullish structure.
Resistance at $260:
The $260 ATH will be a critical barrier. A successful breakout here will not only confirm the bullish trend but could ignite a wave of buying that propels SOL toward its next target of $400.
Positive Scenario:
If SOL/USD continues to defend the $200–$180 range and Bitcoin remains stable, Solana can gain the momentum needed to break $260 by early 2025.
Once this level is breached, SOL could rally quickly, entering price discovery mode and targeting $400 by March 2025.
Risks and Challenges:
A failure to maintain support above $180 could lead to increased selling pressure, disrupting the bullish outlook.
Broader market volatility or BTC dropping below $92,000 might also hinder SOL’s progress.
Outlook for SOL Holders:
This December is crucial for Solana as it battles to establish a solid base and regain momentum. Holding above $200 while building a steady bullish curve will set the stage for SOL to not only reclaim its ATH of $260 but also push toward a new milestone of $400 by March 2025, marking a significant achievement for the ecosystem and its investors.

SOLUSDT Ascending Triangle PatternSOLUSDT Technical analysis update
SOLUSD has formed an ascending triangle pattern, and the price is now moving towards the triangle's resistance. A strong bullish move can be expected in the coming days
Buy Level: $160.00
Stop Loss: $147.00
Regards
Hexa

SOLUSDTSOL ~ 3D ✅
#SOL If you are a strong holder of $SOLANA ,. Looks like you need to be a little more patient. The bulls will not come before this pattern is successfully broken.
✅ If you haven't bought #SOL yet, this is a good accumulation time until you wait for this pattern to break out

SOLUSDT. Don't forget about stop-loss.
Write in the comments all your questions and instruments analysis of which you want to see.
Friends, push the like button, write a comment, and share with your mates - that would be the best THANK YOU.
P.S. I personally will open entry if the price will show it according to my strategy.
Always make your analysis before a trade

SOL target 3354h time frame
-
TP: $335
SL: $139
RR: 7.29
-
(1) Following our previous analysis (created a continuation structure)
(2) Better to test demand zone and fib 0.618 at $162
(3) Final target is $335, which is overlapping with two fib projection techs
(4) Stop loss while breaking down back this triangle structure
-
Previous analysis

#SOLUSDT: What's next? Read Description! Dear Traders,
Hope you are great, there is a high chance of price creating higher high after rejecting at current discounted price zone. The price behaviour and momentum of the trend suggest possible price change. Entry at current price region can be suitable for traders who trade swing, in long run we can see significant growth in this crypto pair. Good luck and trade safe.

SOLUSDT Potentially BullishBINANCE:SOLUSDT has done better than I anticipated from the $22 entry and it looks like it is giving another entry setup. Will this move take us back to the $211 mark and go beyond? This remains to be seen as the new found support holds.
Past Results does not guarantee future results, do your due diligence. #SOLUSDT
