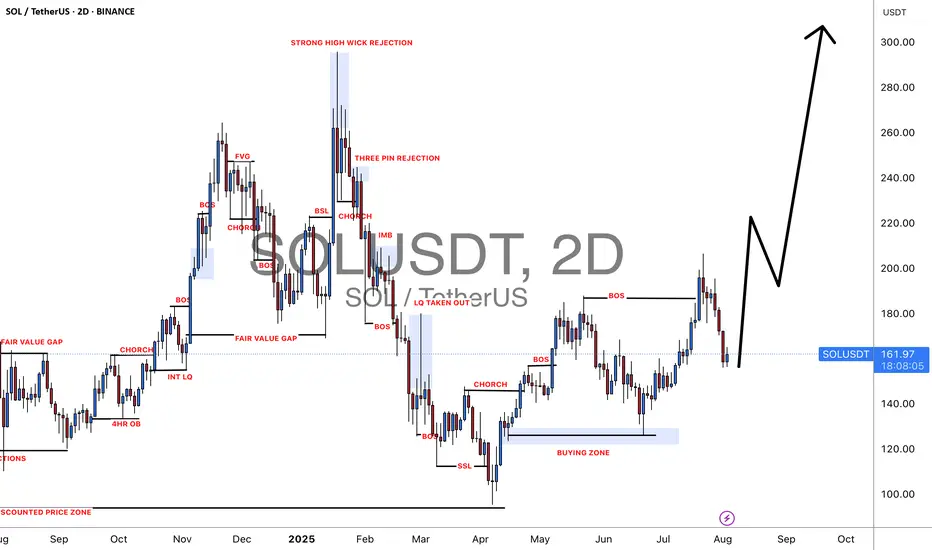
Solana (SOL): Bullish Continuation after Neckline BreakoutWhat I see:
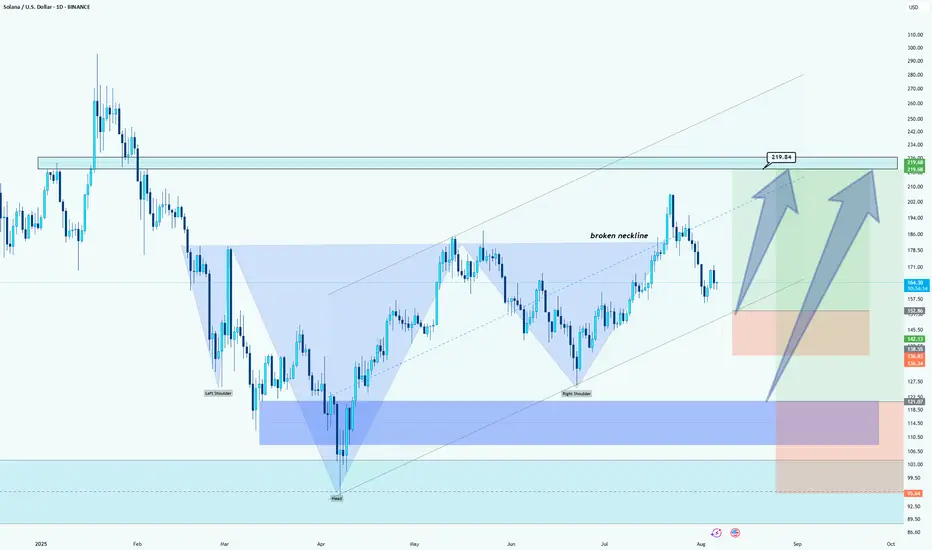
Chart Patterns (Head and Shoulders): The chart illustrates a classic "Head and Shoulders" pattern. The left shoulder, head, and right shoulder are formed, and the neckline (the blue dashed line) has been broken, which suggests that the price could rise towards the target zone above the broken neckline.
Target Price: Based on the pattern and technical analysis, the potential target for the price could be around $219.84, as indicated by the box in the upper right corner. This target aligns with the upward trend continuation from the broken neckline.
Support Zones: There are several key support levels below the current price, including the lower zone marked in blue around $95.50 and the potential demand area in the middle blue zone (around $136.34). These could act as areas for price to rebound from if there's a pullback.
Trend Line and Movement: The dotted blue trend line suggests an ascending trend, showing higher lows, and the price is likely to continue upward after the recent breakout above the neckline.
Given the broken neckline and the formation of the Head and Shoulders pattern, the bullish scenario appears more likely. A price target of around $219.84 seems feasible if the upward momentum continues. However, if the price fails to hold above the neckline or reverses, the support zones could provide areas for potential price bounces, with the $136.34 region as a significant level to watch for possible buying opportunities. Therefore, the most probable outcome aligns with the bullish scenario (towards $219.84).
Solusdtlong
SOL Institutional Capital Fuels Bull Run SpeculationSolana's Ascent: A Perfect Storm of Adoption and Institutional Capital Fuels Bull Run Speculation
A powerful and rare confluence of tangible real-world adoption, significant institutional investment, and bullish technical indicators is generating a palpable buzz around Solana (SOL). The high-performance blockchain, often touted as a leading "Ethereum killer," is experiencing a resurgence that has captured the market's attention. After a period of sideways consolidation, SOL has decisively broken through key psychological and technical price levels, igniting speculation that this may be the start of a sustained and powerful bull run.
The narrative driving this optimism is not based on fleeting hype but on two concrete, fundamental pillars. The first is the global shipment of Solana Mobile's second-generation smartphone, the "Seeker," a device engineered to onboard millions into the Web3 ecosystem by seamlessly integrating crypto into the user's daily life. The second is a powerful vote of confidence from the traditional finance world, where a growing number of publicly traded companies are aggressively accumulating SOL for their corporate treasuries, treating it as a strategic reserve asset. As these foundational tailwinds gather force, technical charts are beginning to align, suggesting that the path of least resistance for Solana's price may soon be sharply upward.
The Seeker Phone: Solana's Trojan Horse for Mass Adoption
Perhaps the most visible and innovative catalyst is the global rollout of the Seeker smartphone. Following up on its first-generation "Saga" device, Solana Mobile has initiated the shipment of tens of thousands of pre-ordered Seeker phones to a global audience. The market's reception has been nothing short of explosive, with pre-orders soaring past 150,000 units—a dramatic increase from the 20,000 total sales of its predecessor. This overwhelming demand underscores a pent-up desire for a mobile-native Web3 experience.
But the Seeker is far more than just a piece of hardware; it represents a strategic masterstroke to solve the persistent problem of user experience in the crypto space. For years, interacting with decentralized applications (dApps) on mobile has been a clunky, insecure, and fragmented process, creating a high barrier to entry for the average consumer. The Seeker directly addresses these pain points. It features a built-in crypto wallet and a hardware-isolated "Seed Vault," which secures a user's private keys in a protected environment within the phone, drastically enhancing security and simplifying transactions.
This mobile-first approach creates a powerful economic flywheel. Priced accessibly, the phone is projected to generate substantial revenue for Solana Mobile. However, its true value lies in its ability to foster a vibrant, self-sustaining ecosystem. Each device includes a "Genesis NFT," a digital key that unlocks exclusive airdrops, rewards, and early access to new applications. This model, which proved incredibly successful with the Saga phone and the famous BONK memecoin airdrop, gamifies participation and incentivizes users to actively explore and engage with the Solana network. It transforms the phone from a passive communication tool into an active portal for decentralized finance (DeFi), NFT marketplaces, and Web3 gaming.
Furthermore, the Seeker boasts its own decentralized dApp store, presenting a direct challenge to the incumbent duopoly of Apple and Google. By offering developers a platform with lower fees and fewer restrictions, Solana is cultivating an environment where innovation can flourish. This attracts builders to the ecosystem, leading to a richer and more diverse array of applications, which in turn attracts more users. The Seeker phone, therefore, is not just a product—it's a Trojan Horse designed to embed the Solana network into the fabric of daily life, driving network utility, transaction volume, and ultimately, sustained demand for the SOL token.
The Institutional Stampede: Big Money Places Its Bet on Solana
While the Seeker phone provides a compelling grassroots adoption narrative, it is the concurrent wave of institutional investment that adds a powerful layer of validation and financial firepower. A growing cohort of publicly traded companies is now strategically adding SOL to their corporate treasuries, signaling deep-seated, long-term confidence in the network's technology and economic potential. This trend moves Solana beyond the realm of speculative trading and into the domain of strategic corporate finance.
Leading this charge is DeFi Development Corp (DFDV), a firm that has made headlines with its aggressive accumulation strategy. The company recently purchased an additional 110,466 SOL, bringing its total holdings to a staggering 1.29 million SOL. This move is part of a publicly stated ambition to hold one SOL per outstanding company share by 2028, a strategy explicitly modeled after MicroStrategy's high-conviction Bitcoin treasury plan. By securing a multi-billion dollar line of credit for these purchases, DeFi Dev Corp is making a clear and unequivocal bet on Solana's future.
This institutional embrace extends beyond a single entity. Upexi Inc., a consumer brand holding company, has significantly increased its SOL holdings and secured a $500 million credit line for further acquisitions. Bit Mining, a prominent player in the digital asset mining space, has not only purchased millions of dollars worth of SOL but has also launched its first Solana validator, contributing directly to the network's security and decentralization. Perhaps most surprisingly, Artelo Biosciences, a Nasdaq-listed pharmaceutical company, has pivoted to include SOL in its treasury, becoming the first public pharma firm to adopt a digital asset as a reserve.
These companies are drawn to Solana for its unique combination of high throughput, low transaction costs, and yield-bearing potential. The network's ability to process thousands of transactions per second at a fraction of a penny makes it a viable platform for enterprise-grade applications. Furthermore, the ability to stake SOL and earn a consistent annual yield of 7-8% presents a compelling alternative to holding depreciating fiat currencies or low-yield government bonds. This makes SOL an attractive treasury asset that can both appreciate in value and generate a recurring revenue stream. This institutional inflow provides robust price support and has an outsized market impact, as it effectively removes large quantities of SOL from the circulating supply, creating a potential supply shock as demand continues to grow.
Coiling for a Breakout: A Technical Perspective
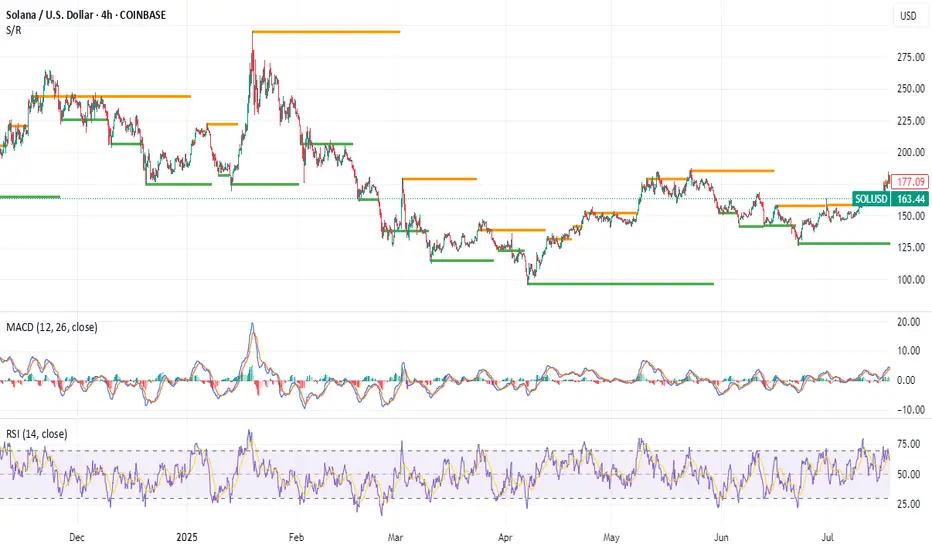
This potent mix of fundamental catalysts is vividly reflected in Solana's price chart, which shows the asset coiling for a potentially explosive move. After establishing a solid foundation of support, SOL has demonstrated significant strength by breaking through the crucial $160 and $162 levels. The price is now trading firmly above its 100-hourly simple moving average, a key indicator that traders use to gauge short-term trend momentum. A price holding above this moving average is generally considered a sign of bullish health.
Currently, a key bullish trend line has formed on the hourly chart, with immediate and strong support located at the $165 mark. This level now acts as the first line of defense for the bulls; as long as the price remains above it, the upward trajectory is considered intact. However, the path higher is not without obstacles. The first major test awaits at the $172 resistance zone. A decisive and high-volume break above this level would signal that buyers are in firm control and could trigger a cascade of further buying.
Should the bulls conquer $172, the next significant hurdle lies near the $180-$182 range. Overcoming this area would open the door to a more sustained rally, with analysts eyeing subsequent targets at $192 and the psychologically important $200 level. While these technical levels present challenges, the underlying momentum indicators are encouraging. The Moving Average Convergence Divergence (MACD) is showing bullish acceleration, and the Relative Strength Index (RSI) is holding strong above the 50 midpoint, indicating that buying pressure is outweighing selling pressure.
Of course, no market moves in a straight line. A failure to break the $172 resistance could lead to a temporary pullback. If the $165 support level were to fail, the next support zones would be found near $160 and $155. A break below these levels could signal a short-term bearish reversal and would invalidate the immediate bullish thesis. However, given the powerful fundamental drivers at play, many analysts believe that any such dips would likely be viewed as buying opportunities.
The Verdict: Is This the Definitive Catalyst?
Solana currently finds itself in an exceptionally strong position. It is one of the few blockchain projects that can boast a clear, tangible strategy for mass adoption through its mobile initiatives. The Seeker phone is a game-changer, providing a seamless on-ramp to Web3 that could onboard a new generation of users.
This powerful fundamental narrative is being amplified and validated by a wave of institutional capital. The strategic accumulation of SOL by public companies lends the asset a new level of legitimacy and provides a powerful source of demand that is unlikely to waver based on short-term market fluctuations.
When these two forces are combined with a bullish technical structure, the result is a perfect storm of positive catalysts. While the broader crypto market will always be subject to macroeconomic factors and regulatory shifts, Solana has carved out a uniquely compelling growth story. The immediate challenge is for the bulls to maintain their momentum and decisively break through the upcoming resistance zones. If they succeed, this confluence of events may very well be remembered as the definitive catalyst that propelled Solana into its next major bull run, solidifying its position not just as a competitor, but as a leader in the new digital economy.
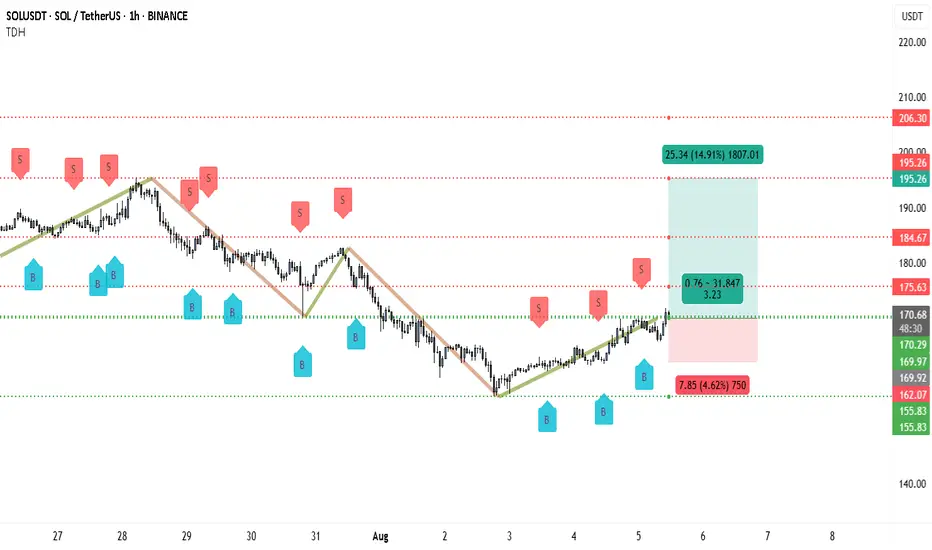
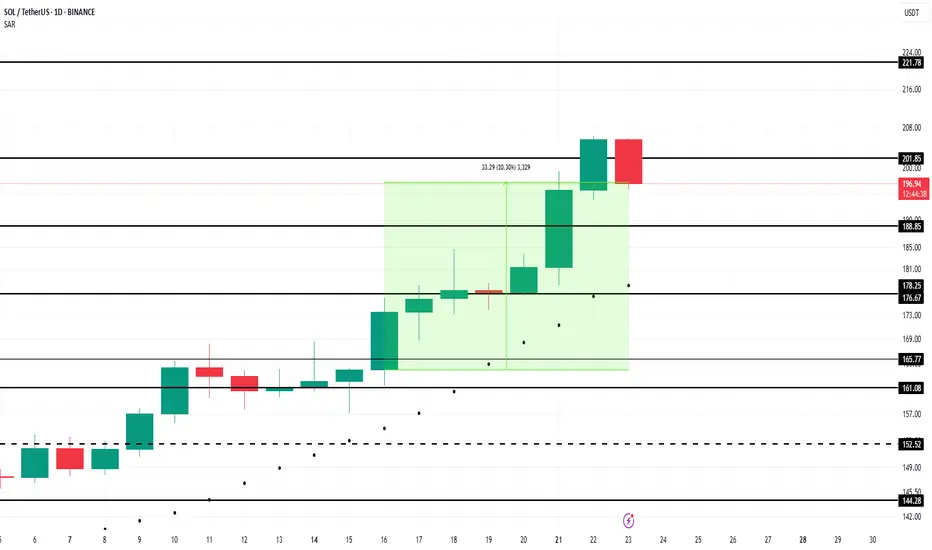
From $162 to $195 — Solana’s Next Big Move Could Be StartingSolana has recently rebounded from a strong demand zone around $162.07–$155.83 after an extended downtrend. This support has held multiple times over the past few sessions, showing that buyers are defending it aggressively. The “B” buy signals near these lows further support the case for an upward move.
Price has now broken above the $170.29–$169.97 resistance area, which has flipped into immediate support. Holding above this zone strengthens the probability of continuation toward the next key resistance levels.
The first resistance to watch is $175.63, followed by $184.67. If price sustains above these zones, the major bullish target lies near $195.26, aligning with the top of the projected profit zone in your chart.
From a structure perspective, the pattern suggests a potential short-term trend reversal, with higher lows forming since August 3. This change in market structure, combined with the break above the recent consolidation, indicates renewed bullish momentum.
Trading Setup
• Entry: Around $170.80–$171.00 (above breakout confirmation)
• Stop-loss: Below $169.90 or deeper at $162.00 for wider protection
• Take-profit 1: $175.63
• Take-profit 2: $184.67
• Final Target: $195.26
• Risk-Reward: Approximately 3.2:1
Risk Caution
Solana is known for sharp intraday swings. Traders should consider locking partial gains once the price moves 2–3% in their favor (about +3–5 USDT from entry) to protect capital while still holding for the larger target.
SOLUSDT- Golden Pocket Bounce: Bullish Phase or Another Fakeout?🔍 In-Depth Technical Analysis (1D Timeframe)
The SOL/USDT pair is currently showing a highly significant technical reaction as price bounces from the Fibonacci Retracement 0.5 - 0.618 zone (also known as the Golden Pocket), located between $166.63 - $157.13.
This level also aligns perfectly with a historical demand zone that has previously acted as a strong support during high-volume selloffs, creating a powerful confluence area.
---
🧩 Market Structure & Pattern
✅ Golden Pocket + Demand Zone: This overlap strengthens the probability of a valid bullish reversal.
🟠 Previous Movement: Price dropped from the recent swing high near $188 after failing to break through major resistance.
📉 Short-Term Downtrend: Currently in a corrective phase after an earlier bullish run.
---
🟢 Bullish Scenario (Rebound Confirmed from Golden Pocket)
If the price manages to hold above the $157 - $166 range and prints a bullish candle with volume confirmation:
1. A bullish breakout above $179 and more importantly $187.80 could open the door to further upside.
2. Potential midterm bullish targets:
🎯 Target 1: $205.69 (key psychological + structural level)
🎯 Target 2: $218.13 (previous reaction zone)
🎯 Target 3: $257.10
🎯 Target 4 (macro): $295.14
> The current zone offers an attractive risk-to-reward opportunity for swing traders, as long as the higher low structure is maintained.
---
🔴 Bearish Scenario (Breakdown from Key Support Zone)
Should the price break below $157 with strong selling volume:
1. That would invalidate the bullish setup and suggest a shift in structure.
2. Potential deeper correction targets include:
⚠️ Support 1: $140 (minor support from past structure)
⚠️ Support 2: $122 - $110 (major support zone from March–April 2025)
> A confirmed breakdown here would likely initiate a lower high – lower low structure, signaling a possible shift into a bearish medium-term trend.
---
📌 Additional Key Indicators to Watch
🔄 Volume Spike: Essential for validating any breakout or breakdown.
📉 Daily RSI: If RSI shows bullish divergence or bounces from oversold territory, that would strengthen the bullish case.
⏳ Daily Candle Close: Monitor the next 2–3 daily candle closes around this key zone for directional confirmation.
---
💡 Conclusion
SOL is at a crucial inflection point. The reaction around the $157 - $166 support confluence will likely determine the medium-term trend:
Bullish: If price reclaims $179–$188 zone with strong momentum
Bearish: If price breaks below $157 and closes with volume
This could be a high-reward opportunity for technical traders if confirmed properly.
---
🧠 Suggested Strategy:
🔹 Entry: Upon bullish confirmation in current demand zone
🔹 Stop Loss: Below $155 (for swing setups)
🔹 Take Profit Zones: $179 → $205 → $218 → $257+
#SOLUSDT #Solana #CryptoTechnicalAnalysis #FibonacciLevels #GoldenPocket #PriceAction #CryptoReversal #SwingTradeSetup #Altcoins #CryptoChart

#SOLUSDT: A Big Move In Making Crypto Market Is BullishCrypto market remain bullish and as for the SOLANA we remain quite optimistic; currently price is trading at critical level and waiting for liquidity to emerge. We need strong volume for big price movement. Follow a strict risk management while trading crypto market.
Good luck and trade safe.
Team Setupsfx
SOL - He is Soul-less now!SOL - being moved to the point but i think it will retrace back and ideal buys positions are not intact!

#SOLUSDT: Price to turn extreme bullish! Get ReadyHey there everyone! 👋
I’ve got some updates on the BINANCE:SOLUSDT price. It’s been testing a crucial level, and it’s showing some really strong bullish signs and patterns. But here’s the thing, we’re starting to think there might be a possible reversal coming up in the next few days. If we’re right, the price could hit all three targets we’ve been tracking.
Remember, though, that this is just our analysis, and it’s always a good idea to use accurate risk management when you’re trading.
Thanks for your support! 😊
If you want to help us out, here are a few things you can do:
- Like our ideas
- Comment on our ideas
- Share our ideas
Team Setupsfx_

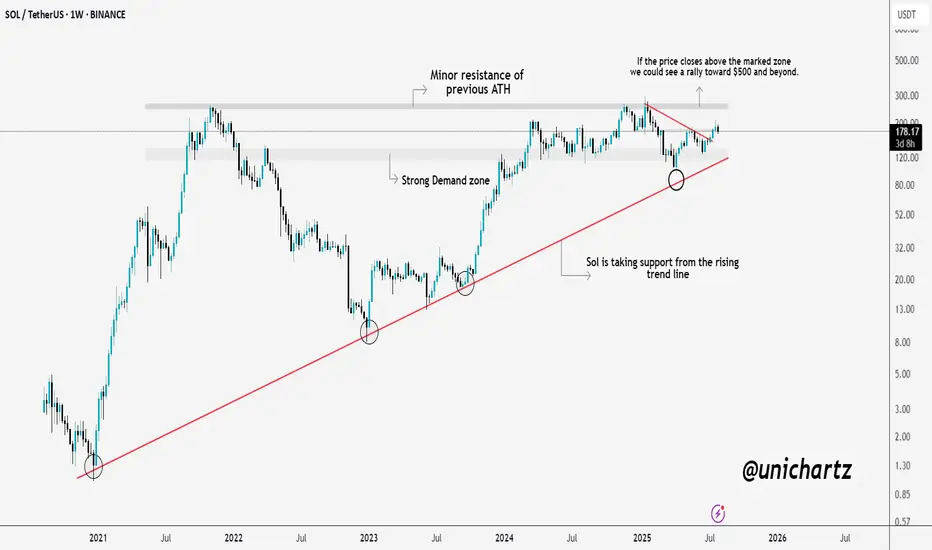
Massive Move Loading? $SOL Prepping for a BreakoutSolana is showing real strength here.
CRYPTOCAP:SOL consistently taking support from the long-term rising trendline, a sign that buyers are defending key levels. We're also approaching a critical resistance zone, which was the previous ATH area.
If SOL manages to close above this zone, we could witness a strong rally towards $500 and beyond. Until then, it’s a crucial level to watch, a breakout here could set the stage for the next leg up.
DYOR, NFA
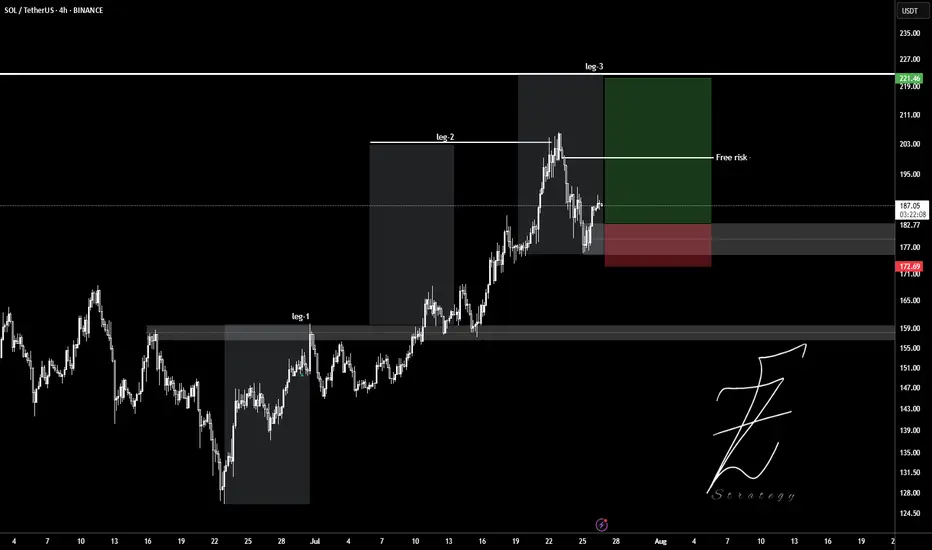
SOLUSDTWait for pollback to 180$ level and ready to get buy position.
Target set in leg2 and leg3.
Entry: 182
Stop: 177
Tp: 190 - 200 - 210 - 220
Please control Risk management.
FUTURES SIGNALFUTURES SIGNAL
Coin: SOL
Direction: LONG
🟢Input range: 179,5-179,7
✔️ТР: 182,47
❌SL: 178,11
Hedge scalp long after liquidity withdrawal. Target order block at 182.4. Stop behind PDL

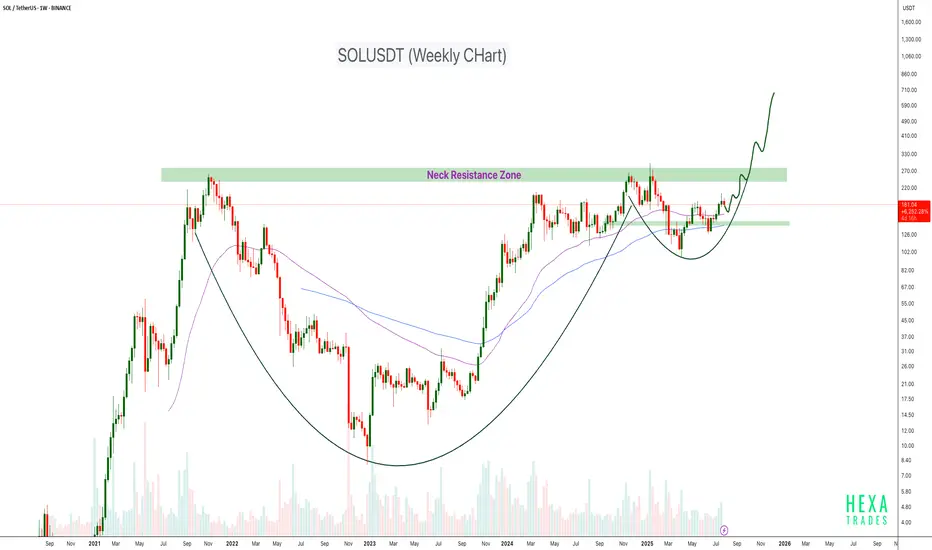
SOLUSDT Cup & Handle Formation CRYPTOCAP:SOL is forming a large Cup and Handle pattern on the weekly timeframe, a classic bullish continuation structure. Price is currently approaching the neckline resistance zone around the $250–$280 level. This area has acted as a major barrier in the past, rejecting the price multiple times, but the structure suggests it's now being retested with greater momentum.
If the neckline breaks cleanly with strong volume, the projected target could push SOL into the $600–$700+ range over the coming months.
Cheers
Hexa
BINANCE:SOLUSDT COINBASE:SOLUSD
SOL gives a SOUL!SoL just has happened as I told and mentioned earlier, this range looks very lucrative as of now and can turn things in a good manner! Observe where it goes

SOLUSD 4H — Holding the Line Before Altseason?Solana’s 4H chart presents a textbook continuation setup — a steady ascending trendline combined with well-defined resistance zones stacked overhead. This kind of compression within an uptrend often precedes explosive expansion, especially when aligned with broader altcoin market sentiment.
📊 Structural Breakdown:
Trendline Support:
Sol has maintained a rising trendline since early June, consistently bouncing off higher lows. This provides a dynamic support zone currently sitting around ~$175–180.
Horizontal Support:
The horizontal box at ~$175 represents prior structure highs turned into support — tested multiple times and aligning with the trendline. A breakdown here would be structurally significant.
Resistance Layers to Monitor:
$215 – Minor S/R flip and local liquidity cluster
$245 – Consolidation ceiling from Q1, where sellers previously took control
$270 – Clean weekly-level rejection from January
$300–310 – Final major resistance from the post-FTX crash range; breakout here signals full bullish expansion
Market Context:
The broader altcoin market is coiling, with majors like ETH and SOL holding structure while BTC ranges. If Bitcoin remains sideways or breaks slightly higher, capital rotation could drive a full “altseason” wave — with SOL as one of the first movers.
🔍 Key Conditions to Watch:
✅ Bullish Scenario:
Price holds ~$175 and breaks above $215 with strong volume
Clean retest of breakout zones confirms continuation
Targeting $245 → $270 → $300 in stages
❌ Bearish Invalidation:
Break and close below $175 trendline support
Would shift bias toward a wider range or even short-term downtrend
⚙️ Indicators to Watch:
4H RSI holding above midline (50) supports bullish continuation
MACD crossover + volume expansion = trigger confirmation
This chart is a reminder that you don’t need to chase green candles — spotting compression structures and planning for breakout zones is where the edge lies. Whether you’re positioning spot or looking for a leveraged entry, this structure rewards patience and timing.

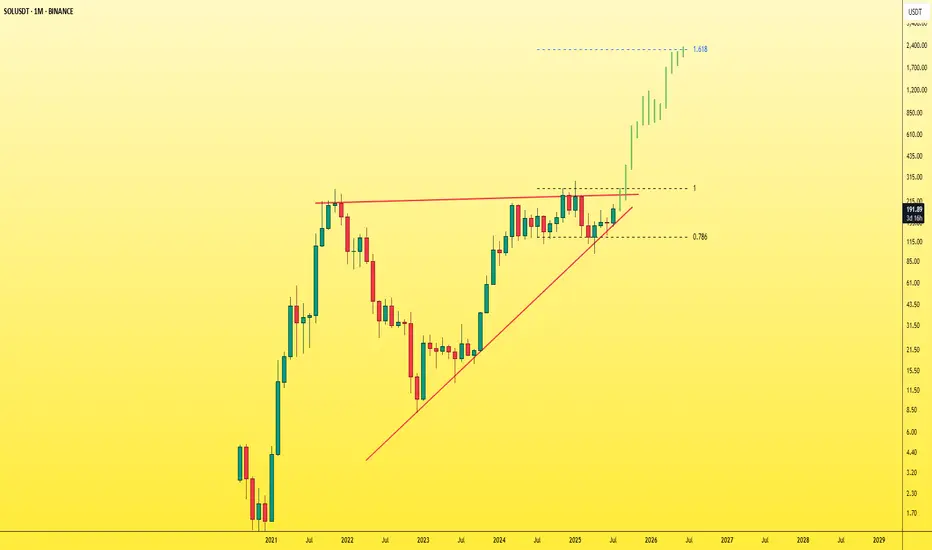
SOL - Don't miss the breakout before it's too late!The symmetrical triangle pattern on the monthly timeframe is showing signs of weakening after multiple failed breakout attempts — and now, a breakout seems highly likely.
Once SOL breaks out of this triangle, it will enter price discovery mode , opening the door to a massive bullish move. At that point, most traders will start saying “it’s too late”, while SOL keeps rallying aggressively — fueled by FOMO and liquidity traps.
You'll see:
- People outside the market waiting for a pullback that never comes.
- Traders inside the move getting shaken out by small dips and volatility.
Right now, SOL is still in a fair trading zone and available at a reasonable price .
Don’t wait for it to explode and then chase. Get in before the breakout .
Best Regards:
Ceciliones🎯
SOL - YOUR Choice of SOUL! LOLSOL as usual, pretty straight forward, short on the red, buy on the green, lines abbreviated for you to understand where
Just like #AKRM, #SOL can also pump 100%Just like #AKRM, #SOL can also pump 100%..
SOL will also have this kind of exit rally. Whether there is a war between the US, Iran, and Israel or not, the market will crash very badly.

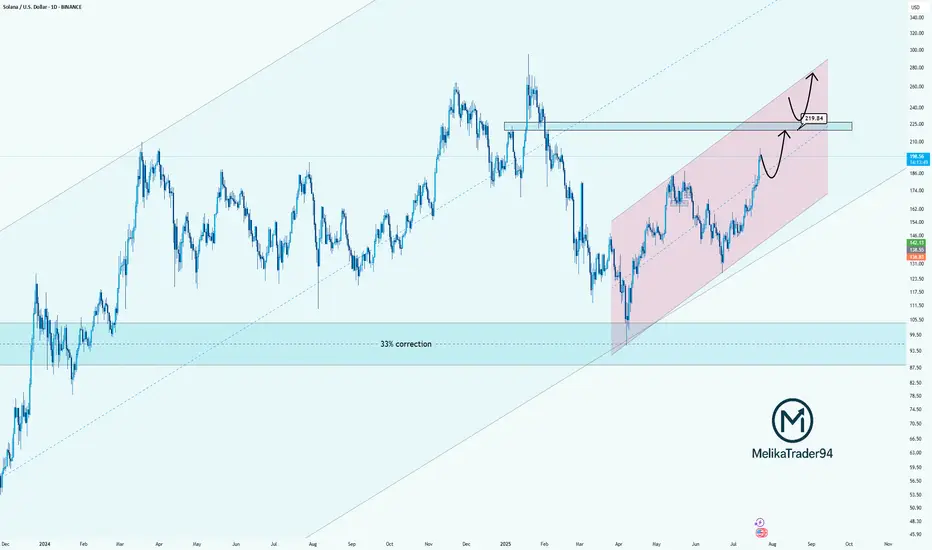
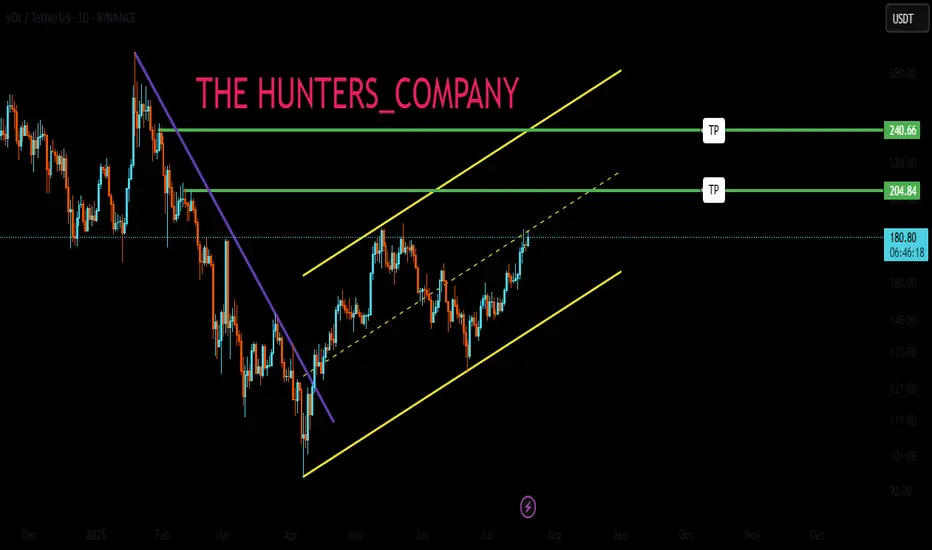
Solana Approaching Key Resistance: watch for $219Hello guys!
Solana has been trending strongly inside a rising parallel channel, recovering steadily after a significant 33% correction. The bullish momentum is clear, and the price is now approaching a key resistance zone near $219.84, which previously acted as a major turning point.
Here’s what I’m watching:
Strong uptrend within the pink channel shows controlled and healthy growth.
$219.84 is a critical decision zone. Price could:
React with a pullback before pushing higher,
Or break through it and flip the level into support for the next bullish leg.
The reaction in this zone will determine the next structure.
Whether we see a temporary correction or continuation to new highs.
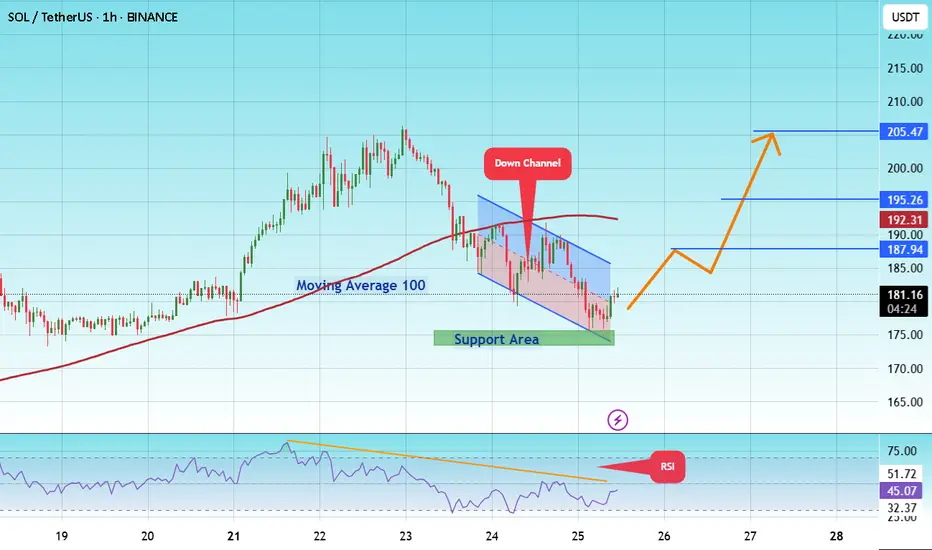
#SOL/USDT coin market structure analysis#SOL
The price is moving within a descending channel on the 1-hour frame and is expected to break and continue upward.
We have a trend to stabilize above the 100 moving average again.
We have a downtrend on the RSI indicator that supports the upward move with a breakout.
We have a support area at the lower boundary of the channel at 175, acting as strong support from which the price can rebound.
We have a major support area in green that pushed the price upward at 174.
Entry price: 181.
First target: 187.
Second target: 195.
Third target: 205.
To manage risk, don't forget stop loss and capital management.
When you reach the first target, save some profits and then change the stop order to an entry order.
For inquiries, please comment.
Thank you.
SOLANA UPDATEHello friends🙌
📉Given the decline we had, you can see that buyers came in and supported the price and were able to change the trend and create an ascending channel.
📈Now, considering that the price is hitting higher ceilings and floors, we can expect an ascending wave until the ceiling of the channel.
Don't forget risk and capital management.⚠
🔥Follow us for more signals🔥
*Trade safely with us*
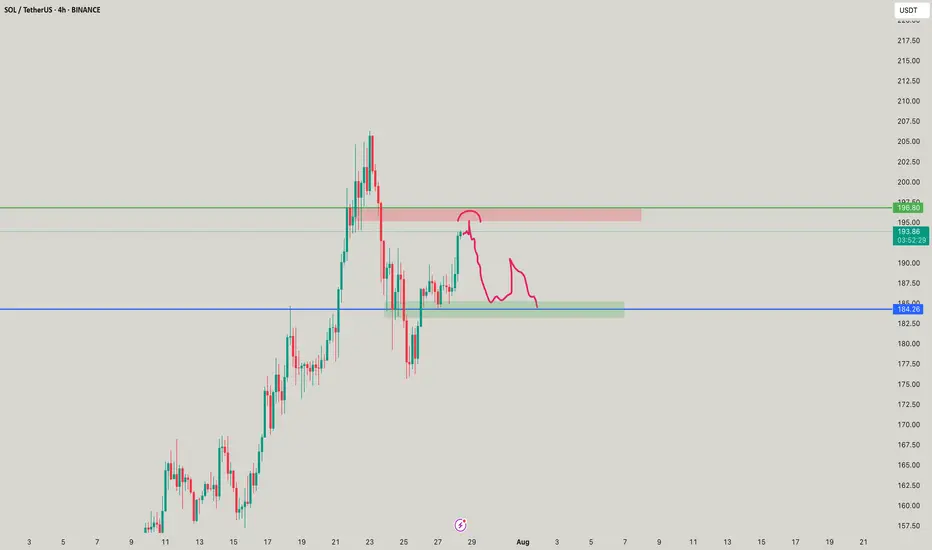
Solana Price Faces Reversal At $200 As Profits Hit 5-Month HighBINANCE:SOLUSDT price has risen 21% in the past week , now trading at $199. Despite breaching the $200 mark, Solana has failed to maintain this level, marking a five-month high.
The Net Unrealized Profit/Loss (NUPL) indicator for BINANCE:SOLUSDT shows that profits have reached a five-month high . This signals that many investors are in profit, raising concerns about a potential sell-off.
If these factors hold true, BINANCE:SOLUSDT price could decline toward the support levels of $188 or even drop to $176 . A move below these levels could erase a significant portion of the recent gains and shift the altcoin into a bearish trend.
However, if investor confidence remains strong and the market continues to show bullish signs, BINANCE:SOLUSDT could stabilize above $200 . Securing this level as support could propel the price back toward $221, invalidating the bearish outlook.
SOLUSDT on Fire! Bullish Wedge Fuels INSANE Upside Potential!BINANCE:SOLUSDT has been exhibiting strong bullish momentum, currently trading within a broadening wedge pattern. This technical structure often signals increased volatility and the potential for decisive moves in either direction. In the present scenario, the breakout above the psychological $200 resistance level suggests that bulls are firmly in control, fueling hopes of further upside.
The continuation of momentum hints at the market preparing for another leg up. The immediate price target lies at $300, where traders may expect some profit-taking and resistance. However, should momentum sustain and buying pressure persist, BINANCE:SOLUSDT has the potential to surge toward the $700 region, aligning with the pattern’s projected price expansion.
As always, managing risk is key. Use a well-placed stop loss below the support level to protect your capital. Breakouts can be explosive, but discipline and proper risk management make all the difference.
BINANCE:SOLUSDT Currently trading at $201
Buy level : Above $200
Stop loss : Below $150
Target 1: $250
Target 2: $300
Target 3: $500
Target 4: $700
Max leverage 2x
Always keep stop loss
Follow Our Tradingview Account for More Technical Analysis Updates, | Like, Share and Comment Your thoughts

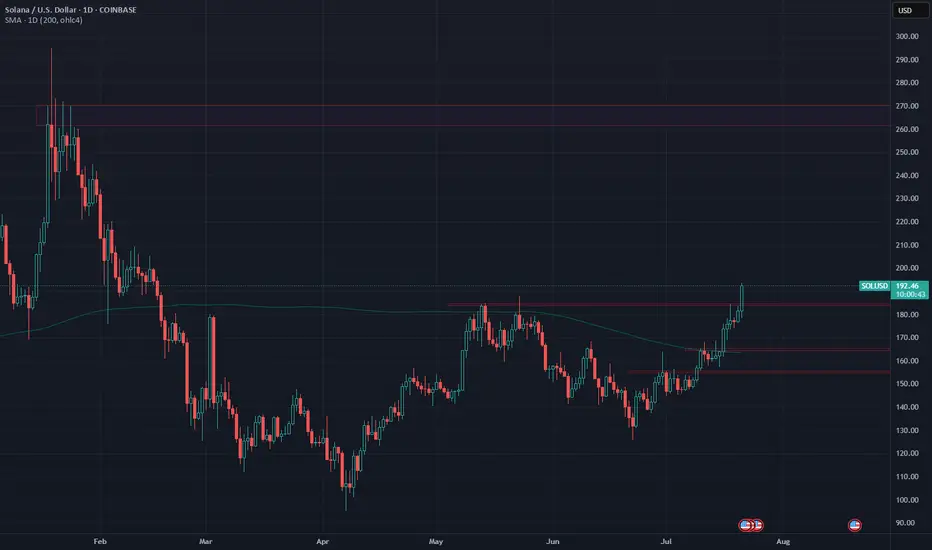
Solana Enters Bullish TerritorySOL has been showing strength since it reclaimed the 1D 200MA last week.
Currently trading around $192 - above May's highs - continued bullish momentum could see price test Jan highs around $270.
Until then, any retracement could be a buying opportunity.
SOLUSDT - UniverseMetta - Analysis#SOLUSDT - UniverseMetta - Analysis
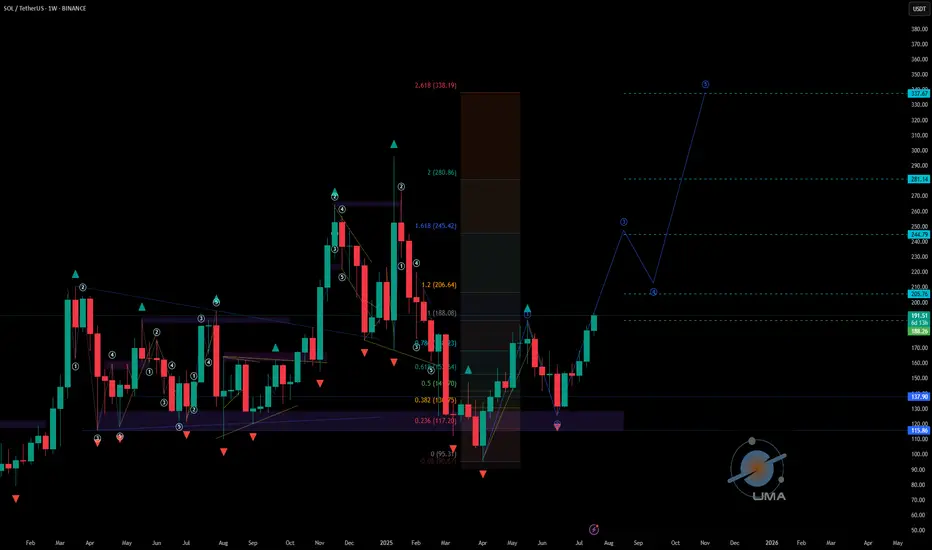
The price on W1 formed a double 3-wave structure. It is also worth considering the previous development for 2-3 months to reach all levels and update ATH. Against the background of the growth of all other assets, and the possibility of the beginning of the altseason, this pattern can be considered for a set of positions in the portfolio. The nearest targets will be at the level of 206 - 245. When the entire structure is realized, we can see a price of 338 per asset. Observe the risks.
Target: 206 - 338