SOL BUY Setup SMC or SRMHey guys,
In this position we'll BUY SOLUSDT on 93.88$, TPs is liquidity levels that shown with $$$, and $$$$. My good TPs are 105.80$, and 106.49$ with R/R above 11 and 12 :)
SL that shown on chart.
Follow me and be update and relax.
One Setup for All of your Life \(^*^)/
just for laugh! Please be careful and rely on your investment money management plan.
My suggestion is 2-5% of your balance.
Solusdtlong

More Solana Dubious SpeculationThis one is the more bullish of the two because the AR would bring us up into the 170s before crashing back down. Again though I'm just messing around with the major macro fib time and some macro Wyckoff possibilities on this one

Solana Bullish Until February 20thThis is the bullish scenario for Solana right now
From here to 125.84 supply & extension on wave 1. that's gonna be wave 3. Either there or the 1.618 at 128.08
Afterwards we retrace back down to the top of wave 1 at 106.56 and from there make one last push up into this daily FVG at 146.16
$146.48 is also the bearish OB that broke structure causing the bear market and a major SFP
February 20th major macro fib time would line up with the top of wave 5
See comments for additional confluences

Interesting Pattern on Solana!....What do you think?Solana has broken down out of a rising channel only to create a new channel.
Volume falling for 2 days.
What's next?
BINANCE:SOLUSDT COINBASE:SOLUSD

SOL/USDT Looking BullishA bull flag formation is evident in SOL/USDT. I'm watching for a breakout, and if today's daily candle closes above $96.30, the next target could be $102. Keep an eye on it.

SOL SOLANA SOLUSD Update Jan 25 2024Sharing Solana update here from TTR:
I havent updated SOL since after I took nice profits on it.
Here is a potential wave 2 setup down, which should bottom around April or May.
It seems that ABC down is in play now, with A being in place on that 23rd Jan low, or it can be printed anytime now, not later than the end of the month or so.
The B wave is expected to hit around the middle of Feb, and the C wave down into the Apr low
- B wave target is 108-116
- C down should bottom at or below 68.50
I will update the bull targets when we are near the C wave low.
Everyone should be making money on all of our crypto updates; just don’t use any leverage and options!!! As the timing is always an issue, the best way is to accumulate when the price is going down at support levels and hold for the rally to begin.

SOL/USDT Market Correction OpportunitiesWe are considering a scenario involving the decline in the SOL's value and the initiation of asset purchases.
It is worth noting that the current correction to the $79.60 level represents a deviation of more than 37% from the prevailing local peak at $126.21. The price movement chart within the descending channel during the correction indicates a reduction in investment activity and profit-taking.
Given the anticipated continuation of the downward trend and considering the potential attainment of price levels around $70 and below, we are contemplating the possibility of strategically re-entering positions in SOL to optimize the portfolio and capitalize on market conditions in our favor.

SOL/USDT BINANCE:SOLUSDT.P
This idea has a medium-term profit target.
Enter to Buy stop limit.
All targets are indicated on the graph with a red eye.
- Risk 0.5% on deposit
- R/R 1/2
P.S (This is not an investment recommendation, this is my personal opinion.

SOLUSDTSOLUSDT is trading in symmetrical triangle pattern. The price was reacting well the support and resistance of triangle.
Currently the price is trading at the apex of the triangle and is about to give the breakout of triangle and now retesting the broken level where it is also forming a local support zone and seems like the price may go for another leg higher.
If the breakout sustain to upside the optimum target could be 126.
What you guys think of this idea?

SOL/USDT Looking BullishTRADE ALERT!SOL
Ticker: USDT/SOL
Entry: 100-102
Take Profit: 112-120
Stop Loss: 85.9
Risk to reward: 1:2
Technical Thesis:
Sol is in a Falling wedges which is a bullish pattern, once it break and retest a pump is Expected.

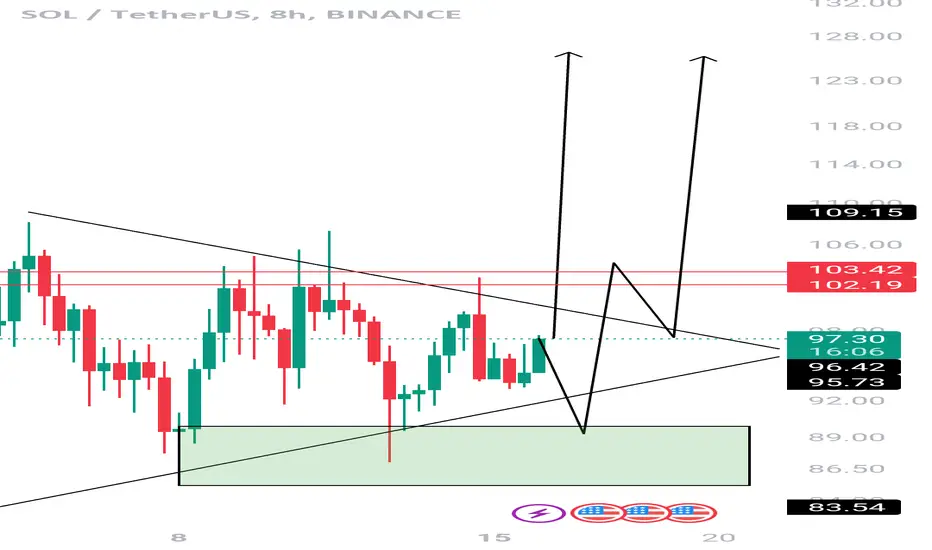
Sol/USDT: Preparing for a Bullish Move
The Sol/USDT pair is currently exhibiting signs of price accumulation within a defined zone. Based on my analysis, there are indications of a significant upward movement in the near future. Specifically, the 8-hour time frame appears strongly bullish, suggesting a potential rise of 25-40% for Solana's price in the coming days.
Please note that the information provided here should not be considered financial advice. Remember to conduct your own research and consult with a professional financial advisor before making any investment decisions.
SOLUSDT Long BiasBINANCE:SOLUSDT.P
1D TF in uptrend, pulled back and took 4h liquidity then market shifted to the upside quiet nicely.

SOL Is not done yet !! Solana is not over yet ... Expecting to see a move towards 135 ... Current low time Frame Structure is getting ready for a move.

SOLUSDT is Bullish now| BUY opportunity !Hello Traders, here is the full analysis.
SOL can very easily see some strong growth from this point. GOOD LUCK! Great BUY opportunity SOLUSDT. I still did my best and this is the most likely count for me at the moment.
Support the idea with like and follow my profile TO SEE MORE.
Traders, if you liked this idea or if you have your own opinion about it, write in the comments. I will be glad 🤝
Patience is the If You Have Any Question, Feel Free To Ask 🤗
Just follow chart with idea and analysis and when you are ready come in THE GROVE | VIP GROUP, earn more and safe, wait for the signal at the right moment and make money with us💰

📈💰 SOL/USDT: $150 Target! 🎯🚀🌱🔮 January: The Month for SOL! 🌙🌟
🔥💰 February: BNB Takes the Spotlight! 💥💥
🤑💡 Hey there, crypto enthusiasts! Buckle up because things are about to get exciting! 🚀 We've got some great news to share! 📢💫
📈💸 SOL/USDT is gaining serious momentum, and we predict it's heading straight for the $150 mark! 📈🎯🤑 This fantastic cryptocurrency pair is gaining popularity, and it's showing all the signs of a lucrative investment opportunity! 📈💰💎
✅ But remember, we're not financial advisors! 🙅♂️⚠️ So, always do your thorough research and make informed decisions. Your financial journey is unique, and it's crucial to take charge of your investments. 🧐📚
⚡️💫 That being said, January is expected to be an exciting month for SOL! 🌱🌙 The cryptocurrency's growth potential is attracting a wider investor base, and market trends indicate an upward trajectory! 📈🚀 Get ready for some major gains! 💥📈💸
✨🚀 February, on the other hand, will be all about BNB's stellar rise! 💰🔥 This cryptocurrency has been making waves lately, with exciting developments and increased adoption. It's set to rock the crypto world! 🌟💸✨
⏳ So, time is ticking, and the opportunity to catch SOL/USDT at $150 is just around the corner! 🌅⌛️ Don't miss out on this potentially profitable ride! 📈🤑💰


SOLUSDT PRE<>POST ETF NEWSKeeping the analysis simple, leverage only demand-supply zones and fibs to chart the solana-trader's emotions.
At the time of posting, SOLUSDT is at month support - resist zone.
DAY: SOLUSDT respected the supply zone on the day timeframe, and retraced downward.
With volatility, I'm expecting some whiplashes. But with overall bullish optimism from the market, buy limits will be set at $89, $85 and $80.50.
Stop losses at $69
Take profits at $174

sol long setuphello Traders, here is the full analysis for this pair, let me know in the comment section below if you have any questions, the entry will be taken only if all rules of the strategies will be satisfied. I suggest you keep this pair on your watchlist and see if the rules of your strategy are satisfied. Please also refer to the Important Risk Notice linked below.


SOLUSDT.1DBased on the provided market data, the cryptocurrency SOL is currently priced at $97.96 against USDT. The Relative Strength Index (RSI) for 4 hours, 1 day, and 7 days are 53.35, 52.34, and 76.52 respectively. The RSI values suggest that the market is neither oversold nor overbought in the short term (4h and 1d), but it is slightly overbought in the longer term (7d).
The Moving Average Convergence Divergence (MACD) for the same periods are -1.86, 5.21, and 19.70. The negative MACD in the 4h chart suggests a bearish signal, while the positive MACD in the 1d and 7d chart suggests bullishness in the longer term.
The Bollinger Band (BB) for 4h, 1d, and 7d are 102.26, 120.53, and 113.10. The current price is below the middle band in all cases, indicating a potential upward movement.
The support levels for 4h, 1d, and 7d are $85.95, $80.06, and $76.52, and the resistance levels are $102.26, $107.56, and $115.30. This suggests that the price has a potential to climb up to these resistance levels if it doesn't break down through the support levels.
In conclusion, SOL shows mixed signals. While the MACD and RSI indicate a potential upward trend in the longer term, the negative MACD in the short term (4h) may suggest some bearishness. It is recommended to watch the support and resistance levels closely. As always, it's crucial to consider other market factors and your risk tolerance before making any investment decision.

buy in breakout(SOL)📊Analysis by AhmadArz:
buy in breakout trendine
🔍Entry: 95.1
🛑Stop Loss: 93.57
🎯Take Profit: 96.67
🔗"Uncover new opportunities in the world of cryptocurrencies with AhmadArz.
💡Join us on TradingView and expand your investment knowledge with our five years of experience in financial markets."
🚀Please boost and💬 comment to share your thoughts with us!

Am I Right to Short Solana? Let's See! {07/Jan/2024My first trade analysis of 2024 on Crypto Currency.
Educational Analysis says SOLUSD may move in this range for some time according to my technical.
Broker - Binance
This is not an entry signal. I have no concerns with your profit and loss from this analysis.
Why this range?
Because Solana Made a lot of gains last year 2023, May is a time to push down a bit and there will be a lot of liquidity.
Although it is in an uptrend, the market may come down to collect sell-side liquidity and fill fair value gaps. Then shoots up to the new high.
Let's see what this pair brings to the table in the future for us.
Please check Comment section how it turned out for this trade.
I HAVE NO CONCERNS WITH YOUR PROFIT OR LOSS,
Happy Trading, Fx Dollars.

wait for break-trendline (SOL)❤️❤️Thanks for boosting 🚀 and supporting us!
📈analytics by priceaction
📊 (Entry) : 99.72
🔴 Stop Loss : 94.51
🎯 Take Profit : 104.40 -109.08 -114.90
🔗 For more communication with us, In the footnote and send a message in TradingView.
👨🎓 Experience and Education: Our trading team has five years of experience in financial markets, especially cryptocurrencies.
