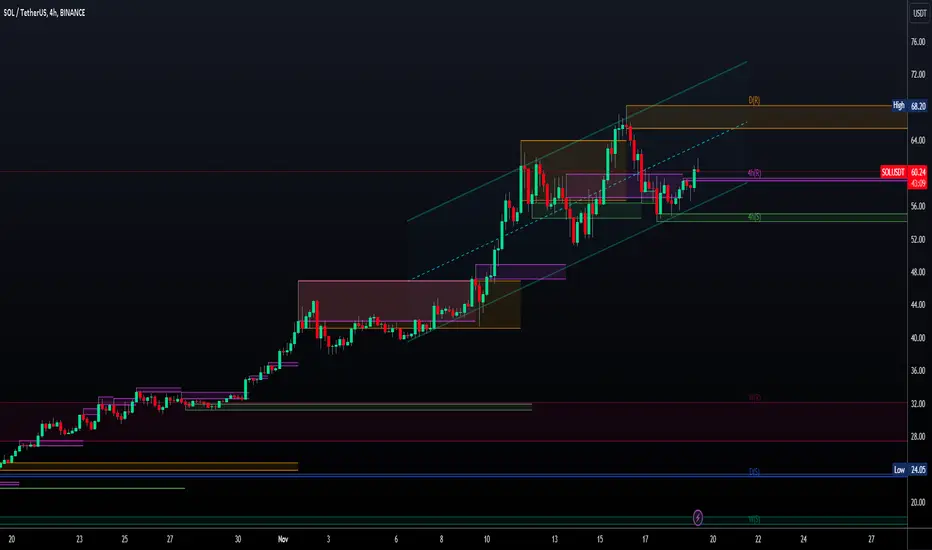
SOLUSDT triangle supportCRYPTOCAP:SOL approaching fibonacci support near triangle support, this is a good opportunity to enter bullish market.
we can set 3 different target, at triangle resistance, fibonacci projection and triangle projection
My trading today :
Buy now around 60.163
Pending buy at 58.390
close 50% position at 65.451
close 25% position at 71.000
close 25% position at 88.169
happy trading
Solusdtlong

#SOL UpdateBreaking the resistance zone. It is pulling back to the resistance zone. Meanwhile, it is moving in a medium-term ascending channel with the change of slope, which is still available as a target if it is supported and confirmed by the candlestick.

Potential Breakout for Solana with Favorable IndicatorsI wanted to bring your attention to an exciting opportunity in the cryptocurrency market, specifically regarding Solana (SOL). Based on recent market analysis, it appears that SOL is poised for a potential breakout.
Several key indicators suggest a favorable outlook for SOL's price movement. Firstly, the Relative Strength Index (RSI) is currently in a neutral position, indicating that the cryptocurrency is not overbought or oversold. This suggests a balanced market sentiment and potential room for upward movement.
Additionally, the Commodity Channel Index (CCI) is in the upper band, further reinforcing the positive outlook for SOL. This indicates that SOL's price is trending higher than the average price over a given period, signaling potential bullish momentum.
Furthermore, the moving average combination displays a buy signal for SOL. This combination of moving averages is widely regarded as a reliable indicator for determining market trends. In this case, the moving average combination indicates a potential upward movement for SOL's price.
Considering these indicators, it is reasonable to conclude that SOL is presenting a compelling opportunity for investors. The combination of a neutral RSI, CCI in the upper band, and a buy signal from the moving average combo suggests a potential breakout shortly.
I wanted to share this information with you, as I believe it could be of interest to you and align with your investment strategy. However, I encourage you to conduct your research and consult with your financial advisor before making any investment decisions.
Should you have any questions or require further information, please do not hesitate to comment away. I am here to assist you.

SOLUSD Next Leg UpSolona been ripping, last ATH was around $250ish, retraced a little over 95% due to the retracement. Some considered it was a dead project as some of the FUD(SBF, Broken chain, VC etc...) and the retracement. However.... I don't think this mofo is done. The price movement has outcompeted all of the top 20 MRKTCAP. $70 is resistance and the new consolidation levels if broken, seems to want to reclaim that $250 mark sooner than later. The trend lines are point up, the FA is impenetrable at this point as alot of it is silence and a product just gets released. Risk is low given the potential upside....... $250 will be chump change if the price action continues.
"Maybe this honey badger isn't my wife."
-k3wLk47

SOL → Which Way Solana? Let's Answer That Question With a Chart.Solana is at a crucial decision point; fail to break resistance or rocket to the next level? Right now it's failing to get back into the bull channel, but hasn't yet broken to the downside.
How do we trade this?
If you're not already in a trade, wait to enter one! For a long, we need a test of Support at the 30EMA, or a break of the Previous Resistance line followed by a support test and confirmation. To short, we need a failed breakout attempt of Previous Resistance and preferably, a confirmation bear candle closing on or near its low below the 30EMA.
Until then, let's see where the price action goes. FOMO (Fear of Missing Out) is your worst enemy. You're making more money by not falling for the seduction of market profit.
Trade Idea
Short Entry : $48.00
Stop Loss: $54.15
Take Profit: $35.70
Risk/Reward Ratio: 1:2
Long Entry : $73.00
Stop Loss: $107.00
Take Profit: $61.65
Risk/Reward Ratio: 1:3
Key Takeaways
1. Bull Channel, Bias to Long.
2. Bear Breakout, Watch for Sell Signal.
3. Still Above 30EMA, Watch for Support.
4. Do not Long until we break Previous Resistance.
5. RSI at 61.00, below Moving Average. Supports Short.
You are solely responsible for your trades, trade at your own risk!
If you found this analysis helpful, click the Boost button and let us know what you think in the comment section below!

Solana Local Top PossibilityWhen things get trending on high time frames I am a big fan of line break charts. This one here on Solana has not yet confirmed red but RSI is very sus. Setting very tight stops on longs now. Also debating on scaling out of long term swing bags. Not advise, good luck.

SOL - Solana BUY and SELL TargetsHi Traders, Investors and Speculators of Charts📈📉
As you know, we're trading in the opening moments of a new bullish cycle.
If you're trading Solana, this is the ONLY PLAN you need. In this analysis:
📢 Short Term Targets / highs and lows
📢 Near Term Targets / highs and lows
📢 Longer Term Targets / highs and lows
📢 Technical Indicator, short and near term
📢 Fractal / percentage increase to dump analysis
It's important to note that any cycle takes months to complete, sometimes even stretching over a year. Keeping this in mind helps you set realistic timeframe-goals for price targets.
If you found this content helpful, please remember to hit like and subscribe and never miss a moment in the markets.
_______________________
📢Follow us here on TradingView for daily updates📢
👍Hit like & Follow 👍
We thank you for your support !
CryptoCheck

$SOL Price Target: $75Solana has been on a tear the last few weeks, one of the best performing large-cap tokens this year.
How high could it go? Well, looking back to February of 2022 on the Monthly chart, $75 was the low point of the wick. Price recovered, and then fell through that level with the FTX collapse.
If CRYPTOCAP:SOL continues to climb, $75 would be a good place to take some profits.

Solana (SOL) coin completed setup for upto 27.50% pumpHey dear friends, hope you are well, and welcome to the new trade setup of Solana (SOL) coin with US Dollar pair.
Recently we caught almost 80% pump of SOL as below:
Now on a daily time frame, SOL has formed a bullish Gartley move for the next pump.
Note: Above idea is for educational purpose only. It is advised to diversify and strictly follow the stop loss, and don't get stuck with trade.

Time for consolidation? So as we know Solana made higher and went straight to 68 without even consolidating in last month and hit our first and second Take Profit target. There could be H&S pattern might be forming in 4H TF which means we could see 40-39 area or even go down to 33 area. But remember there is a huge support zone at 48-45 area. I wouldn't go into short position. Once Bitcoin Dominance goes down every alts will move like its bull-run.

SOL DEX Adds 3 Billion in New Trading Opportunities - Time to GoSOL DEX (decentralized exchanges) has recently added a staggering 3 billion in new trading opportunities, and it's time for you to take advantage of this exciting opportunity!
Imagine the possibilities that lie ahead as Soldex and Raydium, the leading decentralized exchanges, expand their trading volume by billions. This remarkable achievement not only demonstrates the growing popularity of SOL but also signifies the immense potential and trust placed in this cryptocurrency.
Now, you might be wondering, "What does this mean for me?" Well, let me tell you - this is your chance to go long on SOL and ride the wave of success! With the addition of 3 billion in new trading, SOL is poised to experience substantial growth and present you with potentially lucrative trading opportunities.
Why should you consider going long on SOL? Here are a few compelling reasons:
1. Unprecedented Trading Volume: The addition of 3 billion in new trading opportunities has catapulted SOL to new heights, attracting a diverse range of traders and investors. This surge in trading activity presents an ideal environment for profit potential.
2. Strong Market Demand: SOL has been gaining significant attention and recognition within the crypto community due to its innovative technology, scalability, and robust ecosystem. As more traders flock to SOL DEX, the demand for SOL is expected to surge, which can drive up its value.
3. Future Growth Prospects: SOL's impressive track record and continued development make it a promising investment option. With its commitment to scalability, security, and efficiency, SOL is well-positioned to become a leading force in the crypto market.
So, what are you waiting for? Seize this opportunity to get in on the action and go long on SOL today! The momentum is building, and you don't want to miss out on potential gains.
Remember, success often favors those who act swiftly and decisively. Don't let this incredible chance pass you by! Take the leap and go long on SOL now.

Journey with Sol (EMA 20 > 50 & 100, and RSI balanced at 58Solana is then a shining star that has been catching the attention of experts and investors alike.
What makes Sol truly special? Let me paint you a picture: imagine a scenario where the Exponential Moving Average (EMA) 20 is soaring above both EMA 50 and EMA 100, indicating a bullish trend. Simultaneously, the Relative Strength Index (RSI) holds steady at a balanced 58, signaling a perfect equilibrium between buying and selling pressure. Now, doesn't that make your inner trader dance with joy?
Given these promising indicators, I wholeheartedly encourage you to consider getting on board with Sol. This gem has the potential to bring some serious sunshine to your portfolio. It's time to capitalize on this golden opportunity and embark on an exciting journey towards profitability.
So, don your shades and join the ranks of successful traders who have already aligned themselves with Sol. Take action today and seize the moment to go long on Sol, setting sail on a happy and prosperous trading adventure.
Remember, opportunities like this don't come around every day. Let Sol light up your trading path and help you achieve your financial goals. Don't wait! Start your sunny journey with Sol today!

SOL/USDT - Solana: Trend Reversal◳◱ On the $SOL/ CRYPTOCAP:USDT chart, the Trend Reversal pattern suggests a pause in volatility, potentially gearing up for a breakout. Traders might observe resistance around 66.93 | 77.59 | 101.88 and support near 42.64 | 29.01 | 4.72. Entering trades at 60.28 could be strategic, aiming for the next resistance level.
◰◲ General info :
▣ Name: Solana
▣ Rank: 6
▣ Exchanges: Binance, Kucoin, Bybit, Huobipro, Gateio, Mexc
▣ Category/Sector: Infrastructure - Smart Contract Platforms
▣ Overview: Solana is a public base-layer blockchain protocol that optimizes for scalability. Its goal is to provide a platform that enables developers to create decentralized applications (dApps) without needing to design around performance bottlenecks. Solana features a new timestamp system called Proof-of-History (PoH) that enables automatically ordered transactions. It also uses a Proof of Stake (PoS) consensus algorithm to help secure the network. Additional design goals include sub-second settlement times, low transaction costs, and support for all LLVM compatible smart contract languages.
◰◲ Technical Metrics :
▣ Mrkt Price: 60.28 ₮
▣ 24HVol: 456,568,655.028 ₮
▣ 24H Chng: 5.219%
▣ 7-Days Chng: 7.22%
▣ 1-Month Chng: 123.40%
▣ 3-Months Chng: 184.97%
◲◰ Pivot Points - Levels :
◥ Resistance: 66.93 | 77.59 | 101.88
◢ Support: 42.64 | 29.01 | 4.72
◱◳ Indicators recommendation :
▣ Oscillators: BUY
▣ Moving Averages: STRONG_BUY
◰◲ Technical Indicators Summary : STRONG_BUY
◲◰ Sharpe Ratios :
▣ Last 30D: 8.67
▣ Last 90D: 4.44
▣ Last 1-Y: 1.91
▣ Last 3-Y: 1.47
◲◰ Volatility :
▣ Last 30D: 1.35
▣ Last 90D: 0.98
▣ Last 1-Y: 0.97
▣ Last 3-Y: 1.32
◳◰ Market Sentiment Index :
▣ News sentiment score is 0.48 - Bearish
▣ Twitter sentiment score is 0.57 - Bullish
▣ Reddit sentiment score is 0.48 - Bearish
▣ In-depth SOLUSDT technical analysis on Tradingview TA page
▣ What do you think of this analysis? Share your insights and let's discuss in the comments below. Your like, follow and support would be greatly appreciated!
◲ Disclaimer
Please note that the information and publications provided are for informational purposes only and should not be construed as financial, investment, trading, or any other type of advice or recommendation. We encourage you to conduct your own research and consult with a qualified professional before making any financial decisions. The use of the information provided is solely at your own risk.
▣ Welcome to the home of charting big: TradingView
Benefit from a ton of financial analysis features, instruments and data. Have a look around, and if you do choose to go with an upgraded plan, you'll get up to $30.
Discover it here - affiliate link -
SOL1h time frame
-
SOL is creating an ascending channel after crazy pump. 1.13 Fibonacci Extension is good to predict the resistance which is 70~74, this zone is also the structural resistance that formed from last bull market. Therefore, if you are holding long positions, should pay more attension when SOL reach the zone.

RALLY COMING TO AN END. For now..SOL showing impressive strength so far this year. Feels overextended, looking for shorts in the $60+ area. Late longers will be punished, bottom buyers will panic sell; and i will buy back in. 2024 will be BIG.

SOL | Solana| $ 12.4-12.7 Buy |long entry pointThe lingering fall will end in the specified range. I put a limit order in long. We will continue to follow the chart of this instrument.

SOL Elliott waves analysis on pitchfan (Daily chart)BINANCE:SOLUSDT BINANCE:SOLUSD BITGET:SOLUSDT KUCOIN:SOLUSDT
I guess SOLANA is going to correct around $48 - $47.6
Then Start the 3rd Elliott wave to $83.
The correction will be around $71 and the final Elliott wave touch $104 (fibonacci 0.382).
The A,B,C correction will dump the price to $77 after that.

SOL SOlANA Technical Analysis And Trade IdeaEngaging in a meticulous examination of Solana's charts uncovers a retracement pattern from its recent high, prominently evident on the 1D and 1W timeframes, we consider a further pullback. The pivotal consideration revolves around whether this retracement will escalate to a 1W entry point, or if there's a potential for a strategic entry at a 1D retracement level. Our video delves into the SOL analysis across these time frames, identifying two possible trade opportunities grounded in market structure, price dynamics, trend analysis, and other critical aspects of technical analysis.
It's crucial to emphasize that the insights presented in this content are intended strictly for educational purposes and should not be interpreted as financial advice. Participating in the cryptocurrency market inherently carries a substantial level of risk, and as such, it is imperative to judiciously integrate robust risk management strategies into your trading plan to adeptly navigate the challenges associated with these dynamic markets.

SOL will see 136 $SOL has crossed the weekly resistance level. we can see ichimoku cloud break out too. I predict that SOL will come up to 78 in near future and then it will go up to 136.

$SOL to $4,380Fundamentals: Firedancer validator node upgrade expected around Q2 of 2024, pushing TPS over 1.2m+ for a single cpu core.
Technical: Parallel channel on Log Scale showing strong support line. With similar timeline of 21 bull run, we get a target of 4380, slightly above the 1.618 Fib Extension with a blow off top.

Solana Skyrockets to New Highs! Seize the OpportunitySolana, the rising star of the crypto market, has just hit a new milestone by surging above $45, accompanied by positive MACD moves. This is an incredible moment for all of us, and I encourage you to seize this golden opportunity to long Solana!
The recent surge in Solana's price is nothing short of remarkable, and it's a testament to the immense potential and growing demand for this remarkable cryptocurrency. With its lightning-fast transactions, low fees, and robust scalability, Solana has set itself apart from the competition, captivating the attention of both traders and investors alike. Now, with the price soaring to new heights, it's time to ride this wave of success and maximize our potential gains.
The positive MACD moves further reinforce the bullish sentiment surrounding Solana, indicating a strong upward trend. This technical indicator, combined with the fundamental strength of Solana's ecosystem, creates an irresistible opportunity for traders like us to capitalize on this upward momentum.
So, what are you waiting for? It's time to take action and make the most of this thrilling moment! Here's your call-to-action: Long Solana now and position yourself for potentially massive profits. By going long on Solana, you'll be joining a vibrant community of traders who share your excitement for this revolutionary cryptocurrency.
Remember, successful traders are those who recognize and seize opportunities when they arise. Solana's meteoric rise presents an ideal chance for us to ride the wave and potentially reap substantial rewards. Don't let this moment slip away!
To get started, I recommend conducting thorough research, analyzing the market trends, and formulating a sound trading strategy to ensure you make informed decisions. Consider setting stop-loss orders to protect your investments and always stay updated with the latest news and developments surrounding Solana.
Let's embark on this exciting journey together and make the most of Solana's incredible surge! Long Solana now and position yourself for a potentially profitable ride.
Wishing you all the best in your trading endeavors!

SOLUSDT NEW TIMES COMING? Thank you for reading this update.
Solona looks to have a new incoming volume
Will this bring this volume Solana to $100 with time?
This volume depends on day trade and has no guarantees for the long term.

Is Solana getting ready to breakout? The next stop is $40+?Hello everyone, today we are going to look at Solana.
For half a year the asset was moving in the sideways channel and failed to overcome the EMA-200 and Fibo level of 0.382. The price went to the correction to the support level around 13$.
Now we can expect a breakdown of EMA-200 and movement to 0.382 Fibo level.
After the fixation above this Fibo level, you can expect further growth in the asset up to $47, but maybe we can stop near $40, because there is a strong resistance level of the price, formed in June 2022.
This is not a financial advice, everything you do you do at your own risk.
