#SOL/USDT coin market structure analysis#SOL
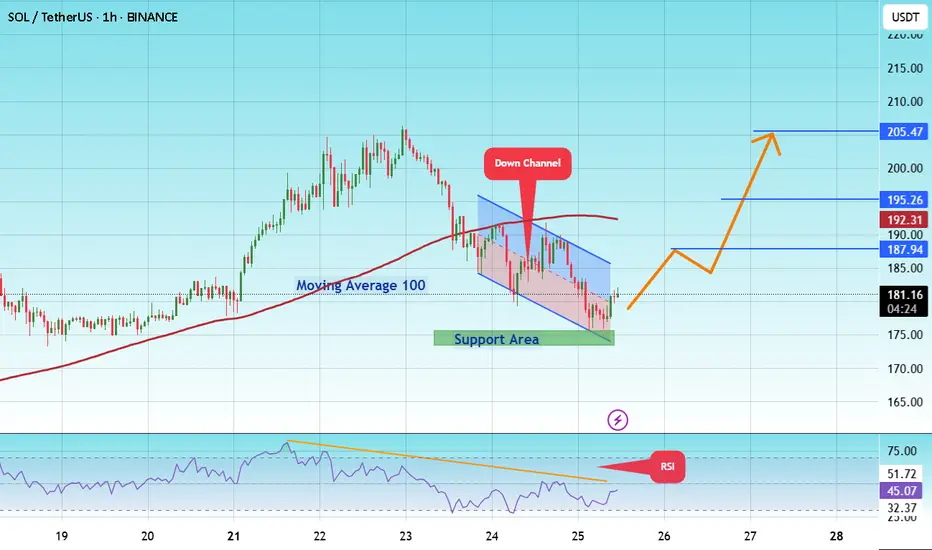
The price is moving within a descending channel on the 1-hour frame and is expected to break and continue upward.
We have a trend to stabilize above the 100 moving average again.
We have a downtrend on the RSI indicator that supports the upward move with a breakout.
We have a support area at the lower boundary of the channel at 175, acting as strong support from which the price can rebound.
We have a major support area in green that pushed the price upward at 174.
Entry price: 181.
First target: 187.
Second target: 195.
Third target: 205.
To manage risk, don't forget stop loss and capital management.
When you reach the first target, save some profits and then change the stop order to an entry order.
For inquiries, please comment.
Thank you.
Solusdtshort
SOLANA UPDATEHello friends🙌
📉Given the decline we had, you can see that buyers came in and supported the price and were able to change the trend and create an ascending channel.
📈Now, considering that the price is hitting higher ceilings and floors, we can expect an ascending wave until the ceiling of the channel.
Don't forget risk and capital management.⚠
🔥Follow us for more signals🔥
*Trade safely with us*
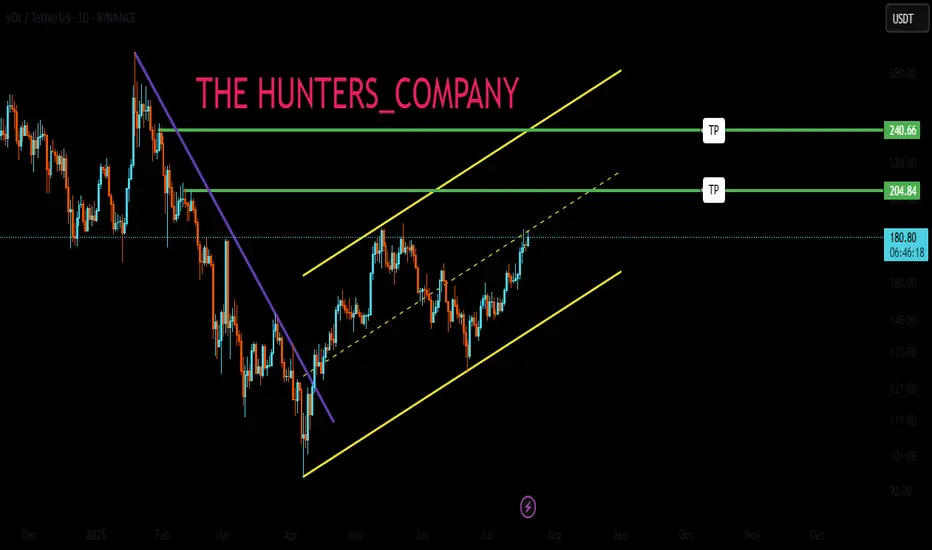
SOLUSDTThis signal for bull-trend because breaked trendline and higher high higher low.
best entry: 154
stop: 136
traget: 226
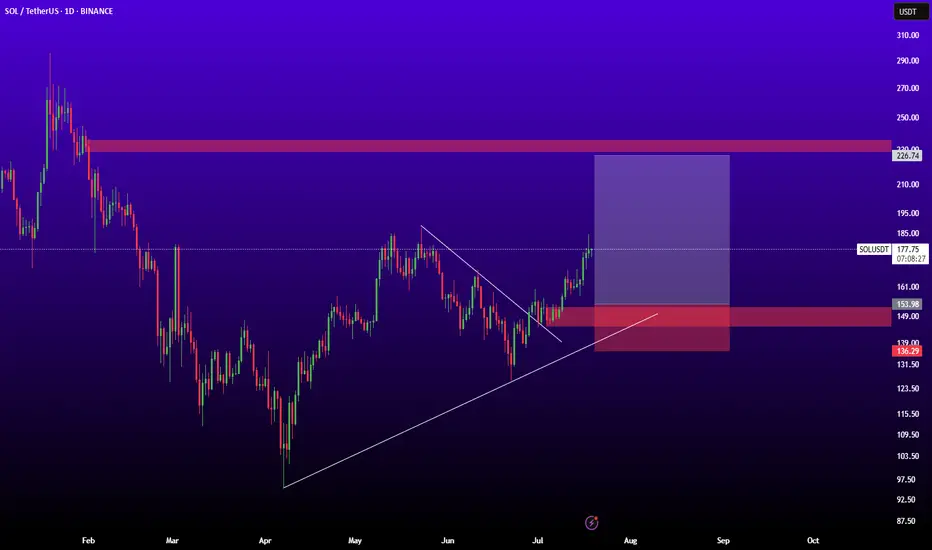
SOLUSDTThis chart BINANCE:SOLUSDT say to me that change of character. But we need to best confirmations for buy for example: pollback to 143 - 147 $ and higher high next pollback to level.
Support: 147 - 143 - 131.50
Resistance: 158 - 170 - 177 - 183
⚠️Please Control Risk Management in trades.

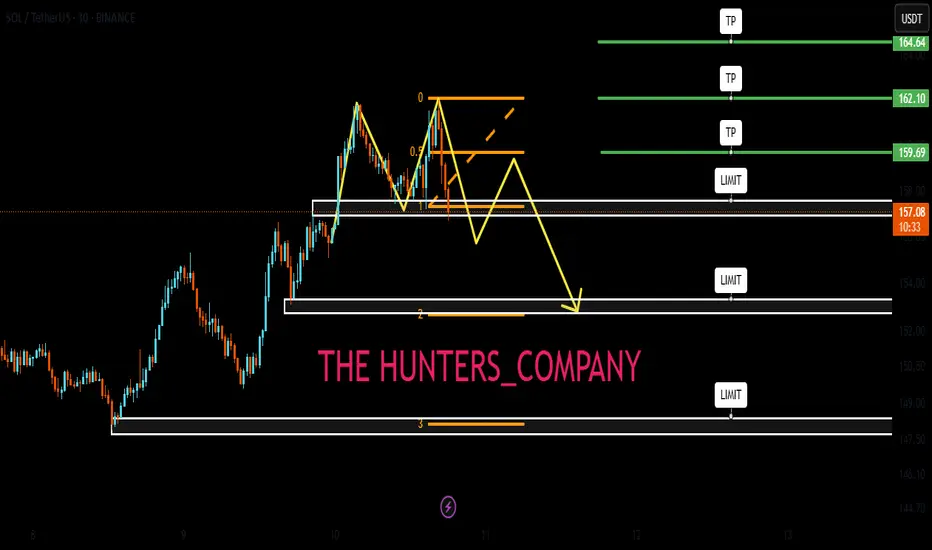
Solana UpdateHello friends🙌
After the price growth we had, the price hit the resistance level of $160 twice and failed to break it, which caused a double top pattern to form, which if confirmed, there is a possibility of falling to the specified areas.😉
The specified areas are good prices for buying in steps, of course, with capital and risk management.✔
🔥Join us for more signals🔥
*Trade safely with us*
#SOL/USDT Loves THIS Pattern | BULLISH#SOL
The price is moving within a descending channel on the 1-hour frame, adhering well to it, and is on its way to breaking strongly upwards and retesting it.
We have a bounce from the lower boundary of the descending channel. This support is at 143.
We have a downtrend on the RSI indicator that is about to break and retest, supporting the upside.
There is a major support area in green at 142, which represents a strong basis for the upside.
Don't forget a simple thing: ease and capital.
When you reach the first target, save some money and then change your stop-loss order to an entry order.
For inquiries, please leave a comment.
We have a trend to hold above the moving average of 100.
Entry price: 149.
First target: 153.
Second target: 156.
Third target: 159.
Don't forget a simple thing: ease and capital.
When you reach the first target, save some money and then change your stop-loss order to an entry order.
For inquiries, please leave a comment.
Thank you.

#SOL/USDTSOLANA →
The price is moving within a descending channel on the 1-hour frame and is expected to break and continue upward.
We have a trend to stabilize above the 100 moving average once again.
We have a downtrend on the RSI indicator that supports the upward move with a breakout.
We have a support area at the lower limit of the channel at 142, acting as strong support from which the price can rebound.
Entry price: 144
First target: 146
Second target: 149
Third target: 152
For risk management, please don't forget stop loss and capital management
When we reach the first target, save some profit and then change the stop to entry
Comment if you have any questions
Thank You

Is SOLANA SOL Ready for a Breakout? Bounce from Falling Channel?
🔍 Chart Pattern and Price Structure Analysis
This chart illustrates a well-formed descending channel (parallel falling channel) that has been developing since mid-January 2025. Currently, the price is approaching the upper boundary of this channel — a key decision area.
🟡 Technical Pattern
Descending Channel: This pattern is characterized by a series of lower highs and lower lows, representing a medium-term bearish trend.
The price is now testing the upper resistance of this channel, a crucial point that could either trigger a breakout or result in another rejection.
📈 Bullish Scenario
If the price successfully breaks out above the upper trendline (around $152–$154), several resistance targets come into play:
1. $164.5 — A minor horizontal resistance and key psychological level.
2. $182.2 — A strong historical resistance zone.
3. $210–$217.8 — A previous consolidation/resistance zone.
4. $237.7, then $261–$280 — Key bullish targets if momentum sustains.
5. Ultimate target near $295.1–$295.7 if broader market sentiment remains strong.
📌 Bullish Confirmation:
Valid daily candle breakout above the channel.
Strong breakout volume.
Successful retest of the breakout area as new support.
📉 Bearish Scenario
If the price fails to break above the channel and gets rejected, we may see a continuation of the downtrend with potential moves to these support levels:
1. $140–$138 — Current minor support zone.
2. $128 — Recent consolidation support.
3. $115.5 — Major support from April.
4. $95.2 — The lowest support zone on the chart.
📌 Bearish Confirmation:
Strong rejection candle (e.g., bearish engulfing) from upper channel.
Weak breakout attempt with declining volume.
Break below the lower channel support or creation of a new lower low.
📊 Conclusion
The current setup is a classic descending channel, indicating a strong mid-term bearish structure.
Price is now at a make-or-break zone — a breakout could signal a trend reversal, while a rejection could extend the current downtrend.
Traders should wait for a confirmed breakout or clear rejection before entering a position.
#SOLUSDT #Solana #CryptoAnalysis #TechnicalAnalysis #DescendingChannel #BreakoutAlert #CryptoTrading #BullishScenario #BearishScenario #Altcoins #CryptoTA

sol updateentry price 169.14
stop loss update 169.14
take profit
160.1
145.1
131.5
result full target

#SOL/USDT#SOL
The price is moving within a descending channel on the 1-hour frame, adhering well to it, and is heading for a strong breakout and retest.
We are experiencing a rebound from the lower boundary of the descending channel. This support is at 149.
We are experiencing a downtrend on the RSI indicator, which is about to break and retest, supporting the upward trend.
We are heading for stability above the 100 moving average.
Entry price: 153
First target: 155
Second target: 159
Third target: 162

#SOL/USDT#SOL
The price is moving within a descending channel on the 1-hour frame, adhering well to it, and is heading for a strong breakout and retest.
We are experiencing a rebound from the lower boundary of the descending channel. This support is at 142.
We are experiencing a downtrend on the RSI indicator, which is about to break and retest, supporting the upward trend.
We are heading for stability above the 100 moving average.
Entry price: 144
First target: 149
Second target: 153
Third target: 157

#SOL/USDT#SOL
The price is moving within a descending channel on the 1-hour frame and is expected to break and continue upward.
We have a trend to stabilize above the 100 moving average once again.
We have a downtrend on the RSI indicator that supports the upward move by breaking it upward.
We have a support area at the lower limit of the channel at 148, acting as strong support from which the price can rebound.
Entry price: 153
First target: 156
Second target: 159
Third target: 162

sol updateentry price 169.14
stop loss update 169.14
take profit 160.1
145.1
131.5
result for now we hit 2 target and risk free

Solana >>> all trendlines are brokenHello guys!
As you can see, all of the trendline is broken, and after forming a double top in Solana, we can see a bearish trend is running!
I believe this downward movement will continue until the price touches the mentioned area!
The pointed area is the target level!
And the blue area has its own potential for getting long!

Watch out for Solana today.Hello friends
You can see that in the image we have done a complete and comprehensive analysis of Solana for you and identified points that are good supports and can be bought in the areas.
Given the deep correction we had, the market has fallen into fear and a good opportunity has been provided for buying.
The targets have also been identified.
Please observe capital management and avoid irrational risks.
*Trade safely with us*

#SOL/USDT#SOL
The price is moving within a descending channel on the 1-hour frame, adhering well to it, and is on its way to breaking it strongly upwards and retesting it.
We are seeing a bounce from the lower boundary of the descending channel, this support is at 150
We have a downtrend on the RSI indicator that is about to break and retest, which supports the upward trend.
We are looking for stability above the moving average of 100.
Entry price: 156
First target: 160
Second target: 167
Third target: 173

Double Top Alert: SOLUSDT Setup Screams ReversalYello Paradisers, will you act like a pro and prepare for the next clean short opportunity on #SOLUSDT, or will you fall for the same breakout trap again just before the market punishes greed?
💎#SOLUSDT is displaying a textbook double top formation just under a well-respected resistance zone. This kind of structure is no joke—it’s a consistent precursor to sharp downside when liquidity gets taken from retail longs who are too eager to buy high. The market rarely gives second chances. What you’re looking at now is one of them.
💎Price has printed a double top around the $185 to $188 region. That zone has repeatedly acted as a ceiling, and buyers have failed to maintain any strength above it. The lack of follow-through is a major sign of exhaustion, especially after the second tap failed to even test the previous high with conviction.
💎Instead of breaking out, SOLUSDT has rolled over and is now struggling under the $176.23 minor resistance. That weakness is already being confirmed on lower timeframes. As long as this area holds as resistance, there is no justification for any probable aggressive long setups. This is a market preparing to punish overleveraged traders.
💎There’s a clear invalidation for this setup, and it’s extremely important to stick to it. Any 4H candle closing above $190.18 would break this structure and force us to step back and reassess the setup. Until that happens, the current bearish thesis remains firmly in play.
💎The nearest support sits at $168.86 which has highest probability that price may visit there. This level may act as a brief pause, but if the selling intensifies, it will likely break. A confirmed move below that level opens the door toward the true target of this breakdown, which is the $153.95 major support zone. That’s where we’ll be watching for a real reaction.
💎The current structure is heavily skewed toward the downside. Bears are clearly in control below $176.23, and the market has shown no signs of reclaiming key levels that would shift that control back to the bulls. Any bounce should be treated as corrective unless proven otherwise by a structural shift.
Strive for consistency, not quick profits, Paradisers. Treat the market as a businessman, not as a gambler. If you master that mindset, you’ll already be far ahead of the crowd.
MyCryptoParadise
iFeel the success🌴

#SOL/USDT#SOL
The price is moving within a descending channel on the 1-hour frame and is expected to break and continue upward.
We have a trend to stabilize above the 100 moving average once again.
We have a downtrend on the RSI indicator that supports the upward move with a breakout.
We have a support area at the lower limit of the channel at 166, which acts as strong support from which the price can rebound.
Entry price: 172.
First target: 176.
Second target: 181.
Third target: 186.

#SOL/USDT#SOL
The price is moving within a descending channel on the 1-hour frame, adhering well to it, and is heading for a strong breakout and retest.
We are seeing a rebound from the lower boundary of the descending channel, which is support at 158.
We have a downtrend on the RSI indicator that is about to be broken and retested, supporting the upward trend.
We are looking for stability above the 100 moving average.
Entry price: 161.70
First target: 164
Second target: 168
Third target: 173


#SOL/USDT#SOL
The price is moving within a descending channel on the 1-hour frame, adhering well to it, and is on its way to breaking it strongly upwards and retesting it.
We are seeing a bounce from the lower boundary of the descending channel, this support is at 172.
We have a downtrend on the RSI indicator that is about to break and retest, which supports the upward trend.
We are looking for stability above the 100 moving average.
Entry price: 173
First target: 176
Second target: 180
Third target: 183

#SOL/USDT#SOL
The price is moving within a descending channel on the 1-hour frame, adhering well to it, and is on its way to breaking it strongly upwards and retesting it.
We are seeing a bounce from the lower boundary of the descending channel, this support is at 144.
We have a downtrend on the RSI indicator that is about to break and retest, which supports the upward trend.
We are looking for stability above the 100 moving average.
Entry price: 149
First target: 153
Second target: 156
Third target: 161

SOLUSDT SHORT IDEAUnder current market conditions, the area near 148.3 has been identified as a critical resistance zone, where the AI model detects a high-probability trade setup.
From a technical perspective, a clear directional bias based on recent price action patterns. Suppose the market demonstrates increased volume and price stability above key moving averages in the 148.3 area. In that case, traders are advised to monitor for trend-continuation entry opportunities in alignment with the prevailing momentum.
Profit targets are defined at 145.0 and 140.2, corresponding to logical technical support zones. These levels are designed for staged profit-taking across different trade management styles. Stop-loss should be strictly enforced at the designated level; once breached, the strategy is considered invalidated in order to limit potential downside.
