Technical Analysis: SOL/USDT (1D Chart)
Analysis Overview:
The chart depicts a potential bullish scenario for SOL/USDT, highlighting key entry zones and price action structure. Here's the breakdown:
Entry Zones:
Entry 1 (Immediate Support Zone):
Zone: Around the $210-$220 range.
This area marks the first potential buying opportunity, where price has shown prior support and could bounce if retested.
Ideal for aggressive buyers seeking to capitalize on the current bullish momentum.
Entry 2 (Deeper Retracement Zone):
Zone: Around the $180-$190 range.
This zone represents a stronger support level, aligning with historical price action. It's suitable for conservative buyers awaiting deeper corrections.
Price Action and Path Projection:
A bullish continuation is expected if the price holds above the support zones.
Scenario 1: Price could bounce from Entry 1, consolidate slightly, and break higher, targeting levels beyond $280.
Scenario 2: If Entry 1 fails, the price might retest Entry 2 before forming a double-bottom pattern and resuming its upward trend.
Key Technical Indicators:
Moving Average (MA): The price is trading above a key moving average, reinforcing the bullish bias.
Buy and Sell Signals: Recent buy signals indicate renewed bullish pressure.
Volume: (Add volume analysis if relevant, e.g., increasing volume during breakouts.)
Targets:
Target 1: $300 – Based on the previous high.
Target 2: $350 – Major resistance from historical levels.
Risk Management:
Place stop-losses just below the support zones:
Entry 1: Stop-loss at $200.
Entry 2: Stop-loss at $170.
Use position sizing appropriate to your risk tolerance.
Solusdtsignal
SOL/USDT 1H: Bulls Preparing for a Push to $270 SOL/USDT 1H Chart Analysis (SMC Principles)
🚀 Follow me on Tradingview if you respect our charts 📈
Market Structure:
Consolidation phase after rejection from $270 resistance.
Signs of accumulation at $245-$250 zone.
Key Observations:
RSI: Hidden bullish divergence forming, signaling potential upside.
Volume Profile: Indicates institutional accumulation.
FVG: Identified between $260-$265.
Liquidity Pool: Strong support below $240.
Trade Setup (Confidence Level: 7.5/10):
Entry Zone: $248-$250
Targets:
T1: $260 (FVG fill)
T2: $270 (previous resistance)
Stop Loss: Below $240 (structural support)
Risk Score: 6/10 (moderate).
Market Maker (MM) Analysis:
Smart money accumulating while retail sentiment remains cautious.
Possible liquidity sweep below $245 before upward move.
Break above $255 needed to confirm bullish continuation.
Recommendation:
Enter long positions in the $248-$250 zone with tight risk management.
Monitor volume and price action for confirmation of continuation above $255.
Confidence Level: 7.5/10 for a cautious bullish setup.
🚀 Follow me on Tradingview if you respect our charts 📈
Solana's Pump fun Deposits $28M SOL Amid Class Action LawsuitSolana ( CRYPTOCAP:SOL ), a high-performance blockchain network, has found itself in the spotlight once again, thanks to its association with Pump.fun—a Solana-based meme coin launchpad. Pump.fun’s recent activities, including significant deposits and a federal class action lawsuit, have spurred discussions around Solana’s price movements and market outlook. This article explores the technical and fundamental aspects of Solana’s current state.
Pump.fun’s Controversial Operations and Solana Deposits
Pump.fun, a leading player in the Solana ecosystem, has facilitated the creation of over six million tokens. According to Lookonchain, Pump.fun recently deposited 116,055 SOL (valued at $28 million) to Kraken, bringing its total deposits to 1,901,332 SOL, worth approximately $386.8 million. These transactions, coupled with $41.64 million in USDC generated from SOL sales, highlight Pump.fun’s substantial influence within the Solana network.
However, Pump.fun is under fire due to a class action lawsuit filed by Burwick Law and Wolf Popper LLP. The lawsuit alleges that Pump.fun engaged in exploitative practices, including issuing volatile and unregistered tokens, and promoting hate speech on its platform. The legal scrutiny intensifies as reports reveal that Pump.fun earned $572 million in fees, yet only 0.41% of its wallets achieved profits exceeding $10,000. Critics argue that the platform disproportionately benefits a select few, while the majority of users incur losses.
Technical Analysis of Solana’s Price Movement
Despite the controversy surrounding Pump.fun, Solana’s price has demonstrated resilience. Currently trading within the $230–$250 range, Solana’s price action is consolidating after reaching a high of $290. This consolidation phase is pivotal, as it sets the stage for the next significant price movement.
Key Technical Indicators:
1. Support and Resistance Levels:
- Immediate support: $216
- Immediate resistance: $260 and $290
- A breakout above $290 could propel Solana’s price to $360, aligning with bullish projections.
2. Relative Strength Index (RSI):
- RSI stands at 58, indicating moderate bullish momentum.
- The RSI suggests that Solana is not overbought, leaving room for further price appreciation.
3. Chaikin Money Flow (CMF):
- CMF value: +0.05, reflecting sustained capital inflows.
- Positive CMF values indicate strong investor confidence and potential for further gains.
Fundamental Outlook for Solana
Solana’s ecosystem remains robust despite the challenges posed by Pump.fun’s legal issues. The blockchain’s high throughput and low transaction costs continue to attract developers and users alike. Pump.fun’s significant transactions underscore Solana’s role as a preferred network for large-scale operations, albeit with controversies.
The ongoing lawsuit against Pump.fun could have mixed implications for Solana. On one hand, increased scrutiny may tarnish its reputation temporarily. On the other hand, resolving these issues could lead to greater transparency and trust in the network.
Market Sentiment and Price Outlook
Solana’s current consolidation suggests that the market is waiting for a catalyst to determine the next trend. The following scenarios could influence its price trajectory:
1. Bullish Scenario:
- A breakout above $290 could lead to a rally toward $360, driven by continued capital inflows and bullish sentiment.
- Positive developments in the Pump.fun lawsuit could restore investor confidence.
2. Bearish Scenario:
- Failure to hold the $216 support level could result in a retracement to lower levels.
- Prolonged legal issues or adverse outcomes for Pump.fun could dampen market sentiment.
Conclusion
Solana’s association with Pump.fun has placed it under the microscope, but the blockchain’s technical and fundamental strengths remain intact. While the legal challenges surrounding Pump.fun add an element of uncertainty, Solana’s price action indicates potential for a breakout, provided it overcomes key resistance levels.
Investors should closely monitor developments in the Pump.fun lawsuit and Solana’s price movements. With its RSI signaling moderate bullish momentum and CMF values pointing to sustained capital inflows, Solana is well-positioned for a potential rally. However, caution is warranted, as external factors could influence its trajectory in the short term.
Will Solana (SOL) Reach $1000? Positive Momentum Beyonds Memes
Solana (SOL), known for its high transaction speeds and low fees, has experienced periods of significant growth and equally dramatic pullbacks. The question on many investors' minds is whether SOL can reach the ambitious target of $1000. While key technical indicators point to positive momentum, the network faces challenges that extend beyond the fleeting influence of meme hype. This article examines the factors influencing Solana's price trajectory, weighing its potential for significant growth against the hurdles it must overcome.
Technical Indicators Paint a Bullish Picture (For Now)
Currently, several technical indicators suggest positive momentum for SOL. The price consistently holding above both the 50 and 200-day moving averages is a bullish sign. These moving averages are widely used by traders to identify trends, with the 50-day MA representing short-term momentum and the 200-day MA indicating the long-term trend. When the price is above both, it suggests a healthy uptrend.
Other technical indicators, such as Relative Strength Index (RSI) and Moving Average Convergence Divergence (MACD), can provide further insights. If the RSI is trending upwards without reaching overbought levels (typically above 70), it suggests growing buying pressure. A bullish crossover on the MACD (where the MACD line crosses above the signal line) can also signal a potential price increase.
However, relying solely on technical analysis can be misleading. While these indicators can identify trends, they don't account for fundamental factors like network performance, adoption, and competition.
Beyond Meme Hype: Fundamental Strength and Adoption
Solana's initial surge in popularity was partly fueled by meme coins and NFT projects built on its blockchain. While this generated significant interest and trading volume, it also created a perception of Solana being driven by hype rather than fundamental value. For SOL to reach $1000, it needs to demonstrate sustainable growth based on real-world adoption and utility.
Several factors contribute to Solana's fundamental strength:
• High Transaction Speed and Low Fees: Solana's architecture allows for significantly faster transaction processing and lower fees compared to networks like Ethereum. This makes it attractive for decentralized applications (dApps) requiring high throughput, such as decentralized finance (DeFi) platforms and NFT marketplaces.
• Growing Ecosystem: Despite facing challenges, Solana's ecosystem continues to grow, with new projects and developers building on the network. This expansion is crucial for attracting users and driving demand for SOL.
• Technological Advancements: Ongoing development and upgrades to the Solana network aim to improve its stability, scalability, and security. These advancements are essential for addressing past network outages and building trust among users.
Challenges and Roadblocks
Despite the positive momentum and fundamental strengths, Solana faces significant challenges:
• Network Stability: Solana has experienced several network outages in the past, raising concerns about its reliability. Addressing these issues and ensuring network stability is crucial for attracting institutional investors and mainstream adoption.
• Competition: Solana faces intense competition from other layer-1 blockchains like Ethereum, Cardano, and Avalanche. These networks are also developing and improving their technology, making it challenging for Solana to maintain its competitive edge.
• Negative Perception: The past network outages and association with meme coin hype have created a negative perception of Solana in some parts of the crypto community. Overcoming this perception and building trust will be a key challenge.
• Coinbase Withdrawal Delays: The recent criticism of Coinbase for delays in processing Solana withdrawals is a concerning development. Such issues can erode user confidence and negatively impact the network's reputation. While Coinbase has its own operational issues and this may not be solely a Solana problem, it still reflects poorly on the overall user experience.
The $1000 Target: A Realistic or Distant Dream?
Reaching $1000 would require a significant increase in Solana's market capitalization. This would necessitate widespread adoption of the network, sustained growth in its ecosystem, and overcoming the existing challenges.
While the current technical indicators are positive, they are not a guarantee of future price appreciation. The success of Solana depends on its ability to:
• Maintain Network Stability: Addressing network outages and ensuring consistent uptime is paramount.
• Attract Developers and Users: Growing the ecosystem with innovative dApps and attracting a larger user base is crucial.
• Overcome Negative Perception: Building trust and addressing concerns about network reliability is essential for mainstream adoption.
• Compete Effectively: Staying ahead of the competition in the rapidly evolving blockchain landscape is vital.
Conclusion
Solana has the potential for significant growth, driven by its technological advantages and growing ecosystem. However, reaching the ambitious target of $1000 is a challenging task. While positive momentum is evident in current technical indicators, the network faces significant hurdles, including network stability issues, competition, and negative perception. Overcoming these challenges and demonstrating sustainable growth based on real-world utility will be crucial for Solana to achieve its full potential. The recent Coinbase withdrawal delays highlight the importance of smooth user experience and operational efficiency for any blockchain network aiming for mass adoption. Investors should carefully weigh these factors before making investment decisions.
Why Altcoins Like $SOL Are Worth Watching
“Master, aren’t you all about Bitcoin? Why talk about altcoins now?”
In the final year of a bull market , altcoins often deliver incredible gains . Let me explain:
📈 The Case for Solana ( CRYPTOCAP:SOL )
About a month ago, when CRYPTOCAP:SOL was trading around $220, I shared with my private community that I was scaling into Solana.
Since then:
- The ecosystem activity has surged.
- AI agents are launching on Solana.
- Solana is emerging as the go-to platform for trading, creation, and development.
Momentum is strong, and the signals are clear.
🤔 Should You Buy All the CRYPTOCAP:SOL You Can?
If you’ve been following my updates, you likely have access to my Unified Indicator.
By applying it to the CRYPTOCAP:SOL chart, you’d have caught the **best BUY signal possible**—better than even my manual recommendation!
🔍 My CRYPTOCAP:SOL Trade Example
I started buying CRYPTOCAP:SOL at **$219**, before my indicator flashed a BUY signal. CRYPTOCAP:SOL dropped another **20%**, but when the indicator confirmed the BUY, CRYPTOCAP:SOL surged by **55%**.
💡 The Key to Success
This isn’t magic—it’s about removing emotions from trading and sticking to a proven strategy.
The lesson? Follow your plan, trust the signals, and let the market come to you.
This is not financial advice. Always do your own research! 📖
SOLUSDT Ready to Soar? Wave 5 Points to +30 % Upside PotentialHey Realistic Traders, Will BINANCE:SOLUSDT Create New All-Time High? Let's dive into the analysis...
Analyzing Solana's (SOLUSDT) price movements using Elliott Wave Theory indicates the potential for a significant upside in Wave 5. Wave 3 previously extended beyond the 1.618 Fibonacci extension, classifying it as an extended wave. Following this, Wave 4 retraced approximately to the 0.618 Fibonacci level, forming a falling wedge pattern, which is a bullish signal.
The breakout from this falling wedge on the 4-hour chart, combined with a bullish divergence in the MACD indicator, suggests the possible initiation of Wave 5. However, as Wave 5 is expected to be a standard wave rather than an extended one, its movement may be relatively limited compared to the high of Wave 3.
Based on these technical signals, the price is projected to rise toward the $302.46 target , provided it holds above the critical stop loss level of $175.28.
Support the channel by engaging with the content, using the rocket button, and sharing your opinions in the comments below.
"Disclaimer: "Please note that this analysis is solely for educational purposes and should not be considered a recommendation to take a long or short position on Solana".
The Rise of Solana’s ValueThe cryptocurrency market is no stranger to volatility, but the recent surge in Solana’s value underscores the growing influence of meme coins on this burgeoning financial ecosystem. Solana’s SOL token experienced a remarkable 16% increase in value following the launch of a new meme coin with a presidential theme, connected to former President Donald Trump. This event highlights the unpredictable yet powerful dynamics that meme coins can bring to the market.
Solana, a blockchain platform known for its high speed and low transaction costs, has steadily positioned itself as a major player in the cryptocurrency space. However, its recent surge can be attributed to a highly specific and unconventional catalyst—a meme coin. These digital tokens, often inspired by internet jokes or cultural phenomena, have gained immense popularity for their potential to generate quick returns. The latest entrant in the meme coin space, featuring a connection to Donald Trump, exemplifies this trend.
The meme coin’s launch on the Solana blockchain drew significant attention from both the cryptocurrency community and mainstream media. The association with the former president added a layer of intrigue and controversy, fueling investor interest. As a result, trading activity on the Solana network spiked, leading to a notable rise in the value of its native token, SOL.
The Influence of Meme Coins
Meme coins have become a cultural and financial phenomenon in the cryptocurrency world. Unlike traditional cryptocurrencies like Bitcoin or Ethereum, which are often seen as digital assets with long-term utility or store-of-value potential, meme coins derive their appeal from their novelty and viral marketing. These tokens can create a sense of community and excitement, driving massive investments in a short period.
The recent case of the Trump-themed meme coin illustrates how these tokens can influence the broader market. By leveraging the notoriety and global recognition of a public figure, the meme coin attracted a flood of attention. This, in turn, elevated the Solana blockchain’s profile, as it was the chosen platform for the coin’s launch.
Why Solana?
Solana’s suitability for hosting meme coins lies in its technological advantages. With a transaction throughput of up to 65,000 transactions per second and average fees as low as $0.00025, Solana offers an efficient and cost-effective environment for developers. These attributes make it an attractive choice for launching new projects, particularly those that rely on high trading volumes and rapid adoption, such as meme coins.
The Trump-themed coin’s choice of Solana over other blockchain networks underscores the platform’s growing reputation. By facilitating the launch of such a high-profile token, Solana has positioned itself as a viable competitor to Ethereum, which has traditionally dominated the decentralized finance (DeFi) and non-fungible token (NFT) spaces.
The Trump Factor
The association with former President Donald Trump played a pivotal role in amplifying the meme coin’s impact. Trump remains a polarizing figure with a massive global following, making any project linked to his name inherently newsworthy. This connection likely drew a mix of supporters, detractors, and opportunistic investors, all eager to capitalize on the coin’s potential for rapid gains.
While Trump himself has not publicly endorsed the coin, the mere implication of a link was enough to generate buzz. In the world of cryptocurrencies, perception often matters as much as reality. The hype surrounding the coin translated into increased activity on the Solana network, benefiting the platform’s native token.
Implications for the Cryptocurrency Market
The surge in Solana’s value following the meme coin launch demonstrates the outsized influence that these tokens can wield. While some critics dismiss meme coins as speculative or frivolous, their ability to attract capital and attention is undeniable. For blockchain platforms like Solana, hosting popular meme coins can serve as a gateway to greater adoption and legitimacy.
However, the phenomenon also raises questions about market stability and sustainability. Meme coins are notorious for their volatility, and their popularity can be fleeting. Investors and blockchain platforms alike must navigate the risks associated with these trends. While the short-term gains can be substantial, they often come with heightened uncertainty.
Looking Ahead
The success of the Trump-themed meme coin on Solana could pave the way for similar projects in the future. As more developers and investors recognize the potential of meme coins to drive engagement and profitability, platforms like Solana may increasingly position themselves as hubs for these ventures. This could lead to further innovation within the meme coin space, as well as increased competition among blockchain networks vying for market share.
For Solana, the recent surge in value is a testament to its resilience and adaptability. By capturing the zeitgeist through a culturally resonant meme coin, the platform has demonstrated its ability to capitalize on emerging trends. Whether this momentum can be sustained remains to be seen, but the event has undoubtedly reinforced Solana’s standing in the cryptocurrency market.
Conclusion
The launch of a Trump-themed meme coin on the Solana blockchain has not only boosted the value of SOL but also highlighted the transformative potential of meme coins within the cryptocurrency ecosystem. These tokens, often dismissed as novelties, have proven capable of driving significant market activity and elevating the profiles of blockchain platforms.
As the cryptocurrency market continues to evolve, the influence of meme coins is likely to persist. For investors and developers, the key will be to balance the excitement of these trends with a clear-eyed assessment of their risks and rewards. Meanwhile, platforms like Solana have an opportunity to harness the power of meme coins to expand their reach and solidify their positions in this dynamic and unpredictable industry.
SOLUSDT Breaking Barriers on the Path to NEW ALL TIME HIGH!!TRADENATION:SOLANA ( BINANCE:SOLUSDT ) is making waves in the crypto market, breaking past all key resistance levels with strong volumes, signaling a potential long-term bullish trend. The recent price action suggests growing confidence among traders and investors, fueled by Solana’s ecosystem developments and rising adoption. This breakout is catching the attention of the market as it mirrors similar patterns seen in XRP, which recently reached a new all-time high.
With the current momentum, CRYPTOCAP:SOL has the potential to chart new heights, and the hype surrounding it could push the price towards $600 in the long term. Key short-term resistance levels have already been tested, and the continued surge in volume could pave the way for a sustained rally.
This could be the perfect opportunity for traders and investors looking to capitalize on Solana’s upward trajectory. Is this the beginning of SOL’s journey to new all-time highs? Stay tuned as the market unfolds.
BINANCE:SOLUSDT Currently trading at $220
Buy level: Above $210
Stop loss: Below $154
Target : $600
Max Leverage 3x
Always keep Stop loss
Follow Our Tradingview Account for More Technical Analysis Updates, | Like, Share and Comment Your thoughts
Solana Double Bottom: Looking For A Break Of The Range High!Solana has formed a double bottom with a dip below, suggesting a potential bullish move could be on the horizon. This pattern indicates a possible trend reversal. I'm watching for a break above the range high, followed by a retrace to retest the range high on the lower timeframe, with a potential continuation to the upside. Monitor the Fibonacci pullback to the 50-61.8% level on the previous four-hour swing for a possible bullish entry. This is not financial advice.
SOLUSDT: Tough Spot, But Opportunity Awaits!SOLUSDT: Tough Spot, But Opportunity Awaits! 🧐
Right now, the market conditions make it tricky:
Too low to short, yet too high to long.
Solution: If the price reaches the blue box, it’s a strong zone to consider taking a long position.
Always confirm with your favorite tools like CDV, volume profiles, and LTF structure breaks before diving in.
The patient win the race! Boost, comment, and follow for elite-level strategies! 🚀
Let me tell you, this is something special. These insights, these setups—they’re not just good; they’re game-changers. I've spent years refining my approach, and the results speak for themselves. People are always asking, "How do you spot these opportunities?" It’s simple: experience, clarity, and a focus on high-probability moves.
Want to know how I use heatmaps, cumulative volume delta, and volume footprint techniques to find demand zones with precision? I’m happy to share—just send me a message. No cost, no catch. I believe in helping people make smarter decisions.
Here are some of my recent analyses. Each one highlights key opportunities:
🚀 GMTUSDT: %35 FAST REJECTION FROM THE RED BOX
🎯 ZENUSDT.P: Patience & Profitability | %230 Reaction from the Sniper Entry
🐶 DOGEUSDT.P: Next Move
🎨 RENDERUSDT.P: Opportunity of the Month
💎 ETHUSDT.P: Where to Retrace
🟢 BNBUSDT.P: Potential Surge
📊 BTC Dominance: Reaction Zone
🌊 WAVESUSDT.P: Demand Zone Potential
🟣 UNIUSDT.P: Long-Term Trade
🔵 XRPUSDT.P: Entry Zones
🔗 LINKUSDT.P: Follow The River
📈 BTCUSDT.P: Two Key Demand Zones
🟩 POLUSDT: Bullish Momentum
🌟 PENDLEUSDT.P: Where Opportunity Meets Precision
🔥 BTCUSDT.P: Liquidation of Highly Leveraged Longs
🌊 SOLUSDT.P: SOL's Dip - Your Opportunity
🐸 1000PEPEUSDT.P: Prime Bounce Zone Unlocked
🚀 ETHUSDT.P: Set to Explode - Don't Miss This Game Changer
🤖 IQUSDT: Smart Plan
⚡️ PONDUSDT: A Trade Not Taken Is Better Than a Losing One
💼 STMXUSDT: 2 Buying Areas
🐢 TURBOUSDT: Buy Zones and Buyer Presence
🌍 ICPUSDT.P: Massive Upside Potential | Check the Trade Update For Seeing Results
🟠 IDEXUSDT: Spot Buy Area | %26 Profit if You Trade with MSB
📌 USUALUSDT: Buyers Are Active + %70 Profit in Total
🌟 FORTHUSDT: Sniper Entry +%26 Reaction
🐳 QKCUSDT: Sniper Entry +%57 Reaction
📊 BTC.D: Retest of Key Area Highly Likely
This list? It’s just a small piece of what I’ve been working on. There’s so much more. Go check my profile, see the results for yourself. My goal is simple: provide value and help you win. If you’ve got questions, I’ve got answers. Let’s get to work!
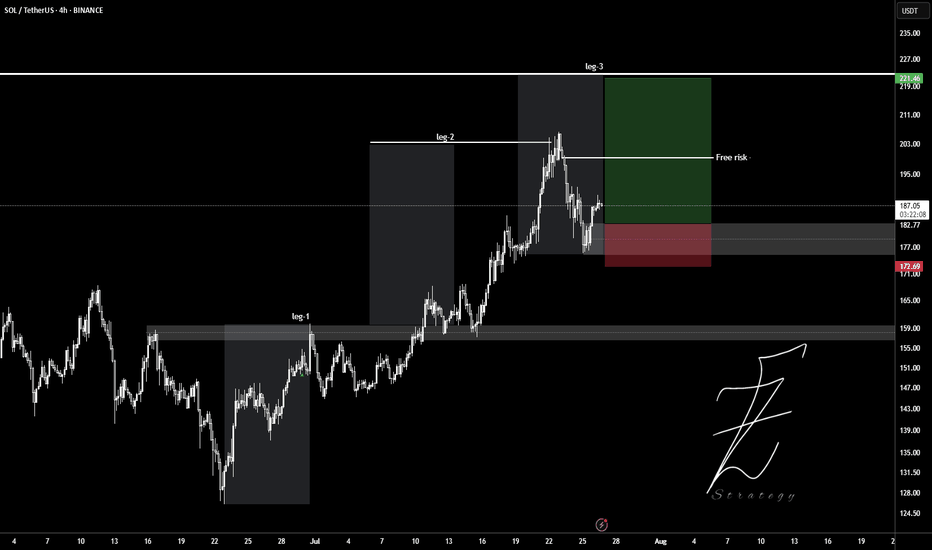
SOL/USDT Critical Support Zone in Play Is a Bounce Imminent?SOL/USDT Analysis
Price is nearing a key support zone around $185 - $175, which has historically acted as a strong demand area.
It is crucial to wait for the price to reach this support level and observe for bullish confirmation (e.g., a bullish candlestick pattern or reversal signals).
If the price holds this level and bounces, we can expect a significant recovery toward the **$210 - $220** range.
A break below $175 would invalidate this setup and could lead to further downside.
Strategy
1. Wait for a clear bounce off the support zone before entering a long position.
2. Set initial targets at $210 and $220, with stop loss below $175 for risk management.
Keep this chart on your watchlist and monitor price action near support!
Solana’s Big Moment: Will the Ascending Triangle Ignite a Rally?Yello, Paradisers! #Solana is gearing up for action as it charges inside an ascending triangle pattern, inching closer to the critical neckline resistance. If bulls can deliver a convincing breakout here, a trending move could be on the cards, setting the stage for a significant rally.
💎For #SOLUSDT the first test lies at the $197–$198.50 range, a moderate resistance zone that has effectively capped its price since December 19th. A breakout above this level, supported by strong volumes, could signal the start of a trending move, initially pushing the price toward the $210–$212 zone, where some profit-taking is likely to occur.
💎If bullish momentum remains strong beyond this point, Solana could set its sights on the next major resistance at $220–$225.50. This key level has the potential to define the next phase of its upward movement and will be critical for assessing whether the bulls can sustain the rally.
💎On the downside, Solana is supported by the ascending trendline in the $188–$186 range, with additional horizontal support at $186–$183.80. As long as these levels hold, the bulls remain in a strong position to keep the momentum alive.
Paradisers, stay sharp—Solana is at a critical turning point, and the next few moves could be decisive!
MyCryptoParadise
iFeel the success🌴
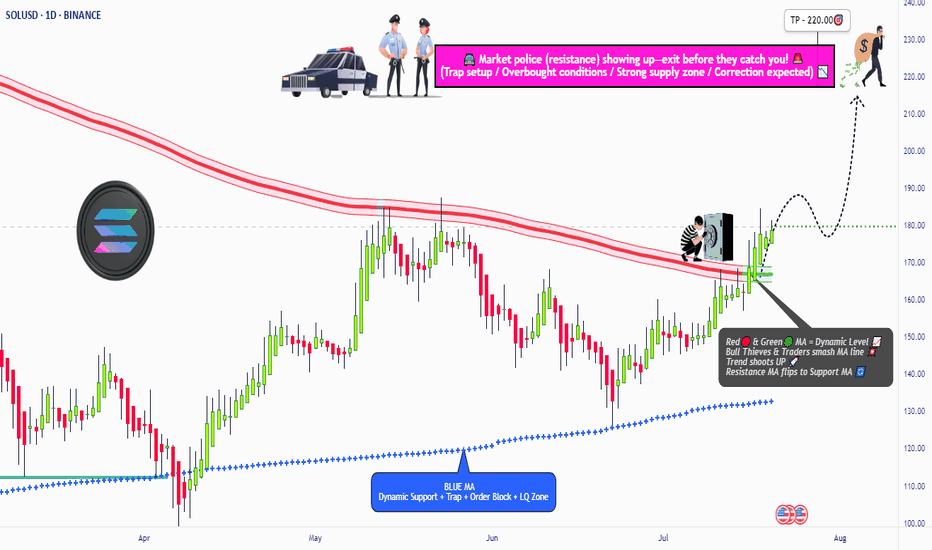
SOL/USD "Solana vs USD" Crypto Market Bullish Heist Plan🌟Hi! Hola! Ola! Bonjour! Hallo!🌟
Dear Money Makers & Robbers, 🤑 💰
Based on 🔥Thief Trading style technical and fundamental analysis🔥, here is our master plan to heist the SOL/USD "Solana vs USD" Crypto market. Please adhere to the strategy I've outlined in the chart, which emphasizes long entry. Our aim is the high-risk Red Zone. Risky level, overbought market, consolidation, trend reversal, trap at the level where traders and bearish robbers are stronger. Be wealthy and safe trade.💪🏆🎉
Entry 📈 : You can enter a Bull trade at anypoint,
however I advise placing Buy limit orders within a 15 or 30 minute timeframe. Entry from the most recent or closest low or high level should be in retest.
Stop Loss 🛑: Using the 4H period, the recent / nearest low or high level.
Goal 🎯: 250.00
Scalpers, take note 👀 : only scalp on the Long side. If you have a lot of money, you can go straight away; if not, you can join swing traders and carry out the robbery plan. Use trailing SL to safeguard your money 💰.
Warning⚠️ : Our heist strategy is incompatible with Fundamental Analysis news 📰 🗞️. We'll wreck our plan by smashing the Stop Loss 🚫🚏. Avoid entering the market right after the news release.
Fundamental Outlook 📰🗞️
Based on the fundamental analysis, I would conclude that the SOL/USD (Solana/US Dollar) pair is: Bullish
Reasons:
Growing adoption and usage: Solana's blockchain platform is gaining traction, with an increasing number of projects and applications being built on top of it.
Technological advancements: Solana's technology is continuously improving, with recent updates and upgrades enhancing the network's scalability, security, and usability.
Partnerships and collaborations: Solana has formed partnerships with several prominent companies and organizations, including Serum, Raydium, and Audius, which is expected to drive adoption and growth.
Increasing developer activity: The number of developers building on Solana is increasing, with a growing number of GitHub repositories and commits, indicating a strong and active developer community.
Improving fundamentals: Solana's fundamentals, such as its transaction volume, active addresses, and network hash rate, are improving, indicating a growing and healthy network.
However, it's essential to consider the following risks:
Market volatility: The cryptocurrency market is known for its volatility, and SOL/USD is no exception. Price fluctuations can be significant and unpredictable.
Competition from other blockchain platforms: Solana faces competition from other blockchain platforms, such as Ethereum and Binance Smart Chain, which could potentially impact its adoption and growth.
Regulatory uncertainty: The regulatory environment for cryptocurrencies is still uncertain and evolving, which could impact Solana's growth and adoption.
Bullish Scenario:
Growing adoption and usage, technological advancements, and partnerships drive up demand and price
Increasing developer activity and improving fundamentals support the bullish case
Key Fundamental Indicators:
Solana's transaction volume: 100,000 transactions per day
Solana's active addresses: 10,000 active addresses
Solana's network hash rate: 100 GH/s
Solana's GitHub repositories: 100 repositories
Solana's GitHub commits: 1,000 commits
Market Sentiment:
Bullish sentiment: 80%
Bearish sentiment: 20%
Neutral sentiment: 0%
Please note that this is a general analysis and not personalized investment advice. It's essential to consider your own risk tolerance and market analysis before making any investment decisions.
Take advantage of the target and get away 🎯 Swing Traders Please reserve the half amount of money and watch for the next dynamic level or order block breakout. Once it is resolved, we can go on to the next new target in our heist plan.
Keep in mind that these factors can change rapidly, and it's essential to stay up-to-date with market developments and adjust your analysis accordingly.
💖Supporting our robbery plan will enable us to effortlessly make and steal money 💰💵 Tell your friends, Colleagues and family to follow, like, and share. Boost the strength of our robbery team. Every day in this market make money with ease by using the Thief Trading Style.🏆💪🤝❤️🎉🚀
I'll see you soon with another heist plan, so stay tuned 🫂
SolAna "🌟 Welcome to Golden Candle! 🌟
We're a team of 📈 passionate traders 📉 who love sharing our 🔍 technical analysis insights 🔎 with the TradingView community. 🌎
Our goal is to provide 💡 valuable perspectives 💡 on market trends and patterns, but 🚫 please note that our analyses are not intended as buy or sell recommendations. 🚫
Instead, they reflect our own 💭 personal attitudes and thoughts. 💭
Follow along and 📚 learn 📚 from our analyses! 📊💡"
Solana Nears $220, ETF Approval Hopes Spark Optimism
Solana (SOL), a prominent player in the blockchain arena, has been exhibiting a strong upward trajectory, nearing the $220 price mark. This surge in value is fueled by a renewed sense of optimism sweeping through the cryptocurrency market, largely driven by growing anticipation surrounding the potential approval of a spot Bitcoin Exchange Traded Fund (ETF) in the United States. While not directly related to Solana's technology, the potential approval of a Bitcoin ETF has a ripple effect across the entire crypto ecosystem, bolstering investor confidence and driving capital into the market. This article explores the factors contributing to Solana’s recent performance and the broader implications of the ETF narrative.
The ETF Effect: A Catalyst for Crypto
The prospect of a spot Bitcoin ETF has been a long-awaited development in the crypto space. Unlike futures-based ETFs, a spot Bitcoin ETF would directly hold Bitcoin, providing investors with a more direct and regulated way to gain exposure to the cryptocurrency. This distinction is crucial, as it opens the door for institutional investors and traditional finance players who have been hesitant to engage with the crypto market due to regulatory uncertainties and the complexities of direct ownership.
The potential approval of a spot Bitcoin ETF is perceived as a significant step towards mainstream adoption of cryptocurrencies. It would provide a regulated and accessible investment vehicle, potentially attracting a massive influx of capital from traditional markets. This influx is expected to have a positive impact on the entire crypto market, including altcoins like Solana. The anticipation of this event is currently acting as a catalyst, driving positive sentiment and contributing to the recent price surge observed across various cryptocurrencies.
Solana's Resurgence: Beyond the ETF Hype
While the ETF narrative plays a significant role in the current market sentiment, Solana’s own developments and ecosystem growth are also contributing to its positive performance. Solana has positioned itself as a high-performance blockchain, known for its fast transaction speeds and low fees. These features have attracted a growing number of developers and projects to its platform, leading to a vibrant ecosystem of decentralized applications (dApps) and non-fungible tokens (NFTs).
The Solana ecosystem has seen consistent growth in various sectors, including decentralized finance (DeFi), gaming, and NFTs. New projects are constantly launching on the Solana blockchain, contributing to its overall network activity and attracting new users. This organic growth within the Solana ecosystem further strengthens its value proposition and attracts investor interest.
Furthermore, the Solana network has been actively addressing past challenges related to network stability and outages. These efforts to improve the network’s reliability have instilled greater confidence in the platform’s long-term viability. Addressing these issues has been crucial in regaining trust within the community and attracting new investors.
Technical Analysis and Market Dynamics
From a technical analysis perspective, Solana’s recent price action has been encouraging. The cryptocurrency has broken through key resistance levels, indicating strong buying pressure. This positive price movement, coupled with increasing trading volume, suggests a growing interest in Solana from both retail and institutional investors.
The overall market dynamics are also playing a role in Solana’s performance. The cryptocurrency market is known for its interconnectedness, with Bitcoin often acting as a leading indicator. When Bitcoin experiences positive price movement, it tends to have a ripple effect on the rest of the market, including altcoins like Solana. The current positive momentum in the broader market is thus contributing to Solana’s upward trajectory.
Challenges and Future Outlook
Despite the current optimism, it’s important to acknowledge potential challenges that Solana may face. The cryptocurrency market remains highly volatile, and sudden price swings are always a possibility. Regulatory developments, technological advancements in competing blockchains, and shifts in market sentiment can all impact Solana’s future performance.
However, the long-term outlook for Solana remains positive. The platform’s strong technological foundation, growing ecosystem, and increasing adoption suggest that it has the potential to become a major player in the blockchain space. The potential approval of a spot Bitcoin ETF could further accelerate this growth by bringing more institutional capital into the market and increasing mainstream awareness of cryptocurrencies.
Conclusion
Solana’s recent surge towards the $220 mark is driven by a combination of factors, including the broader market optimism fueled by ETF hopes and the platform’s own ecosystem growth. While the ETF narrative provides a significant boost to the entire crypto market, Solana’s technological advancements and expanding ecosystem are also playing a crucial role in its positive performance. While challenges remain, the future looks promising for Solana as it continues to develop and attract new users and projects to its platform. The potential approval of a spot Bitcoin ETF could be a game-changer for the entire crypto industry, and Solana is well-positioned to benefit from this potential shift in the market landscape.
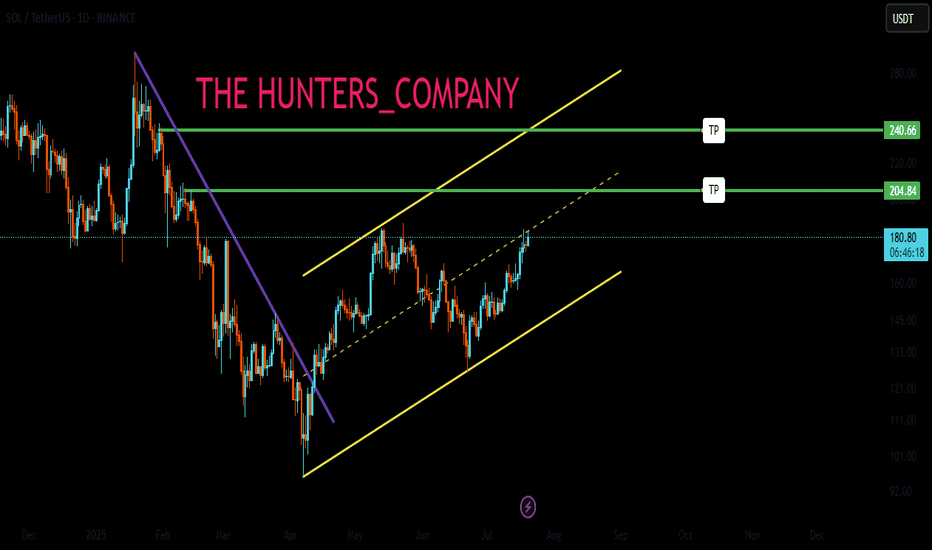
SOL/USDT Reclaims Key Support: Next Stop $230?SOL/USDT chart has recently broken out of a descending trendline, signaling a strong bullish reversal.
The price has reclaimed a key support zone around the $205-$210, which previously acted as a significant resistance level, further validating the breakout.
DYOR, NFA
Scalp in 4hKey Points:
Price Trend: SOL is currently in a downward trend but nearing a support zone, hinting at possible reversal or further decline based on breakout direction.
Strategy : Patience is key; traders should wait for clear breakout signals before entering trades, with attention to Fibonacci levels for setting targets or stops.
Risk Management : Important in volatile markets like crypto; setting stop-losses near key Fibonacci levels or recent lows/highs is advised.
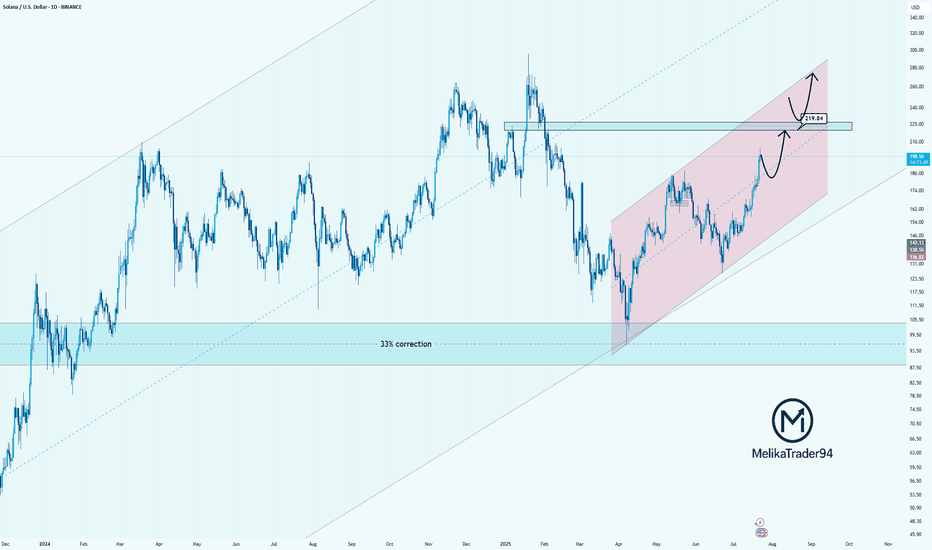
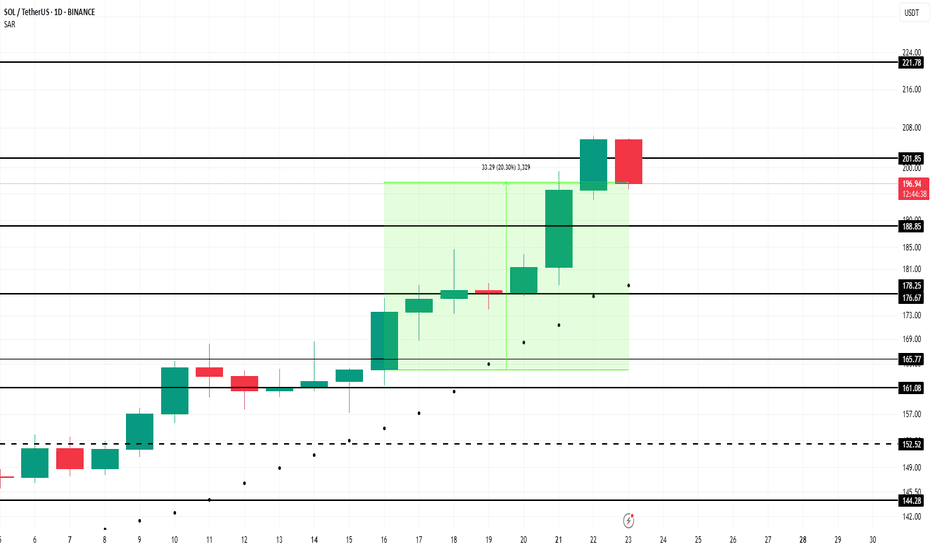
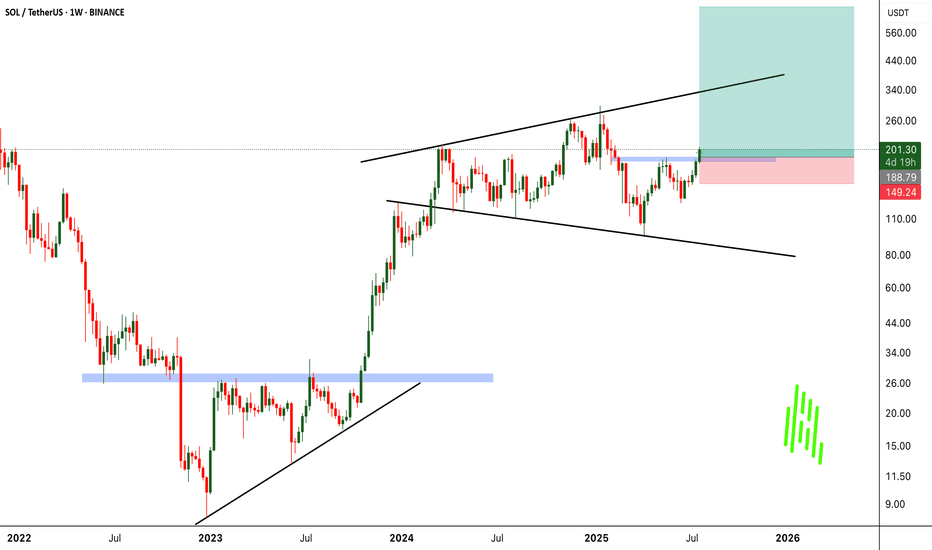
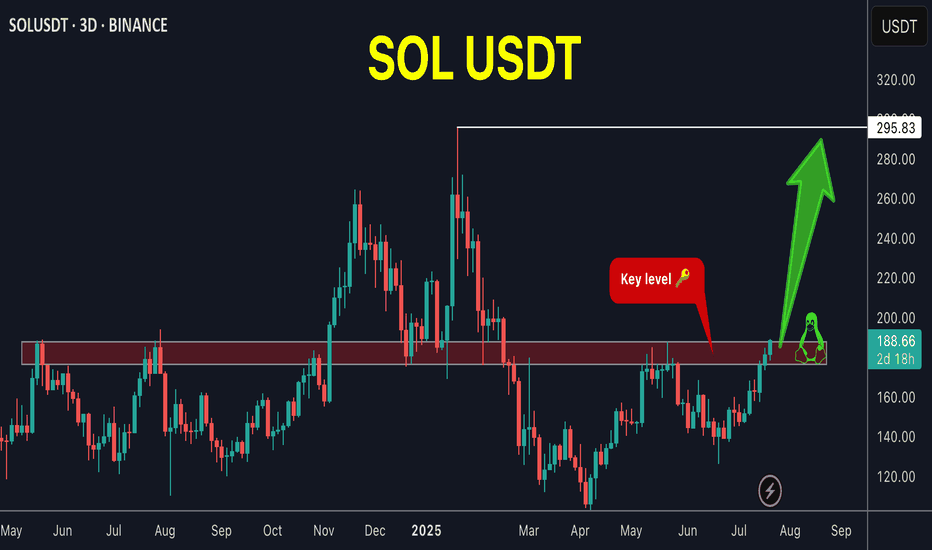
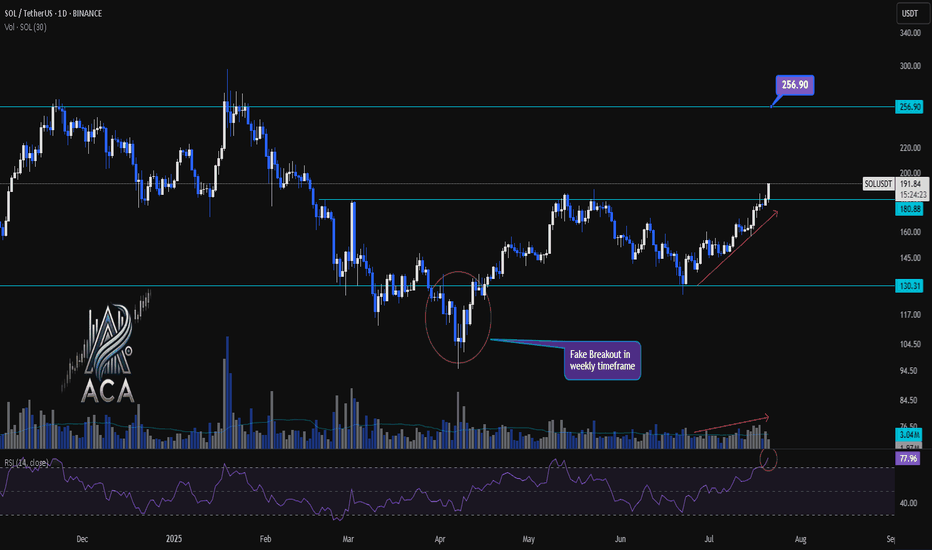
SOLUSDT on Fire: $200 Resistance Broken, Next Stop $300?BINANCE:SOLUSDT has shown remarkable strength, bouncing sharply from its major support level at $175. After a period of consolidation below the $200 resistance, it successfully broke out, signaling a strong bullish trend. This breakout paves the way for further upside, with the next major target set at $300, potentially reaching a new all-time high. Always manage your risk carefully by setting a stop loss below $175 to protect your capital. As momentum builds, BINANCE:SOLUSDT could deliver significant gains, but caution and proper risk management are crucial.
BINANCE:SOLUSDT Currently trading at $205
Buy level : Above $200
Target : $300
Stop loss : $175
Max leverage 3x
Always keep Stop loss
Follow Our Tradingview Account for More Technical Analysis Updates, | Like, Share and Comment Your thoughts
SOL 4H Chart Insights: Solana on the Verge of a Move!👀👉 On the 4-hour chart, Solana appears to be trading within a defined range for now, offering no immediate trade opportunities. However, a closer analysis reveals that a market structure breakout in either direction is imminent. When this occurs, it could present a promising opportunity to profit from the breakout. I’m monitoring this setup closely and will provide updates in future videos as we move into 2025. Please note, this content is for educational purposes only and should not be interpreted as financial advice. 📉✅
SOLANA the best📊 Technical Analysis of Solana (SOL/USD):
1️⃣ Resistance Zone (📈):
The main resistance level is at $229.93, marked in the red area. If the price reaches this level, there is a possibility of reversal and price correction.
2️⃣ Support Zone (📉):
The gray zone between $145 and $148 acts as a strong support level. This range is attractive for buying (Buy Zone).
3️⃣ Exponential Moving Average (EMA) (🔶):
The price is trading below the 50-day EMA, indicating a bearish trend.
5️⃣ Trading Suggestions:
📥 Buy: Near the support level of $145-$148, accompanied by a reversal signal.
📤 Sell: Near the resistance level of $229 to take profit.
6️⃣ Risk Warning (⚠️):
If the price closes below the $145 level, there is a higher likelihood of a continued downtrend.
I see SOLANA above 320 (Ready to takeoff) Entire Market is green but SOL is red.
This recent and sudden decrease in SOL’s price (within hours) suggests Bears are watching and wanna drag it down.
Anyways, SOLANA is about to jump in a “Money Train”.
To all the Crypto Traders get ready:
As soon As SOLANA hits 190 mark , keep your tools blazing hot ready and jump on the train. Its gonna be a Fast ride thus Furious.
Trust No Exchange
Trust No Broker
Use Extreme Risk Management and always keep back up ready in your “left wallet”.
Time to go.
I see SOLANA above 320