SOL Trade Plan: Daily Support, Liquidity Grab & Trade Idea.Solana (SOL) is currently navigating a challenging market environment, with broader sell-offs across the crypto space weighing heavily on its price action. On the daily and 4-hour timeframes, SOL has traded into a significant support zone, marked by previous swing lows. This area has historically acted as a magnet for buyers, but the recent dip below these levels suggests a liquidity grab is underway. This move has likely triggered sell stops sitting below the lows, creating the potential for a reversal as smart money steps in. ⚡
Zooming into the 15-minute timeframe, SOL is consolidating within a tight range, reflecting a period of indecision. This range-bound behavior often precedes a breakout, and a bullish break above the range could signal the start of a recovery. A shift in market structure—marked by higher highs and higher lows—would provide further confirmation of bullish intent.
Key Insights:
Daily Timeframe: SOL has dipped below key support levels, sweeping liquidity.
4-Hour Timeframe: Price is overextended, trading into a critical demand zone.
15-Minute Timeframe: Consolidation within a range, awaiting a breakout for directional clarity.
Trading Plan:
Patience is Key: Wait for SOL to break out of the 15-minute range to the upside. 🚀
Market Structure Confirmation: Look for a clear shift to bullish market structure (higher highs and higher lows). 📊
Entry Strategy: Enter long positions after confirmation, with a stop-loss placed below the range low. 🛡️
Profit Targets: Focus on resistance levels on the 4-hour and daily timeframes for potential take-profit zones. 🎯
Levels to Watch:
Support Zone: Previous daily swing lows, now acting as a liquidity zone.
Resistance Zone: The upper boundary of the 15-minute range and key levels on the 4-hour chart.
This setup highlights the importance of waiting for confirmation before entering a trade. While the liquidity grab below support is a promising signal, a breakout and bullish structure are essential to avoid false moves. As always, this is not financial advice—traders should conduct their own analysis and manage risk appropriately. ⚠️
Solusdtsignal

Crypto Sell-Off: Is Solana Headed for $80?Without a doubt, Solana was the hottest topic in the crypto market last year and at the start of this one—especially with the meme coin craze.
However, after peaking near $300, the price began to decline in what initially appeared to be a normal correction. But once Solana broke below the $200 mark, things turned ugly, and the price quickly dropped to the key $120 support zone—a level that held strong over the past year.
Now, it looks like Solana is on the verge of breaking below this support, which could trigger an acceleration toward $80, with the $100 psychological level as an intermediate stop.
________________________________________
Why the Downside is Likely to Continue
📉 Bulls Can’t Hold Gains – Short-term rallies are fading fast, showing a lack of real buying strength.
📉 Bearish Engulfing Candle – Yesterday’s price action printed a lower high, adding further pressure on support.
📉 $120 Breakdown Incoming? – If this level fails, expect a sharp decline toward $80.
________________________________________
Trading Plan: Selling Under $130
🔻 Sell Rallies Below $130 – Targeting a move to $80 in the medium term.
🔻 Only a Sustained Move Above $130 – Would shift Solana to a neutral stance—not bullish by any means.
For now, the bearish pressure remains, and selling rallies is the strategy to follow. 🚀

SOLANA(UPDATE)Hello friends
Due to the heavy price drop, you can see that buyers are slowly entering and the price is creating a good ascending channel, which now provides a good opportunity to buy in stages and with capital management and move towards the specified goals.
Don't forget to save profit on each target.
*Trade safely with us*

Solana Ready to Soar? Key Entry for a Big Move!Hi traders! Analyzing Solana SOL/USD on the 1H timeframe, spotting a potential entry:
🔹 Entry: 126.31 USD
🔹 TP: 139.82 USD
🔹 SL: 112.95 USD
SOL is bouncing off a key trendline support, signaling a potential bullish move. RSI is recovering from oversold levels, and if momentum continues, we could see a push toward 139.82 USD. Keep an eye on price action!
⚠️ DISCLAIMER: This is not financial advice. Trade responsibly.

SOL/USDT: UPDATE SIGNALHello friends
You can see that after the price fell in the specified support area, buyers came in and supported the price and made a higher ceiling.
Now we can buy at the specified levels with capital and risk management and move with it to the specified targets.
*Trade safely with us*

SOL - Were you entertained?At $21 I predicted SOL will get back to ATH. (see below)
This is an update of the idea where I provide detailed comparison to a bearish shark. This also plays with how I see BTC and rest of crypto. Unlike what is being said by others, I believe we are closer to the end of the crypto rally.
Please boost idea and follow.

SOL/USD "Solana vs US Dollar" Crypto Market Heist Plan🌟Hi! Hola! Ola! Bonjour! Hallo! Marhaba!🌟
Dear Money Makers & Robbers, 🤑💰✈️
Based on 🔥Thief Trading style technical and fundamental analysis🔥, here is our master plan to heist the SOL/USD "Solana vs US Dollar" Crypto market. Please adhere to the strategy I've outlined in the chart, which emphasizes short entry. Our aim is the high-risk Green Zone. Risky level, oversold market, consolidation, trend reversal, trap at the level where traders and bullish robbers are stronger. 🏆💸Book Profits Be wealthy and safe trade.💪🏆🎉
Entry 📈 : "The vault is wide open! Swipe the Bearish loot at any price - the heist is on!
however I advise to Place buy limit orders within a 15 or 30 minute timeframe most recent or swing, low or high level. I Highly recommended you to put alert in your chart.
Stop Loss 🛑:
Thief SL placed at the recent / swing low level Using the 4H timeframe (150.00) swing trade basis.
SL is based on your risk of the trade, lot size and how many multiple orders you have to take.
Target 🎯: 90.00 (or) Escape Before the Target
🧲Scalpers, take note 👀 : only scalp on the Short side. If you have a lot of money, you can go straight away; if not, you can join swing traders and carry out the robbery plan. Use trailing SL to safeguard your money 💰.
SOL/USD "Solana vs US Dollar" Crypto market is currently experiencing a Bearish Trend,., driven by several key factors. 📰🗞️Read Fundamental, Macro, COT Report, On Chain Analysis, Sentimental Outlook, Intermarket Analysis, Future Prediction:
📌Keep in mind that these Fundamental factors can change rapidly, and it's essential to stay up-to-date with market developments and adjust your analysis accordingly.
⚠️Trading Alert : News Releases and Position Management 📰 🗞️ 🚫🚏
As a reminder, news releases can have a significant impact on market prices and volatility. To minimize potential losses and protect your running positions,
we recommend the following:
Avoid taking new trades during news releases
Use trailing stop-loss orders to protect your running positions and lock in profits
💖Supporting our robbery plan 💥Hit the Boost Button💥 will enable us to effortlessly make and steal money 💰💵. Boost the strength of our robbery team. Every day in this market make money with ease by using the Thief Trading Style.🏆💪🤝❤️🎉🚀
I'll see you soon with another heist plan, so stay tuned 🤑🐱👤🤗🤩

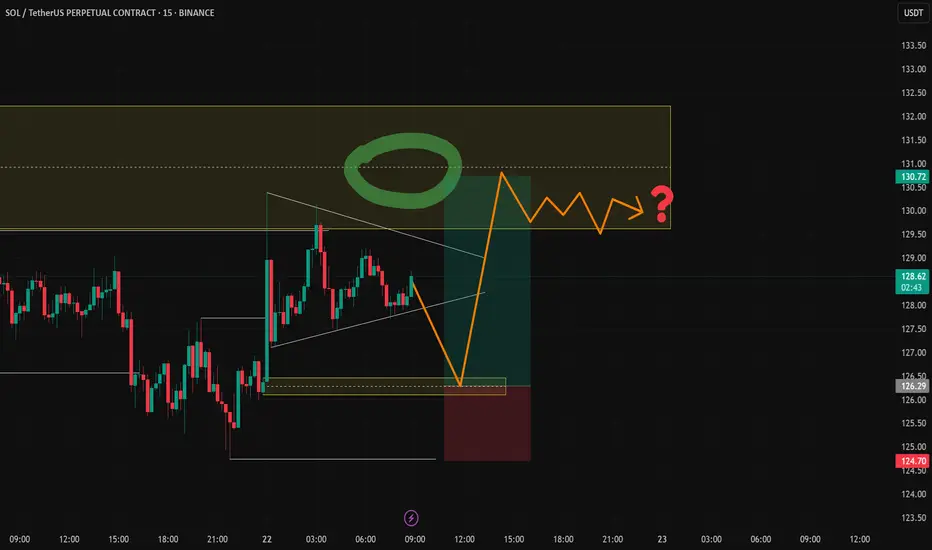
solana trade setup 15min chart* if you are trading on market orders need to set limit order *
i say this because last week it has going all directions and playing with strict levels are important
just spotted a triangle forming which could be drying up in volume as of recording this chart setup it saturday where major market remains closed the volume and volatility will be low
buy area 126-126.50 target 130.5 to 131 sl 124.70-50
triangle is trap for liquidation be careful !!
SOL/USDT 1H: Bullish Trend Holding – Can $137 Be Reached?SOL/USDT 1H: Bullish Trend Holding – Can $137 Be Reached?
🚀 Follow me on TradingView if you respect our charts! 📈 Daily updates!
Current Market Conditions (Confidence: 8/10):
Price at $134.34, confirming strong momentum and trend continuation.
RSI at 72, indicating overbought conditions, but trend remains strong.
Hidden bullish divergence observed on the recent pullback, signaling further upside.
Market Makers completed accumulation in the $126 - $128 zone, now shifting toward markup.
LONG Trade Setup:
Entry: $133.50 - $134.00 zone.
Targets:
T1: $136.00 (first resistance).
T2: $137.00 (next liquidity zone).
Stop Loss: $131.20 (below recent support).
Risk Score:
7/10 – Favorable setup, but overbought RSI suggests potential pullbacks.
Market Maker Activity:
A
ccumulation phase completed, transitioning into a distribution phase.
Clean break above $133.00 confirms institutional interest and trend continuation.
Higher low formation with increasing volume, supporting further bullish momentum.
Strong support established at $131.20, reinforcing the uptrend.
Recommendation:
Long positions remain favorable within the $133.50 - $134.00 entry range.
Scaling in on pullbacks to $133.50 is recommended to optimize entry.
Monitor price reaction at $136.00, as this level may see short-term resistance.
🚀 Follow me on TradingView if you respect our charts! 📈 Daily updates!

Solana’s Price Action: Aftermath of the Blow-Off TopThe recent peak for Solana, approaching $300, has proven to be a classic blow-off top. The subsequent decline has broken through three key support levels, retracing around 60% and ultimately reaching the $120 level—a price point that has acted as a strong floor over the past year, with multiple reversals from this zone.
While this may seem positive, the chart structure at the moment doesn't appear encouraging for bulls.
Current Market Structure: A Bearish Outlook
Looking at the price action, it’s clear that the market has faced significant downward pressure. Despite the bounce from $120, the overall structure suggests caution. While the $120 level is historically strong, there’s no guarantee it will hold again. The series of broken support levels and the depth of the correction point to a market that is struggling to regain its previous strength.
Optimistic vs Pessimistic Scenarios: Where Could Solana Go Next?
In my opinion, the optimistic scenario for Solana would see the price range between the $120 zone and the $180 zone. This would represent a consolidation pattern, as the market tries to establish a new equilibrium. However, given the overall trend and recent price action, it’s also important to consider a more pessimistic scenario. In the worst case, the price could fall as low as $80, especially if the broader market continues to face downward pressure.

#SOL/USDT#SOL
The price is moving in a descending channel on the 1-hour frame and is expected to continue upward.
We have a trend to stabilize above the 100 moving average once again.
We have a downtrend on the RSI indicator that supports the upward move with a breakout.
We have a support area at the lower boundary of the channel at 121.60.
Entry price: 126
First target: 129
Second target: 132
Third target: 135

SOL/USDTHello friends
Given the downward trend we had, the price has reached a good support area and if the area is maintained, you can enter a buy trade and move to the specified targets with it.
*Trade safely with us*

SOL/USD "Solana vs U.S Dollar" Crypto Market Heist Plan🌟Hi! Hola! Ola! Bonjour! Hallo!🌟
Dear Money Makers & Robbers, 🤑 💰🐱👤🐱🏍
Based on 🔥Thief Trading style technical and fundamental analysis🔥, here is our master plan to heist the SOL/USD "Solana vs U.S Dollar" Crypto Market. Please adhere to the strategy I've outlined in the chart, which emphasizes short entry. Our aim is the high-risk Green Zone. Risky level, oversold market, consolidation, trend reversal, trap at the level where traders and bullish robbers are stronger. 🏆💸Book Profits Be wealthy and safe trade.💪🏆🎉
Entry 📈 : "The heist is on! Wait for the breakout (160.00) then make your move - Bearish profits await!"
however I advise placing Sell Stop Orders below the breakout MA or Place Sell limit orders within a 15 or 30 minute timeframe. Entry from the most recent or closest low or high level should be in retest.
Stop Loss 🛑:
Thief SL placed at the recent / nearest low level Using the 1D timeframe (200.00) swing trade basis.
SL is based on your risk of the trade, lot size and how many multiple orders you have to take.
Target 🎯:
1st Target - 125.00 (or) Escape Before the Target
Final Target - 90.00 (or) Escape Before the Target
🧲Scalpers, take note 👀 : only scalp on the Short side. If you have a lot of money, you can go straight away; if not, you can join swing traders and carry out the robbery plan. Use trailing SL to safeguard your money 💰.
📰🗞️Fundamental, Macro, COT, Sentimental Outlook:
SOL/USD "Solana vs U.S Dollar" Crypto Market is currently experiencing a bearish trend,., driven by several key factors.
⚡⭐Fundamental Analysis
Blockchain Trends: Solana's blockchain growth is expected to slow down, driven by increasing competition from other blockchain platforms.
Smart Contract Activity: Smart contract activity on Solana's blockchain is expected to decrease, driven by growing competition from other blockchain platforms.
Mining Difficulty: Solana's mining difficulty is expected to decrease, driven by decreasing network hash rate.
Transaction Volume: Solana's transaction volume is expected to decrease, driven by decreasing demand for cryptocurrency transactions.
⚡⭐COT Data
Non-Commercial Traders (Institutional):
Net Short Positions: 55%
Open Interest: 100,000 contracts
Commercial Traders (Companies):
Net Long Positions: 30%
Open Interest: 50,000 contracts
Non-Reportable Traders (Small Traders):
Net Short Positions: 15%
Open Interest: 20,000 contracts
COT Ratio: 0.6 (indicating a bearish trend)
⚡⭐Sentimental Outlook
Institutional Sentiment: 40% bullish, 60% bearish.
Retail Sentiment: 35% bullish, 65% bearish.
Market Mood: The overall market mood is bearish, with a sentiment score of -50.
⚡⭐On-Chain Analysis
Network Hash Rate: Solana's network hash rate has decreased by 10% over the past month, indicating a decline in mining activity.
Transaction Volume: Solana's transaction volume has decreased by 20% over the past month, indicating a decline in network activity.
Active Addresses: Solana's active addresses have decreased by 15% over the past month, indicating a decline in network adoption.
⚡⭐Market Data Analysis
Order Book Analysis: The SOL/USD order book is showing a significant imbalance, with more sell orders than buy orders, indicating a bearish market sentiment.
Liquidity Analysis: Solana's liquidity has decreased by 10% over the past month, indicating a decline in market participation.
Volatility Analysis: Solana's volatility has increased by 20% over the past month, indicating a more unpredictable market.
⚡⭐Positioning
Long Positions: 30% of total positions
Short Positions: 70% of total positions
Neutral Positions: 0% of total positions
Leverage: 2:1 (average)
⚡⭐Next Move Prediction
Bearish Move: Potential downside to 140.00-125.00.
Target: 125.00 (primary target), 90.00 (secondary target)
Next Swing Target: 80.00 (potential swing low)
Stop Loss: 190.00 (above the 30-day high)
Risk-Reward Ratio: 1:2 (potential profit of 30.00 vs potential loss of 15.00)
⚡⭐Overall Outlook
The overall outlook for SOL/USD is bearish, driven by a combination of fundamental, technical, and sentimental factors. The expected slowdown in Solana's blockchain growth, decreasing smart contract activity, and bearish market sentiment are all supporting the bearish trend. However, investors should remain cautious of potential upside risks, including changes in global economic trends and unexpected regulatory developments.
⚠️Trading Alert : News Releases and Position Management 📰 🗞️ 🚫🚏
As a reminder, news releases can have a significant impact on market prices and volatility. To minimize potential losses and protect your running positions,
we recommend the following:
Avoid taking new trades during news releases
Use trailing stop-loss orders to protect your running positions and lock in profits
📌Please note that this is a general analysis and not personalized investment advice. It's essential to consider your own risk tolerance and market analysis before making any investment decisions.
📌Keep in mind that these factors can change rapidly, and it's essential to stay up-to-date with market developments and adjust your analysis accordingly.
💖Supporting our robbery plan will enable us to effortlessly make and steal money 💰💵 Tell your friends, Colleagues and family to follow, like, and share. Boost the strength of our robbery team. Every day in this market make money with ease by using the Thief Trading Style.🏆💪🤝❤️🎉🚀
I'll see you soon with another heist plan, so stay tuned 🤑🐱👤🤗🤩

Solana SOL Will Bounce, But Then Scam!Hello, Skyrexians!
Couple of weeks ago we told you that BINANCE:SOLUSDT will reach $110 in the wave 5 inside the major wave A. You can find this analysis here . Exactly from this zone we have seen the bounce. This bounce is a major correction and those who listen this analysis could already be in the great profit. But anticipated bounce is not the bull run continuation and finally Solana will drop hard because its era is finished.
Let's take a look at the weekly time frame. Here we can see that 5 Elliott waves with the Awesome Oscillator's divergence. After that the major correction has been started. Wave A has been finished at $110 with the green dot at the Bullish/Bearish Reversal Bar Indicator and now we will see wave B, which will reach the Fibonacci 0.5 approximately at $200. From there we will see the scam drop in wave C. It will likely break the major Fibonacci 0.61 support. In this case game is over and Solana can fall for a years or even scam.
Best regards,
Skyrexio Team
___________________________________________________________
Please, boost this article and subscribe our page if you like analysis!

SOLUSDT: Strong Bounce from Major Support!!BINANCE:SOLUSDT has shown a strong recovery after hitting a major support zone around $110. This bounce is accompanied by good trading volume, indicating growing interest. Investors who missed the previous rally are now accumulating, which adds further strength to the bullish sentiment.
As market conditions improve, the entry of bigger players could push SOL towards higher highs. If momentum continues, there’s potential for SOL to breach its previous all-time high, with a long-term target of $500 in sight.
For investors, this presents a solid buying opportunity to hold for the long term. Traders, however, should manage their risk carefully and always set a stop loss to protect their capital.
BINANCE:SOLUSDT Currently trading at $132
Buy level: Above $110
Stop loss: Below $90
Target : $500
Max Leverage 3x
Always keep Stop loss
Follow Our Tradingview Account for More Technical Analysis Updates, | Like, Share and Comment Your thoughts

Solana SOL Weakness Continues: Is the Next Leg Lower Coming? 📉 Solana ⚡ is showing signs of weakness, maintaining a clear bearish trend on this 4H timeframe. Price action has traded into a key support zone, with a potential pullback offering an opportunity to enter short at a premium before the next leg lower 🔻.
If sellers remain in control, we could see a continuation to lower levels 📉.
⚠️ Not financial advice—always manage risk appropriately!

SOL/USDT LONG SET UP (Solana)Entry 1 $120.00
Entry 2 $110.00
Stop loss $95.00
Take profit 1- $145.00
(Close 33%)
Take profit 2- $170.00
(Close 66%)
Take profit 3-$195.00
(Close 100%)

If SOL crosses this last area (1D) It'll be a really big problem
If SOL crosses down the last green area, we're done.
It's on daily timeframe, each candle = 1 day
Today's candle should close above the price 118, if it closes below, then there's a big chance of a big fall.

Breaking: Solana Tanking HardSolana often referred to as the Ethereum killer is tanking hard albeit Bitcoin also dipped to the $79k zone. Designed to facilitate decentralized app (DApp) creation, aiming to improve scalability by introducing a proof-of-history (PoH) consensus combined with the underlying proof-of-stake (PoS) consensus of a blockchain, SOL has been building a scalable network with massive growth noticeable in its ecosystem.
With Selling pressure increasing, Solana could be on the brink of a massive selling spree with support pegged to the $110-100 pivot points.
However, should Solana bounced back and break pass the 78.6% Fibonacci retracement point, a trend reversal is inevitable. With the RSI at 35, a little shift to a 45 point in RSI could be all what Solana needs to catalysed a bullish breakout.
Solana Price Live Data
The live Solana price today is $124.43 USD with a 24-hour trading volume of $4,578,943,167 USD. Solana is down 6.54% in the last 24 hours, with a live market cap of $63,337,175,317 USD. It has a circulating supply of 509,018,387 SOL coins and the max. supply is not available.

Long-term Solana (SOL) OutlookExpecting a further drop in price to a range of $10-$40 before a bull run to possibly another ATH. Sentiment and price pattern is similar across all major cryptocurrencies. HODLing would be extremely stressful during this bear run.
This is only my opinion and should not be taken as an investment advice. The market can of course, turn at any point in time.

SOL/USDT BUYHello friends
Given the price reaching resistance and price correction, now the best conditions have become to buy in stages and with capital management. We have also specified price targets for you.
*Trade safely with us*

#SOL/USDT#SOL
The price is moving in a descending channel on the 1-hour frame and is adhering to it well and is heading to break it upwards strongly and retest it
We have a bounce from the lower limit of the descending channel, this support is at a price of 157.48
We have a downtrend on the RSI indicator that is about to break and retest, which supports the rise
We have a trend to stabilize above the Moving Average 100
Entry price 159.85
First target 165.92
Second target 169.59
Third target 175.10

#SOL/USDT Weekly overview!Solana is down 57% from its peak and is currently trading just below the 63-week support level.
This is a crucial level! The last weekly candle closed right above the support, but for now, it seems we’ll need to wait a few more days for more clarity.
It could either turn into a nice juicy dip or signal the start of a bearish price action. I personally think it's a dip,
Either way, it’s better to wait for the weekly close for more clarity.
Do hit that like button and share your views in the comment section.
Thank you
#PEACE
