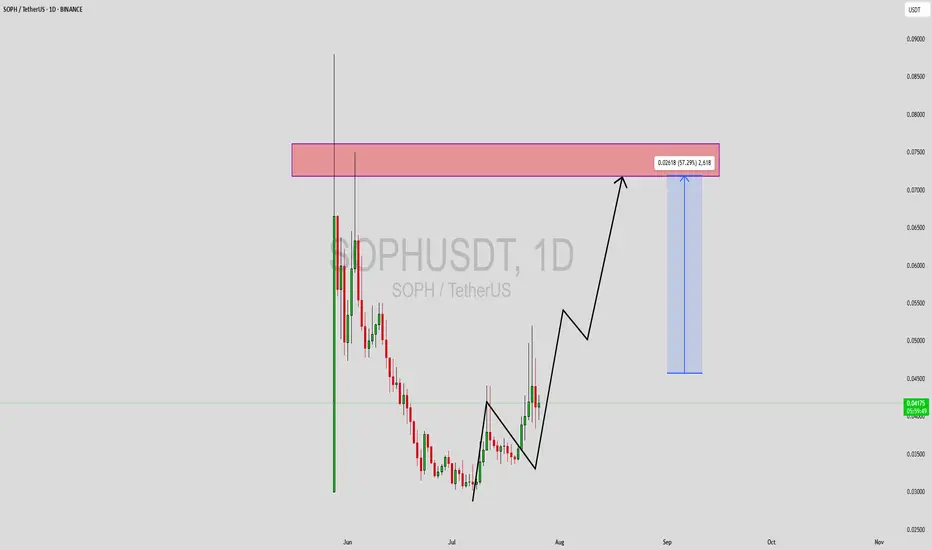
SOPHUSDT Forming Bullish ReversalSOPHUSDT is currently displaying a bullish reversal structure on the daily chart, forming a classic staircase pattern with higher highs and higher lows. After a prolonged downtrend, the asset appears to have found a strong accumulation base, and recent price action is now showing momentum building toward a breakout move. The chart suggests a 50%+ potential upside move from the current levels, targeting the major resistance zone around $0.07–$0.075, which is a previously tested supply zone.
Volume confirmation is key here—the recent increase in volume alongside green bullish candles indicates growing investor interest and possible early accumulation from smart money. This is typically a strong signal for upcoming continuation in price movement. With solid support now established below and momentum pushing upward, traders may find a favorable reward-to-risk setup here.
This move is further supported by positive sentiment building across the crypto space for SOPH, with many traders beginning to take notice. The expected gain zone reflects realistic mid-term targets and aligns with previous resistance levels. A clean breakout and retest above $0.045 would further confirm bullish dominance and open doors for rapid price appreciation in the coming weeks.
The overall setup on SOPHUSDT is technically sound, with good volume, bullish structure, and an appealing price action flow. For traders scanning the market for high-potential altcoins, this could be one to watch closely.
✅ Show your support by hitting the like button and
✅ Leaving a comment below! (What is You opinion about this Coin)
Your feedback and engagement keep me inspired to share more insightful market analysis with you!
SOPHUSDT
Phemex Analysis #85: Is it Time to Enter SOPHON (SOPH)?!SOPHON ( PHEMEX:SOPHUSDT.P ), a rising project in the cryptocurrency space, has recently attracted traders' attention with its dynamic price action and notable volatility. Currently trading around $0.055, SOPH experienced a bearish move after failing to maintain earlier gains above $0.065. As the price now hovers near crucial short-term support levels, traders are evaluating whether this dip presents a buying opportunity or signals further downward pressure. Let’s explore several potential scenarios based on SOPH’s 15-minute chart to determine if now is the ideal moment to enter the market.
Possible Scenarios (15-minute chart)
1. Double Bottom at $0.05 with RSI Divergence (Bullish Reversal)
A closer examination of SOPH's 15-minute chart reveals the potential formation of a double bottom near the $0.05 level, accompanied by RSI divergence. Specifically, the RSI is showing higher lows while the price revisits its previous low, signaling diminishing selling pressure and a likely bullish reversal.
Pro Tips:
Long-term Accumulation: Consider gradually accumulating SOPH near the $0.05 support if bullish divergence persists.
Confirmation: Wait for price stabilization and rising volume near the support level to confirm the reversal before scaling in.
2. Breakout Above $0.058 (Bullish Confirmation)
If SOPH decisively breaks the immediate resistance level at $0.058, especially accompanied by high trading volume, it could mark a strong bullish signal. However, after the breakout, a minor retracement could form a classic "cup and handle" pattern—historically a robust bullish setup—prior to resuming its upward trajectory.
Pro Tips:
Long Entry: Go long upon confirmed breakout above $0.058.
Pattern Recognition: If a cup and handle pattern forms after the breakout, look to add positions on the subsequent confirmation, preparing for potentially significant upward movement.
3. Bearish Continuation (Cautionary Scenario)
On the downside, if SOPH falls below the critical support at $0.0528 accompanied by higher-than-average trading volume, it indicates the bearish momentum might persist. Such a breakdown could lead to further declines and test deeper support zones.
Pro Tips:
Risk Management: Avoid entering new long positions if this bearish scenario plays out.
Market Observation: Remain on the sidelines, observing until clear bullish reversal signals or price stabilization at a lower support level appear.
Conclusion
SOPHON (SOPH) currently sits at a crucial juncture, offering potential opportunities depending on how price action unfolds in the short term. Traders should closely watch for bullish divergence signals around $0.05, breakout confirmations above $0.058, or bearish continuation below $0.0528. Employ disciplined risk management, and remain adaptable to market dynamics to confidently and strategically trade SOPHON (SOPH).
Tips:
Elevate Your Trading Game with Phemex. Experience unparalleled flexibility with features like multiple watchlists, basket orders, and real-time adjustments to strategy orders. Our USDT-based scaled orders give you precise control over your risk, while iceberg orders provide stealthy execution.
Disclaimer: This is NOT financial or investment advice. Please conduct your own research (DYOR). Phemex is not responsible, directly or indirectly, for any damage or loss incurred or claimed to be caused by or in association with the use of or reliance on any content, goods, or services mentioned in this article.
