SOXX ShortSOXX is on the verge of a major breakdown, much like the one that lead to the melt down in Q4 of last year (followed by a ~20% drop after the trend break). However, we are not there yet because we are resting on support. The main, long term pattern we are looking at is a bearish rising wedge. Within the wedge we also have a symmetrical triangle which was entered from above, which suggests - as a continuation pattern - that price will follow lower. Keep in mind there is also another green trend line underneath which acts as a type of extra confirmation which must be broken for a definitive sell signal. A sell signal will be confirmed once we have a daily close below those trends, and especially if we have a weekly close below. Given how resilient this market has been, it would not be unreasonable for SOXX to put in a marginal new high first, thus extending the negative divergences on the PPO and RSI before the grand finale to the downside. Since we are very oversold on the 1-hour candlesticks and have positive divergences building on the market futures (ES and NQ), we can at least expect a small thrust up to the resistance shown as the double green lines above. Either way, once we crack below, there will without question be volatility, maybe even a back-test of the broken wedge pattern, but ultimately I can foresee SOXX going down to the second yellow uptrend shown below. The lower yellow uptrend is one of the two supports I have drawn from the November 2008 lows, following the Great Recession. Both have acted as support and resistance many times, thus showing that both are important levels that price will abide by. Such a move would equate roughly to a 25% drop, depending from which point we break down from.
For this trade, we will be using SOXS, a triple levered inverse ETF of SOXX. I would avoid the use of put options since that involves gauging the time frame in which this move occurs which only adds even more difficulty to an already complex setup. A suggested stop loss would be anywhere just above the top of the daily candle which confirms the initial break down.
SOX

SOX - Semiconductor index as the Growth Tech Cycle Dow TheorySOX - Semiconductor index as the Growth Tech Cycle Dow Theory, in this chart we see a climax divergence in 2001 and some spots in the current cycle.. similar way to see transports index as a measure of the dow theory. it would be nice if was easy to get an advance decline line or something similar in order to see the "breathe" of SOX, I am sure will also state that same divergence timing before SPX dropped hard.

Lam Research (LRCX) Next Target is 360 USDLRCX is about to breakout its prior high, based on symmetry, next target is 360 USD.

Semiconductor (SOX) to gain 50-100% in the next 5-10 yearsThe trend is obvious.
Proud to be the only few longs on the stock market while everyone else is screaming crash and recession.
Semiconductors are going through secular trend.
It will still be cyclical but the cycles will be much smaller and limited.
Charts are telling us different story.
Market always moves ahead of narrative.
The narratives are there, buried below the noises.
Valuations might be expensive, but the total value creations and total addressable market are big.
The trend is obvious.
People will be left wondering why they have not seen this coming in 10 years to come.

ASML (Heading towards $300)ASML Holdings is a parabola, an aggressive one and next target will be $300.

Semicondutctor to Outperform NasdaqChart is more useful in telling a story.
And the story here is that the Semiconductor Index is testing an important Resistance Level versus Nasdaq.
Once it breaks, it will outperform Nasdaq.
This is inline with the thesis that Semiconductor industry will be net beneficiary of Industrial Revolution 4.0.
Don't be short term sighted. This is multi year/decade story and theme.
in 10/20 years, people will be shooting themselves on their foot for not seeing the obvious.

LSCC looking to go again from my viewLiking a swing opportunity in LSCC here. It's got that look to it!


ETHER Anyone?Ethereum Power Trades for today......
wait for it..............
.............................................
....................................
Recommendation: from yesterday;
Buy at / above: 244.14 Targets: 247.94 --- 251.89 --- 255.87 --- 259.89
Stoploss : 240.25
Sell at / below: 240.25 Targets: 236.51 --- 232.68 --- 228.88 --- 225.11
Stoploss : 244.14
and for Today
Recommendation:
Buy at / above: 248.06 Targets: 251.89 --- 255.87 --- 259.89 --- 263.93
Stoploss : 244.14
Sell at / below: 244.14 Targets: 240.37 --- 236.51 --- 232.68 --- 228.88
Stoploss : 248.06
Up above 250 & 252 some offers on stops there so thats why TP 1 is at 251.89 to be on the safe side, which leaves room for your slippage/dodgy broker manufacturings.
I will set my offer today on the EU at :: 1.1420
and for ETHUSD at 264
just above 252 more offers intraday then a really big level to watch out for is 255.62 : I believe its also some sort of pivot level.
If 250 can break larger funds will may come to the party
Lookout for a Big players with real money at 268.14 now. You'll probably find its like a 61.8 of something, ah its around the 78.6 but the charts starting to look a little messy now.
ok 'Got to go, that cheesecake aint going to eat itself. Oh almost forgot the price of
296.70 is Very important Sell price, but thats for next week. Last month we almost made it there and some plonker came along and dumped Ether for Bitcoin probably. If you were a lucky you would have gone on a buying frenzy at the lower Downside Target 4 zone. If you missed it buy at 240 today, that should do it.
If we could get goldmansox in on this at 240 for tomorrow (hint) yes we know they have a crypto fund manipulation desk, we're on to you lot. Remember the 240 level...go big or go home.
Thats all for now.


S&P500 set for sugar popApologies for the poor sound, I recorded this using my earphones (in a waiting room and making use of the time ;). Have a wonderful day all!

Bulls and Bears zone for 06-04-2019Market will open gap up and try to close the gap first before rallying. Should be a pretty good day for Bulls.
Couple of reports that could impact the market:
US:Jerome Powell Speaks
9:55 AM ET
US:Factory Orders
10:00 AM ET
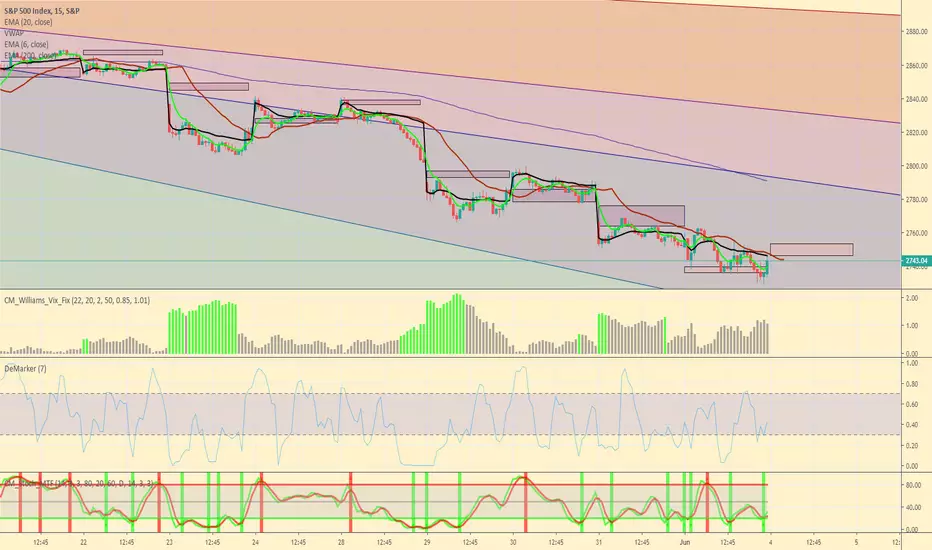
Chart of the Day: $TYA hits ABCD target $TYA hits an ABCD price objective in spectacular fashion as Trump enlarges the trade war to include Mexico. Not sure what would cause a sell-off in bonds, but the fact the $TYA hit the ABCD target in such an explosive manner as we head into the last trading day of the month and new SSRs being set, makes me do a double and want to take money off the table. Looking across to equities which have been selling off for a month and $ESA recently breached the crucial 2800 level together with the SOX trading at a key congestion zone, I would not be surprised to seem some near-term strength in equities and weakness in $TYA.

SOXX $180 is very important to watchIf SOXX breaks $180 look out below. The trade war is heating up now.


Mother Bear Coming SOON-Bump and run (Stock market)Hi traders,
maybe 2020 or 2021.
Shot term-bull run
Long term-very bearish


$AAPL shares still have room to run in this momentum rally$AAPL shares still have room to run in this momentum rally. It should be a quick final move up then snap back reversal once the target is tagged.

Philadelphia Semiconductor index/SOX: Bump and Run?!(Be careful)Hi traders,
Buy stock.
but... be careful.. Bump and run..
