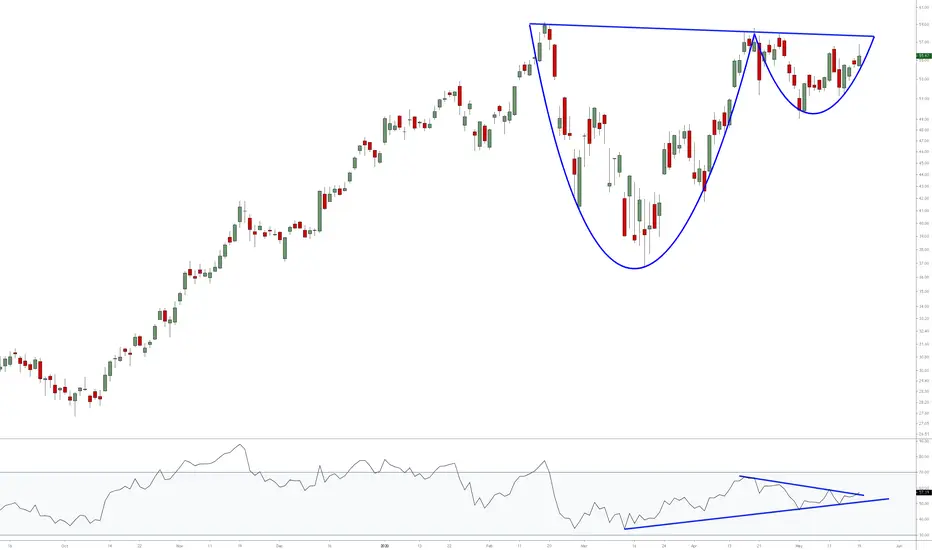
Bullish On Semi's? Go Long $SIMO.I'm bullish on semi-conductor stocks. Especially small & mid-cap names. Check out Silicon Motion Technology. I like the set up here.
P/E = 17.73
EPS Growth = 483%
Nice entry point IMO.
New to charting. Let me know what you think?
Thanks.
SOXX

STX Insider Selling of $86 Million Coupled with Potential H&S Insider selling of $86 Million final three days of December.
I anticipate an attempt at regaining $63 on Monday by this one and this is where I plan to initiate a short position by using February or March Puts.
Disclaimer: Not trading advice.
STX

Copper Outlook /long-term Technical Analysis
We have broken the long-term resistance trend that had been in place for almost 10 years.
RSI is very overbought, but this market has proven overbought can stay overbought for a long period.
In the chart there is 3 potential targets for Copper in the long-term picture.
There are several place to take profits and/or add on pullbacks. (These are the orange segment lines)
Fundamental Analysis
Industrial metals have been rallying strong; and are likely to continue with expected infrastructure investment for 2021 and further.
Copper is also used in Semiconductors, which is the basis of all technology hardware.
Steel is behaving in a very similar fashion, adding to the idea of industrial metals outperforming precious metals.

$NVDA with the same pattern as $TSLA. VC by MinerviniIf you missed the $TSLA VCP, here's one more $NVDA.
Same pattern as $TSLA before the big breakout with higher lows and supply dry up indicating that most of the selling is done.
Volatility contraction Pattern by @markminervini 📈

SMH - Neutral but Slightly Bearish Nearterm
Not trading advice. Just journaling my chart entry here.


Teradyne - Cup & Handle + Measured MoveTeradyne made a cup & handle, which continues to see strength.
Cup & Handle -- Measured Move
Making a measured move from the floor of the cup, to the resistance which was all time highs, we get a 18 points (12% aprox.) potential move.
Trade
Would follow the 5sma (green line) to take profits for 50% of my position, the other 50% if it takes the Resistance 1 level.
There are also other semiconductors making ATH, which is adding to the strength in the industry overall.

SOXX 5smaNotice how the 5sma has been resistance for the SOXX for the past 12 trading days (red oval).
This tells us that short-term, SOXX has to break the 5sma to get out of its current down-trend.
The purple line is the 50sma, which is now also resistance, as we crossed below it, and is now touching the 5sma.

SOXX 30 min view SOX stronger than XLK and QQQ but formed daily chart divergence peak.
30 min chart sees RSI break down 50 together with HA bar showing bearish head.
Disclaimer, this is only for entertainment and education purposes and doesn't serve by any means as a buy or sell recommendation.
Personally I hold both long term long positions and occasionally short term short position, for disclosure purpose.

Intel breaking out Technical Analysis
INTC breaking out of a consolidation channel after its drop due to disappointing earnings.
RSI confirming breakout; at 62.
Intraday volume is above its 10sma average.
200sma lining-up with previous tested support. Breaking this resistance , would take us into next parallel channel.
Attractive risk-reward-ratio at 2.5, placing a stop-loss just below channel top, and profit-exit around the 200sma.

Breakdown of Semiconductors Simple view of this critical sector breaking through key technical trendlines.
Our first bearish sign was the break earlier in August, which held, and rallied back above the original broken trendline. That quickly stopped as momentum ran out, and it's now breaking through multiple trendlines with bulls at max long. This can potentially fall significantly given the overweight bullish positioning and the stretched overbought price.

NVDA: Is This The Start Of A Multiyear Bull Run?NVDA 1M:
2016 - Price formed "U" at/below previous ATH. Slow Stochastic hit overbought then formed "U". Price then broke the ATH and the following bull run lasted 2.4 years and returned 600%+.
2020 - Price formed "U" at/below previous ATH. Slow Stochastic hit overbought then formed "U". Price then broke the ATH.
The 2020 NVDA chart + indicators share many similarities to 2016 NVDA. Is this the start of a multiyear bull run for NVDA?
Link to my previous NVDA charts below.

Nividia Poised for ATH Test!Exhibiting signs of exhaustion, U.S. equities gave up nearly all their gains from the morning, closing today's session flat. The Dow Jones Industrial Average gained +0.56%, the S&P 500 +0.90% and the Nasdaq 100 led the way with +1.09%. Interestingly, a number of heavy hitters are roaming around resistance. One name of note is Apple which finally entered a region where I'd suspect sellers to begin coming in between 301-308. I'll touch upon Apple tomorrow morning. Today, we take a look at Nividia Corp. ahead of earnings May 21st.
All-Time High Bound?
With Nividia Corp. (NVDA) reporting their quarter one earnings on May 21st and yesterday's news that it acquired Cumulus Networks, a deeper look into the charts was deserved. Below is the 4-hour chart of NVDA.
NVDA has rallied 68% off the March lows and has been consolidating at its highs for just over two weeks, a bullish sign. Additionally, resistance at 300 has been tested a third time, as NVDA posts higher lows on declining volume, also bullish. Notice the ascending triangle taking shape. Although, known as a bullish continuation pattern, it is not confirmed until a breakout to the upside. With a breakout the projected target would would propel NVDA to all-time highs of 340 per share.
There is a lot of positive going for NVDA heading into earning's. That said, could NVDA be setting up as a sell the news candidate? The ascending triangle set up is poised to breakout prior too May 21st earnings. It is something to keep in mind if taking on the bullish trade. With fundamentals and technicals aligning heading into earnings, its hard not to be bullish NVDA. Bias: Bullish .
Flat Week Continues
Today was the second straight day U.S. indicies posted flat gains. It's really not a surprise. There is a log of uneasiness in the market and tomorrow may shed some light on that uneasiness. Tomorrow the ADP unemployment report is released and should offer some insight on Bureau of Labor Statistics unemployment rate announcement this Friday. Spoiler, the the report won't look great. Until then, have a great evening!


AMD - Reverse head and shoulders formationAMD is forming a reverse head and shoulders. If we can break the ATH resistance on good volume, AMD will probably keep rallying.
RSI has been trending higher, but it is not as high as it was in its past peak. (short-term bear).
OBV has been trending higher, and its current value is slightly higher than its previous peak (short-term bull).
Keeping on a watchlist.


SOX INDEX BOTTOM MOVING LONG NOW LOOK FOR THAT THOUGHT OVER INTO 2000 NOW WAVE 4 WAS .618 OF LAST UP LEG I AM NOW LONG SOXL 250

Semiconductors & Hashing-Rate Correlation StudyThere are long periods of positive correlation between average bitcoin hashingrate in gigahashes/second and performance of major semiconductor ETFs like SOXX and SMH
As hashing and computing power in general shows massive increases in demand there are only a few companies that have the materials and knowledge to produce 'rocks that think' aka processors and other computing components made of earth metals and silicone.
When I see big printing bars in hashing power but 'divergence' in correlation I may consider adding to semiconductor positions via options on semiconductor ETFs and computing component companies like INTC, AMD, NVDA, and the like as it means someone went out and made a huge investment in processing power in order to make a 'blip' on the hashing map but the ETFs are reflecting a downside move. This divergence between correlation of hashing rate and semiconductors displays a market inefficiency in the expectation for demand of semiconductors and actual demand for semiconductors. This divergence is an opportunity for us to capture in my estimation.
I hope this makes sense and helps your own analysis
Good luck have fun
Much Love
xoxo
snoop

SMH Short Thesis The Next MonthI'm not currently short the semis but upon doing some research I found a nice setup thesis. Similar weekly candles. I see the previous time SMH found it's low about 15.7% down from that weekly candle close after 29 days. If you use the same 15% calculation after 28/29 days, it brings you to the 23% fibonacci level at $120.
This is only a theory at this point and I'll continue to do some digging on it. But it looks ripe for a give back leading up to earnings or after earnings. I'm going to look for a put spread entry on Monday.
Good luck - and as always, don't trade based on my opinions or hypotheses.
SMH

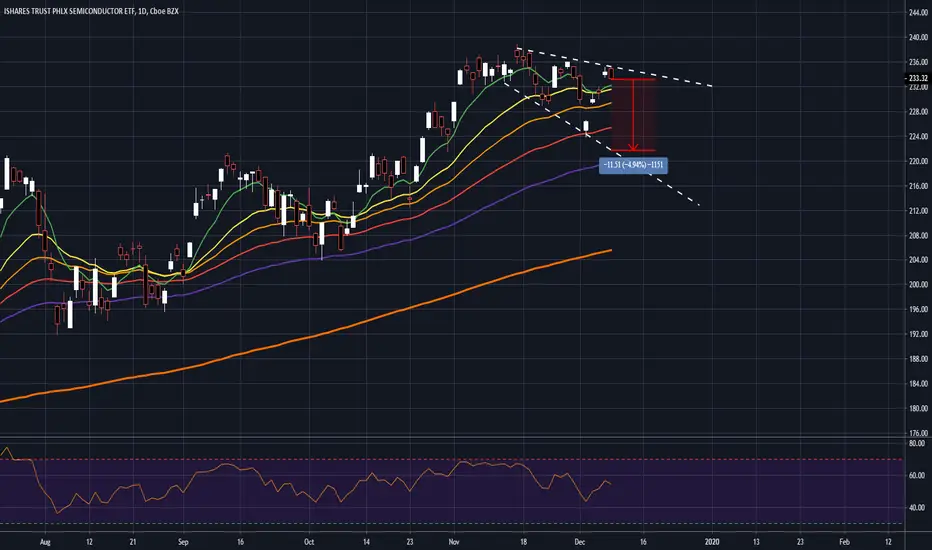
SOXX - Further Weakness - Short Setup Semi-conductors are looking a bit precarious at this point, as you can see we appear to be in a serious of lower lows and lower highs, this is compounded by the falling momentum in the market as a whole.
This coupled with overall weak internals lead me to believe that further weakness is not out of the question, particularly if the price action is unable to break above the upper descending trendline.
Should the price fail at the upper trend, then a visit to the 55 ema or even the 89 ema is quite likely.
This would constitute a move lower of up to 5%.
*This trade setup is entirely dependent upon the price NOT breaking above this upper trendline.
- TradingEdge