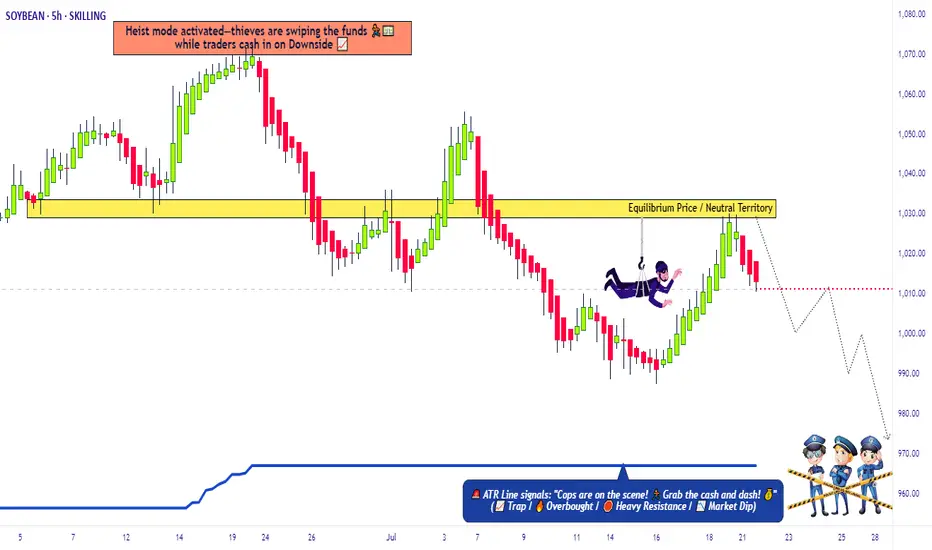
SoyBeans Price Reversal – Time to Swipe Bearish Profits🔓 Operation SoyBeans: Vault Breach Underway! 💼🌾
🌟Hi! Hola! Ola! Bonjour! Hallo! Marhaba!🌟
Calling All Market Bandits, Scalping Buccaneers & Swinging Looters 🕵️♂️💰💣
We've marked our next robbery target—the "SoyBeans" Commodities CFD Market.
This isn’t just a trade, it’s an orchestrated heist built off Thief Trading intelligence: a mix of technical traps, fundamental cues, and criminal market psychology. 🧠💸
🔎 🎯 Entry Point - Where the Safe Cracks Open:
The vault is wide open—grab bearish loot at any price!
But for maximum stealth, layer in buy limit orders on the pullback using the 15m or 30m timeframe near swing highs/lows.
(We thieves call this: DCA under the radar.) 🕳️📉
🛡️ 🚨Stop Loss - Our Escape Hatch:
Set SL at the nearest 4H candle wick swing high (1040.00).
Customize it based on your loot size (lot size), order count, & risk appetite.
A smart thief knows when to vanish! 🏃♂️💨
🏁 💰Target - The Vault Cash-Out Point:
Main Heist Target: 970.00
Or exit early if the cops (volatility) show up! 🚔🎯
💡 Scalper’s Note - Quick Grab & Dash:
If you’ve got a heavy bag 💼💸, scalp short aggressively.
If not, roll with the swing crew—use trailing SLs to lock the loot and flee clean. 💨📦
📉 Thief Insight – Why We're Robbing This Vault:
"SoyBeans" showing bearish breakdowns due to:
📰 COT Positioning
📦 Inventory & Storage Data
🕰️ Seasonal Weakness
💭 Sentiment Drift
🔗 Intermarket Signals
Get the full scoop—go dig deeper into your own thief intelligence sources. 📚🕵️♂️
⚠️ Stay Alert – Market Mayhem Incoming!
News drops = surveillance upgrades. Avoid new trades during major releases.
Protect running loot with tight trailing SLs—guard your stolen goods! 🛑🗞️📉
❤️🔥 Show Some Love to the Robbery Crew!
💥Smash that BOOST button💥 to fuel the Thief Army.
Together, we rob smarter. 💰🚀
🔔 Stay Tuned, Looters:
Another heist is being planned. Don't miss the next setup.
Money is out there… we just have to take it the thief way. 🧠💎
📜 Disclaimer:
This plan is for chart criminals in training 📉🕵️♂️ – not personalized financial advice.
Always assess your own risks before raiding any market vault.
Soybean
Soybean Breakout – Time to Steal Profits!🚨 "SOYBEAN HEIST ALERT: Bullish Loot Ahead! 🎯💰 (Thief Trading Strategy)"
🌟 Greetings, Market Pirates & Profit Raiders! 🌟
"The vault is unlocked—time to plunder the 🌱🍃SOYBEAN CFD market! Here’s your master plan for a smooth heist."
🔎 TRADE SETUP (Thief Edition)
Entry 📈: "Buy the dip or chase the breakout—bullish momentum is ripe for stealing!"
Pro Tip: Use buy limits near 15-30min pullbacks (swing lows/highs) for optimal theft.
Stop Loss 🛑: "Hide your loot!" Set SL at nearest 4H swing low (1030.00). Adjust based on your risk appetite.
Target 🎯: 1085.0 — or escape early if bears ambush!
⚡ SCALPERS’ NOTE:
"Only long scalps allowed! Rich? Raid now. Poor? Join swing thieves & trail your SL!"
🔥 WHY SOYBEAN? (Bullish Catalysts)
Technicals + fundamentals align for a bullish heist.
Check: COT reports, seasonals, macro trends, and intermarket signals (links below 👇).
⚠️ WARNING: NEWS = VOLATILITY
Avoid new trades during major news.
Trailing SLs = your escape rope! Lock profits before the cops (bears) arrive.
💎 BOOST THIS HEIST!
"Smash 👍 LIKE, hit 🔔 FOLLOW, and share the loot! Your support fuels our next raid."
🎯 Final Tip: "Profit is yours—take it and vanish! 🏴☠️"
📢 Stay tuned for the next heist! "Market thieves never sleep…" 😉

Soybeans Loading a Bounce? Demand Zone + COT1. Price Action & Technical Structure
Price has bounced off a strong daily demand zone (1011–969).
Today’s daily candle shows a clear rejection wick from the low, and RSI is signaling a potential reversal.
The market is trading inside a falling channel, currently near the lower boundary — setting up a possible breakout move.
Technical Targets:
• First upside target: 1039–1049
Invalidation: daily close below 990, which would confirm structural breakdown.
2. COT Report – Soybeans Futures (as of July 9, 2025)
• Non-Commercials:
+11,539 spreads | +7,017 shorts | –7,520 longs → Slight bearish pressure, though spreads suggest growing speculative complexity.
• Commercials:
+7,876 longs | –9,084 shorts → Moderate commercial bullish bias.
• Open Interest:
+8,076 contracts → Market activity increasing.
Overall COT positioning is neutral to slightly bullish, with growing signs of accumulation around the 1000 level.
3. Seasonality – MarketBulls
Historically, July is one of the weakest months for Soybeans:
• –44.82 (20Y avg)
• –36.86 (15Y avg)
• –34.74 (10Y avg)
However, early August shows signs of seasonal recovery, and price action is already diverging from typical seasonal behavior.
This makes a deeper breakdown less likely — we could be nearing the end of the seasonal weakness.
Operational Takeaway
Current Bias: Neutral-to-Bullish
Confluence of signals supports the idea of a technical rebound:
✅ Bullish reaction candle in demand
✅ Fibonacci support + lower trendline touch
✅ COT data stabilizing with rising open interest
✅ Seasonal weakness possibly exhausted

Stealing from bears: soybean long setup!🚨 THE GREAT SOYBEAN HEIST: Bullish Raid Plan (Swing/Day Trade) 🏴☠️💸
🌟 ATTENTION, MARKET BANDITS & MONEY SNATCHERS! 🌟
(Hola! Oi! Bonjour! Salaam! Guten Tag!)
🔥 Using the ruthless Thief Trading Strategy (TA + FA), we’re executing a bullish raid on the SOYBEAN Commodities CFD Market! Time to steal profits from the bears before they wake up! 🥷💨
🎯 MASTER HEIST PLAN (BULLISH RAID)
📈 Entry Point (Buy Limit/Market):
"The vault is unlocked—grab the bullish loot at any price!"
🔹 *For precision heists, set buy limits near pullbacks (15M/30M).*
🔹 ALERT: Set price alerts to catch the perfect steal!
🛑 Stop Loss (Escape Route):
📌 Thief SL at nearest swing low (3H timeframe) – 1030.0
📌 Adjust SL based on your risk tolerance & position size.
🎯 Profit Target (Escape Before Bears Strike Back):
💥 1095.0 (or exit early if the trap snaps shut!)
🧲 Scalper’s Bonus:
Only scalp LONG!
Big wallets? Go all-in! Small wallets? Swing-trade the robbery!
Use trailing SL to lock profits and escape clean!
🌱 MARKET TREND: BULLISH (BEAR TRAP SET!)
Overbought? Maybe. But the real trap is where bearish robbers get slaughtered.
High risk = High reward—only for cold-blooded traders!
📡 FUNDAMENTAL INTEL (DON’T SKIP THIS!)
🔗 Full reports (COT, Macro, Seasonals, Sentiment, Intermarket Analysis) in our biio!
🚨 TRADING ALERT: NEWS = DANGER ZONE!
❌ Avoid new trades during news!
🔐 Use trailing stops to lock profits & escape alive!
💥 BOOST THIS HEIST! (HELP US ROB THE MARKET!)
🔥 Hit LIKE & FOLLOW to strengthen our robbery squad!
💰 More heists = More profits. Stay tuned for the next raid!
🐱👤 See you in the shadows, bandits! 🤑🚀

"SOYBEANS" Commodities CFD Market Bearish Heist (Swing Trade)🌟Hi! Hola! Ola! Bonjour! Hallo! Marhaba!🌟
Dear Money Makers & Robbers, 🤑💰💸✈️
Based on 🔥Thief Trading style technical and fundamental analysis🔥, here is our master plan to heist the 🥔🍀🍃SOYBEAN🍃🥔🍀 Commodities CFD Market. Please adhere to the strategy I've outlined in the chart, which emphasizes long entry. Our aim is to escape near the high-risk ATR Zone. Risky level, overbought market, consolidation, trend reversal, trap at the level where traders and bearish robbers are stronger. 🏆💸"Take profit and treat yourself, traders. You deserve it!💪🏆🎉
Entry 📈 : "The vault is wide open! Swipe the Bullish loot at any price - the heist is on!
however I advise to Place buy limit orders within a 15 or 30 minute timeframe most recent or swing, low or high level. I Highly recommended you to put alert in your chart.
Stop Loss 🛑:
Thief SL placed at the Nearest / Swing low level Using the 1D timeframe (980.0) Day/Swing trade basis.
SL is based on your risk of the trade, lot size and how many multiple orders you have to take.
🏴☠️Target 🎯: 1100.0 (or) Escape Before the Target
🧲Scalpers, take note 👀 : only scalp on the Long side. If you have a lot of money, you can go straight away; if not, you can join swing traders and carry out the robbery plan. Use trailing SL to safeguard your money 💰.
🍀🍃SOYBEAN🍃🍀 Commodities CFD Money Heist Plan is currently experiencing a bullishness,., driven by several key factors. .☝☝☝
📰🗞️Get & Read the Fundamental, Macro, COT Report, Inventory and Storage Analysis, Seasonal Factors, Sentimental Outlook, Intermarket Analysis, Future trend targets and Overall outlook score..., go ahead to check👉👉👉🔗🔗🌎🌏🗺
⚠️Trading Alert : News Releases and Position Management 📰🗞️🚫🚏
As a reminder, news releases can have a significant impact on market prices and volatility. To minimize potential losses and protect your running positions,
we recommend the following:
Avoid taking new trades during news releases
Use trailing stop-loss orders to protect your running positions and lock in profits
💖Supporting our robbery plan 💥Hit the Boost Button💥 will enable us to effortlessly make and steal money 💰💵. Boost the strength of our robbery team. Every day in this market make money with ease by using the Thief Trading Style.🏆💪🤝❤️🎉🚀
I'll see you soon with another heist plan, so stay tuned 🤑🐱👤🤗🤩

Food Prices Since Liberation Day - Is Up with Tariffs or PausedWhat is happening to the food prices since liberation day.
Soybeans are a benchmark for food prices — not only because China and many of us consume large quantities, but also because the U.S. exports a significant amount to China.
After the Liberation Day announcement on 2nd April, soybean prices initially dropped but quickly rebounded and surged higher.
Even after a successful trade agreement between the U.S. and China — which reduced reciprocal tariffs for 90 days — soybean prices continued to climb.
So why do food prices seem to trend higher, whether tariffs are in place or paused?
Micro Soybean Futures
Ticker: MZS
Minimum fluctuation:
0.0050 per bushel = $2.50
Disclaimer:
• What presented here is not a recommendation, please consult your licensed broker.
• Our mission is to create lateral thinking skills for every investor and trader, knowing when to take a calculated risk with market uncertainty and a bolder risk when opportunity arises.
CME Real-time Market Data help identify trading set-ups in real-time and express my market views. If you have futures in your trading portfolio, you can check out on CME Group data plans available that suit your trading needs www.tradingview.com
Trading the Micro: www.cmegroup.com

SOYBEAN - wyckoff accumulation3 Monthly turnaround on wyckoff accumulation
also a monthly reversal
On week timeframe it also looks like a reversal. the price is pushing the upper boundary of the sideways.

"SOYBEAN" Commodities CFD Market Bearish Heist (Swing/Day Trade)🌟Hi! Hola! Ola! Bonjour! Hallo! Marhaba!🌟
Dear Money Makers & Robbers, 🤑 💰💸✈️
Based on 🔥Thief Trading style technical and fundamental analysis🔥, here is our master plan to heist the 🥔🍀🍃SOYBEAN🍃🥔🍀 Commodities CFD Market. Please adhere to the strategy I've outlined in the chart, which emphasizes long entry. Our aim is to escape near the high-risk MA Zone. Risky level, overbought market, consolidation, trend reversal, trap at the level where traders and bearish robbers are stronger. 🏆💸"Take profit and treat yourself, traders. You deserve it!💪🏆🎉
Entry 📈 : "The vault is wide open! Swipe the Bullish loot at any price - the heist is on!
however I advise to Place buy limit orders within a 15 or 30 minute timeframe nearest or swing low or high level for pullback entries.
Stop Loss 🛑:
📍 Thief SL placed at the recent/swing low level Using the 30mins timeframe (1015) Day trade basis.
📍 SL is based on your risk of the trade, lot size and how many multiple orders you have to take.
🏴☠️Target 🎯: 1060 (or) Escape Before the Target
🧲Scalpers, take note 👀 : only scalp on the Long side. If you have a lot of money, you can go straight away; if not, you can join Day traders and carry out the robbery plan. Use trailing SL to safeguard your money 💰.
🥔🍀🍃"SOYBEAN"🍃🥔🍀Commodities CFD Market Heist Plan (Swing/Day) is currently experiencing a bullishness,., driven by several key factors.☝☝☝
📰🗞️Get & Read the Fundamental, Macro, COT Report, Inventory and Storage Analysis, Seasonal Factors, Sentimental Outlook, Intermarket Analysis, Future trend targets and Overall outlook score..., go ahead to check 👉👉👉🔗🔗
⚠️Trading Alert : News Releases and Position Management 📰 🗞️ 🚫🚏
As a reminder, news releases can have a significant impact on market prices and volatility. To minimize potential losses and protect your running positions,
we recommend the following:
Avoid taking new trades during news releases
Use trailing stop-loss orders to protect your running positions and lock in profits
💖Supporting our robbery plan 💥Hit the Boost Button💥 will enable us to effortlessly make and steal money 💰💵. Boost the strength of our robbery team. Every day in this market make money with ease by using the Thief Trading Style.🏆💪🤝❤️🎉🚀
I'll see you soon with another heist plan, so stay tuned 🤑🐱👤🤗🤩

"SoyBeans" Commodities CFD Market Robbery Plan (Swing Trade)🌟Hi! Hola! Ola! Bonjour! Hallo! Marhaba!🌟
Dear Money Makers & Robbers, 🤑💰✈️
Based on 🔥Thief Trading style technical and fundamental analysis🔥, here is our master plan to heist the "SoyBeans" Commodities CFD Market. Please adhere to the strategy I've outlined in the chart, which emphasizes short entry. Our aim is the high-risk Green Zone. Risky level, oversold market, consolidation, trend reversal, trap at the level where traders and bullish robbers are stronger. 🏆💸Book Profits Be wealthy and safe trade.💪🏆🎉
Entry 📈 : "The heist is on! Wait for the breakout (975.0) then make your move - Bearish profits await!"
however I advise placing Sell Stop Orders below the breakout MA or Place Sell limit orders within a 15 or 30 minute timeframe. Entry from the most recent or closest low or high level should be in retest. I Highly recommended you to put alert in your chart.
📌I strongly advise you to set an "alert (Alarm)" on your chart so you can see when the breakout entry occurs.
Stop Loss 🛑: Thief SL placed at (1015.0) Swing Trade Basis Using the 4H period, the recent / swing high or low level.
SL is based on your risk of the trade, lot size and how many multiple orders you have to take.
Target 🎯: 935.0 (or) Escape Before the Target
🧲Scalpers, take note 👀 : only scalp on the Short side. If you have a lot of money, you can go straight away; if not, you can join swing traders and carry out the robbery plan. Use trailing SL to safeguard your money 💰.
🥔🍀🍃"SoyBeans" Commodities CFD Market Heist Plan is currently experiencing a bearishness,., driven by several key factors.
📰🗞️Get & Read the Fundamental, Macro, COT Report, Inventory and Storage Analysis, Seasonal Factors, Sentimental Outlook, Intermarket Analysis, Future trend targets.. go ahead to check 👉👉👉🔗
⚠️Trading Alert : News Releases and Position Management 📰 🗞️ 🚫🚏
As a reminder, news releases can have a significant impact on market prices and volatility. To minimize potential losses and protect your running positions,
we recommend the following:
Avoid taking new trades during news releases
Use trailing stop-loss orders to protect your running positions and lock in profits
💖Supporting our robbery plan 💥Hit the Boost Button💥 will enable us to effortlessly make and steal money 💰💵. Boost the strength of our robbery team. Every day in this market make money with ease by using the Thief Trading Style.🏆💪🤝❤️🎉🚀
I'll see you soon with another heist plan, so stay tuned 🤑🐱👤🤗🤩

"SOYBEAN" Commodities Market Bullish Heist Plan🌟Hi! Hola! Ola! Bonjour! Hallo! Marhaba!🌟
Dear Money Makers & Thieves, 🤑 💰🐱👤🐱🏍
Based on 🔥Thief Trading style technical and fundamental analysis🔥, here is our master plan to heist the "SOYBEAN" Commodities Market market. Please adhere to the strategy I've outlined in the chart, which emphasizes long entry. Our aim is the high-risk Red Zone. Risky level, overbought market, consolidation, trend reversal, trap at the level where traders and bearish robbers are stronger. 🏆💸Book Profits wealthy and safe trade.💪🏆🎉
Entry 📈 : "The heist is on! Wait for the MA breakout (1045.00) then make your move - Bullish profits await!"
however I advise placing Place Buy limit orders within a 15 or 30 minute timeframe. Entry from the most recent or closest low or high level should be in retest.
Stop Loss 🛑:
Thief SL placed at the recent / nearest low level Using the 2H timeframe (1020.00) swing trade basis.
SL is based on your risk of the trade, lot size and how many multiple orders you have to take.
Target 🎯:
1st Target - 1083.00 (or) Escape Before the Target
Final Target - 1130.00 (or) Escape Before the Target
🧲Scalpers, take note 👀 : only scalp on the Long side. If you have a lot of money, you can go straight away; if not, you can join swing traders and carry out the robbery plan. Use trailing SL to safeguard your money 💰.
📰🗞️Fundamental, Macro, COT, Sentimental Outlook:
🌾"SOYBEAN" Commodities Market is currently experiencing a bullish trend,., driven by several key factors.
Market Overview
Current Price: 1036.00
30-Day High: 1080.00
30-Day Low: 980.00
30-Day Average: 1000.00
Previous Close Price: 1020.00
Change: 16.00
Percent Change: 1.57%
🍀Fundamental Analysis
Supply and Demand: Global soybean demand is expected to increase, driven by growing demand for soybean oil and meal.
Weather Trends: Weather conditions in major soybean-producing countries are expected to be favorable, potentially leading to increased production.
Inventory Levels: Global soybean inventory levels are expected to decrease, driven by growing demand and limited supply.
Trade Trends: Global soybean trade is expected to increase, driven by growing demand for soybean products.
🍀Macro Economics
Global Economic Trends: The ongoing global economic recovery is expected to drive up demand for soybeans, driven by increasing investor confidence.
Inflation Rate: Global inflation is expected to rise to 3.8% in 2025, potentially increasing demand for soybeans as a hedge against inflation.
Interest Rates: Central banks are expected to maintain low interest rates in 2025, potentially increasing demand for soybeans.
Commodity Prices: Commodity prices are expected to rise by 5% in 2025, driven by increasing demand for raw materials.
🍀COT Data
Non-Commercial Traders (Institutional):
Net Long Positions: 60%
Open Interest: 150,000 contracts
Commercial Traders (Companies):
Net Short Positions: 30%
Open Interest: 80,000 contracts
Non-Reportable Traders (Small Traders):
Net Long Positions: 10%
Open Interest: 20,000 contracts
COT Ratio: 2.0 (indicating a bullish trend)
🍀Sentimental Outlook
Institutional Sentiment: 65% bullish, 35% bearish
Retail Sentiment: 60% bullish, 40% bearish
Market Mood: The overall market mood is bullish, with a sentiment score of +50.
🍀Next Move Prediction
Bullish Move: Potential upside to 1120.00-1150.00.
Target: 1150.00 (primary target), 1200.00 (secondary target)
Next Swing Target: 1250.00 (potential swing high)
Stop Loss: 980.00 (below the 30-day low)
Risk-Reward Ratio: 1:2 (potential profit of 114.00 vs potential loss of 57.00)
🍀Overall Outlook
The overall outlook for SOYBEAN is bullish, driven by a combination of fundamental, technical, and sentimental factors. The expected increase in global soybean demand, favorable weather trends, and bullish market sentiment are all supporting the bullish trend. However, investors should remain cautious of potential downside risks, including changes in global economic trends and unexpected weather events.
⚠️Trading Alert : News Releases and Position Management 📰 🗞️ 🚫🚏
As a reminder, news releases can have a significant impact on market prices and volatility. To minimize potential losses and protect your running positions,
we recommend the following:
Avoid taking new trades during news releases
Use trailing stop-loss orders to protect your running positions and lock in profits
📌Please note that this is a general analysis and not personalized investment advice. It's essential to consider your own risk tolerance and market analysis before making any investment decisions.
📌Keep in mind that these factors can change rapidly, and it's essential to stay up-to-date with market developments and adjust your analysis accordingly.
💖Supporting our robbery plan will enable us to effortlessly make and steal money 💰💵 Tell your friends, Colleagues and family to follow, like, and share. Boost the strength of our robbery team. Every day in this market make money with ease by using the Thief Trading Style.🏆💪🤝❤️🎉🚀
I'll see you soon with another heist plan, so stay tuned 🤑🐱👤🤗🤩

Inflation Leading Indicator Data with Agricultural Commodities Inflation leading indicator data is not derived solely from CPI numbers; more importantly, we must consider what drives these CPI numbers. By understanding this, we can stay ahead of the mass market.
Looking at past trends, we can observe that CPI numbers and agricultural commodities tend to move in tandem.
In this discussion, we will explore why agricultural commodities are an effective tool for projecting inflation direction and examine where these commodities may be heading.
Micro Agriculture Futures:
. Corn: MZC
. Wheat: MZW
. Soybean: MZS
. Soybean Oil: MZL
. Soybean Meal: MZM
Disclaimer:
• What presented here is not a recommendation, please consult your licensed broker.
• Our mission is to create lateral thinking skills for every investor and trader, knowing when to take a calculated risk with market uncertainty and a bolder risk when opportunity arises.
CME Real-time Market Data help identify trading set-ups in real-time and express my market views. If you have futures in your trading portfolio, you can check out on CME Group data plans available that suit your trading needs www.tradingview.com
Trading the Micro: www.cmegroup.com

Obvious Long on Soybeans Soybeans have been consolidating for some time between the yellow and red trend lines after finding support just above the 1500 week ma. Corn has led the market with downward action and now leads it with upward trajectory. Soy's have finally broken out of the RSI downtrend they've been in for almost 4 years. It seems obvious that Soybeans will follow corn and move to the green line at the very least. The stochastic RSI on the monthly has had a confirmed cross up signaling bu8llish momentum in the next several months. For reference corn had a confirmed cross up last fall. The price I'm expecting is 12.5 a 15-17% gain from todays prices. If corn can keep moving higher the next target for soybeans is 14ish. I will start booking my soybeans for the 2025 season if we can get a 10-15% gain from here.
I'm a farmer from Canada and have been studying charts for about 8 years now. i started implementing my TA into commodity futures a few years ago.
Thanks for reading

What If I Told You... Soybeans Are Ripe for a Short? | COT StratFollow Me Down the Rabbit Hole: The Soybeans Market Setup for Shorts
What if I told you... the soybean market is on the verge of a paradigm shift? That the signals are all around you, hidden in plain sight, waiting for those who can read the code. The Commitment of Traders (COT) data is flashing red, and the truth is undeniable: the smart money is preparing for a downturn.
Take the red pill, and let’s decode why the path of least resistance points down.
The COT Index: A Matrix of Sell Signals
The COT Index is the Oracle, revealing the intentions of the market’s architects. Commercial traders – the ones who truly understand the construct – have loaded up on shorts at levels even more bearish than May. And they’re doing it at lower prices.
This isn’t just resistance to the rally. It’s a calculated move. A whisper in the system that the rally is but an illusion, built on a fragile code.
Overvalued in the Grand Simulation
When you step back and compare soybeans to the benchmarks of reality – gold, Treasuries, and the almighty DXY – their overvaluation becomes clear. The system’s balance demands equilibrium, and soybeans are poised to correct.
Sentiment: The False Prophet
The Advisor Sentiment Index reveals an uncomfortable truth: the herd is ecstatic. But as you’ve learned, the crowd rarely escapes the Matrix unscathed. Bullish sentiment at these extremes is a trap, and the smart money is already fading this illusion of strength.
Spread Divergence: Cracks in the Code
The spread divergence between the front-month and the next-month contracts is a glitch in the system. Short-term excitement isn’t aligning with the longer-term structure. When spreads diverge like this, it’s a signal: the construct is destabilizing.
Distribution: The Hidden Hand
The POIV (Price-Open Interest Volume) divergence reveals a pattern of distribution. The architects of the market are selling into the rally, while the unwitting masses continue to buy. The code doesn’t lie. This is the calm before the storm.
The Technical Trinity: %R, Stochastic, and Oscillator
Three powerful indicators align, pointing to an impending shift:
%R Indicator: Overbought and ready to turn.
Stochastic Oscillator: Rolling over, signaling exhaustion.
Ultimate Oscillator: Confirming the downward momentum.
Combine this with the down-sloping 52-day SMA, and the dominant trend reveals itself: the Matrix is designed to move lower.
Patience: The Key to the System
This isn’t a call to blindly short. No one escapes the system without discipline. Wait for the daily chart to confirm the trend change. Only then can you move with precision, ensuring that every move aligns with the code.
The Choice Is Yours
The soybean market is more than what it seems. The smart money, the sentiment extremes, the divergences – they all point to a single truth: this rally is an illusion. But as always, the choice is yours.
Will you take the blue pill and believe what you want to believe? Or take the red pill, follow me, and see how deep the COT hole really goes? The trend is your ally – until it isn’t. And this one is collapsing before your eyes.
Stay tuned, stay sharp, and remember: the Matrix rewards those who see beyond the veil.
Acknowledgment
The strategies and concepts taught in this class draw significant inspiration from the works and teachings of Larry Williams, a pioneer in trading and market analysis. His groundbreaking research and methodologies have shaped the foundation of modern trading education.
While this class incorporates Larry Williams’ principles, the content has been adapted and presented to reflect my own understanding and application of these ideas. Full credit is given to Larry Williams for his original contributions to the field of trading.
Disclaimer
The information provided in this content is for educational and informational purposes only and should not be construed as financial advice, investment recommendations, or an offer to buy or sell any securities or financial instruments.
Trading financial markets involves significant risk, including the potential loss of capital. Past performance is not indicative of future results. You are solely responsible for your trading decisions and should conduct your own research or consult with a licensed financial advisor before making any financial decisions.
The creator of this content assumes no liability for any losses or damages resulting from reliance on the information provided. By engaging with this content, you acknowledge and accept these risks.

SOYBEAN CFD Commodity Market Bullish Heist Plan🌟Hi! Hola! Ola! Bonjour! Hallo!🌟
Dear Money Makers & Robbers, 🤑 💰
Based on 🔥Thief Trading style technical and fundamental analysis🔥, here is our master plan to heist the SOYBEAN CFD Commodity market. Please adhere to the strategy I've outlined in the chart, which emphasizes long entry. Our aim is the high-risk Red Zone. Risky level, overbought market, consolidation, trend reversal, trap at the level where traders and bearish robbers are stronger. Be wealthy and safe trade.💪🏆🎉
Entry 📈 : Traders & Thieves with New Entry A bull trade can be initiated on the MA level breakout of 1050.00.
however I advise placing Buy limit orders within a 15 or 30 minute timeframe. Entry from the most recent or closest low or high level should be in retest.
Stop Loss 🛑: Using the 4H period, the recent / nearest low or high level.
Target 🎯: 1130.00 (or) Escape Before the Target
Scalpers, take note 👀 : only scalp on the Long side. If you have a lot of money, you can go straight away; if not, you can join swing traders and carry out the robbery plan. Use trailing SL to safeguard your money 💰.
Warning⚠️ : Our heist strategy is incompatible with Fundamental Analysis news 📰 🗞️. We'll wreck our plan by smashing the Stop Loss 🚫🚏. Avoid entering the market right after the news release.
Fundamental Outlook 📰🗞️
The SOYBEAN CFD is expected to move in a bullish direction.
REASONS FOR BULLISH TREND:
Weather Conditions: The weather conditions in the US and Brazil, the two largest soybean-producing countries, are expected to be favorable for soybean production. This will lead to a potential increase in supply, which will put upward pressure on prices.
Demand from China: China, the largest importer of soybeans, is expected to increase its imports of soybeans due to a shortage of domestic supply. This will lead to an increase in demand for soybeans, which will drive up prices.
US-China Trade Deal: The US and China have signed a trade deal, which includes an agreement to increase Chinese purchases of US agricultural products, including soybeans. This will lead to an increase in demand for soybeans, which will drive up prices.
Low Inventory Levels: The inventory levels of soybeans in the US are currently low, which will lead to an increase in prices as demand increases. When inventory levels are low, suppliers are less likely to offer discounts, and buyers are more likely to pay a premium to secure supplies.
Strong Export Demand: The export demand for soybeans is expected to remain strong, driven by demand from countries such as China, Mexico, and Japan. This will lead to an increase in demand for soybeans, which will drive up prices.
Production Costs: The production costs for soybeans are expected to increase due to higher costs for inputs such as seeds, fertilizers, and pesticides. This will lead to an increase in the cost of production, which will be passed on to consumers in the form of higher prices.
Government Policies: The US government has implemented policies to support soybean farmers, such as subsidies and tariffs. These policies will help to increase the profitability of soybean farming, which will lead to an increase in production and higher prices.
Market Sentiment: The market sentiment for soybeans is currently bullish, with many traders and investors expecting prices to rise. This will lead to an increase in demand for soybeans, which will drive up prices.
Technical Analysis: The technical analysis for soybeans is currently bullish, with the price trading above its 50-day and 200-day moving averages. This indicates that the trend is upward, and prices are likely to continue to rise.
Seasonal Trends: The seasonal trends for soybeans are currently bullish, with prices typically rising during the summer months due to strong demand from countries such as China and Mexico.
These fundamental points suggest that the SOYBEAN CFD is likely to move in a bullish direction, with prices expected to rise due to strong demand, low inventory levels, and favorable weather conditions.
Please note that this is a general analysis and not personalized investment advice. It's essential to consider your own risk tolerance and market analysis before making any investment decisions.
Keep in mind that these factors can change rapidly, and it's essential to stay up-to-date with market developments and adjust your analysis accordingly.
💖Supporting our robbery plan will enable us to effortlessly make and steal money 💰💵 Tell your friends, Colleagues and family to follow, like, and share. Boost the strength of our robbery team. Every day in this market make money with ease by using the Thief Trading Style.🏆💪🤝❤️🎉🚀
I'll see you soon with another heist plan, so stay tuned 🫂

SOYBEAN CFD Market Money Heist Plan on Bullish SideHallo! My Dear Robbers / Money Makers & Losers, 🤑 💰
This is our master plan to Heist SOYBEAN CFD Market based on Thief Trading style Technical Analysis.. kindly please follow the plan I have mentioned in the chart focus on Long entry. Our target is Red Zone that is High risk Dangerous level, market is overbought / Consolidation / Trend Reversal / Trap at the level Bearish Robbers / Traders gain the strength. Be safe and be careful and Be rich.
Entry 📈 : Can be taken Anywhere, What I suggest you to Place Buy Limit Orders in 15mins Timeframe Recent / Nearest Swing Low Point.
Stop Loss 🛑 : Recent Swing Low using 2h timeframe.
Attention for Scalpers : If you've got a lot of money you can get out right away otherwise you can join with a swing trade robbers and continue the heist plan, Use Trailing SL to protect our money 💰.
Warning : Fundamental Analysis news 📰 🗞️ comes against our robbery plan. our plan will be ruined smash the Stop Loss 🚫🚏. Don't Enter the market at the news update.
Loot and escape on the target 🎯 Swing Traders Plz Book the partial sum of money and wait for next breakout of dynamic level / Order block, Once it is cleared we can continue our heist plan to next new target.
Support our Robbery plan we can easily make money & take money 💰💵 Follow, Like & Share with your friends and Lovers. Make our Robbery Team Very Strong Join Ur hands with US. Loot Everything in this market everyday make money easily with Thief Trading Style.
Stay tuned with me and see you again with another Heist Plan..... 🫂

What Hidden Forces Are Reshaping the Soybean Market’s Future?The soybean market stands at a crossroads, where familiar patterns of supply and demand are being challenged by a web of global forces. U.S. crops, though abundant, face domestic difficulties as adverse weather threatens yield projections. South America, poised to increase production, is battling its climate concerns, leaving traders and analysts questioning what the true state of global supply will be. Despite the current pessimistic outlook, is there more to this story than meets the eye?
On the demand side, the rising global appetite for vegetable oils, fueled by population growth and the biofuel industry, adds another layer of complexity. Yet, regulatory changes like the EU’s deforestation rules and China’s ongoing economic struggles continue to shape the trade landscape. How will these evolving dynamics impact global soybean trade flows, and what are the risks and opportunities hidden within?
As technological advancements in biotechnology and precision agriculture push the boundaries of efficiency and productivity, the soybean market finds itself on the cusp of transformation. Investors and traders must decipher this intricate puzzle, where geopolitical shifts, weather risks, and innovation collide. Will those who grasp the nuances of these forces be the ones to seize the emerging opportunities?

SOYBEANS - Are We Close to a Major Bottom? Cycles Say YES.Here is what I am currently watching for SOYBEANS.
-We need to be aware that there is a major bullish divergence setup (not trigger) developing on the quarterly & monthly charts. We need to pay close attention to this setup, because if triggered/confirmed, it implies a massive move up for Soybeans would be on the horizon.
-Interestingly, the Weekly chart has confirmed bullish divergence. The first target (1090) has not yet been hit, but in my opinion, it looks probable that Soybeans will hit that target (and possibly go as high as the second target (1179). This implies that I believe Soybeans is likely to rally at least 5% in the near future, and possibly rally as much as 10% from current price levels.
-I will be aggressive with taking profits on any short setups that present, due to the bullish weekly divergence that has triggered.
-Utilizing the Weekly MAC & Valuation methods, I note that this market is in an area where we can look for H6/Daily short trades. As mentioned in previous paragraph, I will utilize more aggressive targets.
-The cycles for Soybeans...wow, they are quite something. Decennial cycle suggests significant low being put in, APZ's suggest major low around October 4th, major 5 year cyclical low RIGHT NOW. Other temporary and permanent blended cycles suggest a major low right now. Composite of the 3 most similar years of price action also suggest a major low could happen soon, with a major rally to March 2025.
-A combination of the cycles and the major timeframe bullish divergences have me leaning somewhat towards calling a possible major bottom in the Soybeans market. I would prefer to see commercials COT positioning support this idea, which makes me think maybe we get another nice selloff into the August lows before the real bottom is in. But time will tell.

Is Your Summer BBQ in Jeopardy?The seemingly innocuous drought in Brazil could have far-reaching consequences for global food supply chains. As the world's largest soybean exporter, Brazil's weather patterns significantly influence the availability and affordability of various food products.
The delayed planting of soybean crops due to dry conditions in Brazil is raising concerns about potential shortages and price hikes. This could have a ripple effect on the production of meat, poultry, and other food items that rely on soybeans as a key ingredient.
Beyond the immediate impact on soybean prices, the drought could also have broader implications:
Increased Food Costs: The shortage of soybeans could lead to higher prices for animal feed, ultimately affecting the cost of meat and poultry.
Disruptions in Food Processing: Industries that rely heavily on soybeans, such as food processing and biofuel production, may face disruptions due to limited supply.
Global Economic Impacts: The drought could have economic consequences beyond the food sector, affecting trade, transportation, and employment in related industries.
The question now is: How will the global food system adapt to this challenge?
As the world grapples with the implications of Brazil's drought, it is crucial to explore sustainable solutions and strategies to mitigate the potential impacts on food security and economic stability.

Smart Money Positioned to LONG Soybeans - COT StrategyDISCLAIMER: This is not trade advice. This is for educational purposes only to demonstrate how I am looking to participate in this market. There is significant risk involved in trading, do your own homework and due diligence.
COT Strategy
LONG
Soybeans (ZS)
My COT strategy has me on alert for long trades in ZS if we get a confirmed bullish change of trend on the Daily timeframe. I note that I am already long as this market has been giving a buy signal for a few weeks.
COT Commercial Index: Buy Signal
Extreme Positioning: Commercials hovering around max long of last 3 years - bullish.
OI Analysis: "Bubble Up" in net positioning between commercials and large specs - bullish. Multi week down move has seen OI increase. When OI increases, we need to ask "who caused the increase in OI". When the OI increase is caused by Commercials adding to longs, it is bullish.
True Seasonal: Major seasonal low end of September and up to February.
COT Small Spec Index: Buy Signal
Supplementary Indicators: Acc/Dist, %R, UO, Stochastic & Confirmed Momentum Shift.
Remember, this is not a "Long Now" idea. These indicators are not timing tools. They simply tell us that this market could have a move of some significance to the upside, which we will participate in with a confirmed Daily trend change to the upside.
Good luck & good trading.

Upside Ahead for Soybeans - COT Strategy LongDISCLAIMER: This is not trade advice. This is for educational purposes only to demonstrate how I am looking to participate in this market. There is significant risk involved in trading, do your own homework and due diligence.
COT Strategy
Long
Soybeans (ZS)
I got long Soybeans last week. This week we see the COT strategy still giving us signals to be on alert for long trades in ZS if we get bullish signals on the Daily timeframe.
COT Commercial Index: Buy Signal
Extreme Positioning: Commercials close to the longest they have been in the last 3 years.
Valuation: Undervalued VS Gold
ADX: Paunch forming (but not confirmed yet)
Supplementary Indicators: %R & Stochastic Buy Signals
Remember, this is not a "Buy Now" idea. These indicators are not timing tools. They simply tell us that this market could have a move of some significance to the upside, which we will participate in with a confirmed Daily trend change to the upside.
Good luck & good trading.

A Trade as Simple as "Shooting Ducks in A Barrel" Soybean ShortIf you follow my channel, you know I love to trade a strategy that I like to call "Ducks in a Barrel". Its a strategy that is as easy as shooting ducks in a barrel.
We have a setup forming on the Daily timeframe for the Soybeans market.
Step 1: Identify trend (I like to see the 52 & 39 period SMA's sloping strongly and pulling away from each other). In the case of Soybeans, we see a strong bearish trend.
Step 2: In a down trending market, we want to see an asset become OVERVALUED VS GOLD & US TREASURIES. We see with Soybeans, we are now overvalued on the Daily timeframe vs gold & treasuries. Assets that are overvalued in a strong downtrend are assets that we want to SELL.
Step 3: In a down trending market, we want to see an asset become OVERBOUGHT. We see on the Daily stochastic that Soybeans are overbought. Assets that are overbought in a strong downtrend are assets that we want to SELL.
Step 4: In a down trending market, we want to see advisor SENTIMENT become BULLISH. The advisors and general public are usually wrong, so when they become overly bullish in a strong down trend, we want to sell into that bullish sentiment.
Step 5: We can also look at accumulation/distribution indicators and momentum for further confirmation of our idea. But realistically, we just need to see 2 or more of the above indicators confluent with each other to have a setup market.
Step 6: For the Daily timeframe, I utilize the H4 chart for my entry. The safest entry is to wait for 2 full range days to form beneath the 18 period SMA, and from there market enter when the lowest low of these 2 candles is hit. There are other entry techniques to get into the market earlier, but they come with greater risk.
NOTE: If you follow my channel, you will know that I am long Soybeans based on my COT strategy. Commercials are close to the max long positioning of the last 3 years (bullish), OI grinding up on the multi-month down move caused by CM's (bullish), paunch forming (bullish), bearish weekly sentiment (bullish), undervalued on weekly vs gold and treasuries (bullish), major cyclical lows (bullish). I have different accounts for different strategies, as sometimes we get conflicting signals.
If you have any questions about these "ducks in a barrel" trade setups, feel free to give me a message.
As always, I wish you good luck & good trading.

Soy Bean Cash CFD Bullish Side Money Heist PlanHola ola Robbers / Money Makers & Losers,
This is our master plan to Heist SOY BEAN Cash CFD Market based on Thief Trading style Technical Analysis.. kindly please follow the plan I have mentioned in the chart focus on Long entry. Our target is Red Zone that is High risk Dangerous level, market is overbought / Consolidation / Trend Reversal at the level Bearish Robbers / Traders gain the strength. Be safe and be careful and Be rich.
Note: If you've got a lot of money you can get out right away otherwise you can join with a swing trade robbers and continue the heist plan, Use Trailing SL to protect our money.
Entry : Can be taken Anywhere, What I suggest you to Place Buy Limit Orders in 15mins Timeframe Recent / Nearest Swing Low
Stop Loss : Recent Swing Low using 2h timeframe
Warning : Fundamental Analysis comes against our robbery plan. our plan will be ruined smash the Stop Loss. Don't Enter the market at the news update.
Loot and escape on the target 🎯 Swing Traders Plz Book the partial sum of money and wait for next breakout of dynamic level / Order block, Once it is cleared we can continue our heist plan to next new target.

Momentum Trading In Agricultural CommoditiesMomentum trading, a strategy as old as the markets themselves, has found fertile ground in the sprawling fields of agricultural commodities.
As the seasons change, so do the prices of wheat, corn, soybeans, and other staples, tracing patterns as predictable as the migration of birds or the spring blossom.
This paper delves into these seasonal trends, uncovering how they can serve as reliable signals for astute investors looking to harness the power of momentum trading.
SEASONAL TRENDS IN AGRICULTURAL COMMODITIES
Mint Finance has previously highlighted some of these seasonal trends in Corn and Soybean in detail previously
In short, seasonal cycles in crop performance are linked to crop harvest cycles. Pre-harvest, inventory drawdowns tend to drive price higher while post-harvest, a glut of inventory tends to drive prices lower.
Corn
Corn prices start declining in June following the harvest in China (second largest corn producer) and Brazil (third largest corn producer). Prices reach their lowest in October, coinciding with the harvest in the US.
Over the past five years, corn prices have increased in the first half of the year before declining sharply in late June. In 2024, indexed price performance shows prices sharply lagging the seasonal trend as we approach the date on which prices generally declined the last five years.
Wheat
Wheat seasonality is less pronounced than other agri-commodities due to its relatively global distribution. Still, wheat prices generally rise during the first part of the year before declining in late June as all the major producers - China, Indian, EU, Russia, and US harvest crops during this period.
This year, wheat prices started the year off on a bearish note. After bottoming in early-March, prices started to rise sharply peaking in late-May. Mint Finance covered some of the factors behind this rally in a previous paper (Extreme Weather Sends Wheat Prices Surging). Prices have started to normalize in June, a few weeks before the seasonal price decline generally begins.
Soybean
Soybean prices generally rise during the first part of the year. In late-June, as the Brazil harvest reaches its peak, prices decline sharply. Prices remain subdued until September when the US crop is harvested.
This year, prices have sharply lagged their seasonal performance. Despite the rally in early-May driven by flooding in Brazil, prices remain lower than their level at the start of 2024. Moreover, the rally following the flood-driven rally has retraced a few weeks before the seasonal price decline generally takes place.
MOMENTUM TRADING IN AGRICULUTAL COMMODITIES
Investors can execute momentum trading strategies by leveraging these seasonal trends. In this context, momentum trading strategy refers to a relatively simple trading strategy where investors either buy or sell a futures contract at the start of the month based on the seasonal price performance during that month.
For instance, if seasonal trends show that June generally results in a price decline, the strategy would consist of going short on the commodity at the start of June and closing the position at the end of the month.
Although, at face value, this strategy may seem overly simplistic, its return and accuracy are surprisingly high.
The simulations are based on a position in the front-month futures, consisting of one contract of the agricultural commodity, opened at the beginning of the month and closed at the end.
Corn
For Corn, running the momentum trading strategy would have yielded average annual returns of USD 8,500 per year over the past five years (2019-2023). Crucially, performance of this strategy in 2024 is sharply lower as it would yield total PnL of just USD 63 this year.
Wheat
Similarly, for wheat, this strategy returned an average PnL of 4,650 per year during 2019-2023. So far in 2024, this strategy would have yielded USD 6,600 in wheat futures in 2024.
Soybean
In Soybean futures, momentum trading would have been the most successful over the past five years. This strategy would have yielded an average of USD 13,600 per year between 2019 and 2023. However, in 2024, this strategy would not have been successful as it would have resulted in a loss of USD 8,700 so far.
SUMMARY AND 2024 PERFORMANCE
It is clear that although this strategy is successful on a long timeframe, it is not necessarily profitable each month. For instance, the Soybean momentum trading strategy would have resulted in a loss in 2024 while Corn momentum trading strategy would have resulted in flat returns.
The reason behind this divergence from seasonal trend is clear when comparing the seasonal price performance charts at the start of the paper. Fundamental factors can result in broad-based trends throughout the year which can skew returns. For instance, as Soybean prices have been declining for most of 2024, a long position would have resulted in a loss regardless of seasonal trends.
As such, it is crucial to supplement this strategy using fundamental inputs on what the long-term price trend for the crop is. For a crop which is in a down-cycle, a long position would not make sense and vice versa.
In the near-term, all three crop’s prices tend to decline during July based on seasonal trends. However, the outlook for corn is most bearish. The latest WASDE report , suggested that USDA expects global corn production in marketing year 2024-2025 to reach 1,220.5 million metric tons compared to a forecast of 1,219.93 million MT last month. The increase in production comes from forecast for higher output from Ukraine and Zambia more than offsetting the decline in Russia.
Moreover, USDA forecasts a season average price of USD 4.4 per bushel which is lower than the current futures price of USD 4.57. Asset managers are also shifting their view on corn prices bearish once again as COT report showed asset managers increasing net short positioning last week.
Both fundamental and seasonal factors support a price decline in corn over the next month. However, seasonal trends are not exact. Particularly in 2024, seasonal trends have underperformed their usual returns from the last five years.
Investors can opt to use options instead of futures to express the same view of weakening prices. Options provide fixed downside risk and require only an upfront premium, avoiding the need to manage margins as futures prices fluctuate.
A long put position in CME corn options expiring on August 23 (ZCU24) can be used to gain downside exposure.
CME Corn puts are relatively cheaper compared to calls. Moreover, options IV (measured by the CVOL index) is lower compared to the peaks seen during the same time last year. An options position would benefit from both falling prices and rising IV.
Source: CVOL
A long put options position on corn futures presents fixed downside of USD 464 (USc 9.29 x 5000/100) and unlimited upside. A strike price of USc 430/bushel represents delta of -0.29. This position would break-even at USc 420/bushel.
MARKET DATA
CME Real-time Market Data helps identify trading set-ups and express market views better. If you have futures in your trading portfolio, you can check out on CME Group data plans available that suit your trading needs www.tradingview.com
DISCLAIMER
This case study is for educational purposes only and does not constitute investment recommendations or advice. Nor are they used to promote any specific products, or services.
Trading or investment ideas cited here are for illustration only, as an integral part of a case study to demonstrate the fundamental concepts in risk management or trading under the market scenarios being discussed. Please read the FULL DISCLAIMER the link to which is provided in our profile description.
