Inflation & Agricultural Prices - On the Rise Again Inflation is expected to rise again because the prices of staples such as wheat, rice, corn, and soybean meal have been increasing over the last two months. Additionally, we've seen a 20% increase in soybean meal prices since the low in February.
Chicago SRW Wheat Futures & Options
Ticker: ZW
Minimum fluctuation:
1/4 of one cent (0.0025) per bushel = $12.50
Soybean Meal Futures & Options
Ticker: ZM
Minimum fluctuation:
0.10 per short ton = $10.00
Disclaimer:
• What presented here is not a recommendation, please consult your licensed broker.
• Our mission is to create lateral thinking skills for every investor and trader, knowing when to take a calculated risk with market uncertainty and a bolder risk when opportunity arises.
CME Real-time Market Data help identify trading set-ups in real-time and express my market views. If you have futures in your trading portfolio, you can check out on CME Group data plans available that suit your trading needs www.tradingview.com
Soybean

EU faces pressure to defuse mounting anger as farmers protest aGiven the mounting anger and protests by farmers across Europe, there appears to be a significant challenge stemming from contradictory and potentially detrimental agricultural policies. The grievances include increased costs for agricultural diesel, additional fees for water consumption, complex regulations, and objections to bans on pesticides and herbicides mandated by the EU's Green Deal. The farmers are also concerned about the import of beef from countries like Brazil and Argentina, which they argue have laxer rules on animal welfare, making competition difficult.
This unrest, originating in France but spreading to neighboring countries, signals a broader issue with unpredictable government decisions affecting agriculture. In the Netherlands and Germany, similar protests have arisen over regulations to cut nitrogen emissions and phase out fuel subsidies, respectively. In Germany, there is also resentment over what is perceived as the unfair application of environmental policies.
With protests extending to Poland, Romania, Slovakia, Hungary, and Bulgaria, concerns range from unfair competition from cut-price cereals to high taxes and tight regulations. The impact of droughts, floods, and wildfires, combined with the squeeze from green policies, has fueled discontent.
For investors, this could be a pivotal moment to consider commodities such as cereals, soybeans, and copper. The disruptions in European agriculture may create fluctuations in the market, making these commodities potentially attractive for investment. However, it is crucial to monitor developments closely as tensions continue to grow, and the agricultural sector shapes up to be a major issue in the upcoming European Parliament elections in June.

CBOT SOYBEAN FUTURES is performing perfectly as anticipatedThe CBOT SOYBEAN FUTURES continues performing perfectly as anticipated , After the completion of wave B, the market reversed down to complete the wave C and reached so far 1292.5 down from 1409.5.

CBOT SOYBEAN : We maintain the same outlookThe soybean futures continues performing as anticipated. Wave B in place and the wave C in progress.

A technical overview of Soybean Oil
Since our last analysis of Soybean Oil, the commodity has completed its head and shoulders pattern, now trading at the resistance formed by the previous neckline. Concurrently, we observe an RSI divergence, where the RSI prints lower highs while the prices chart higher highs. This divergence is generally viewed as a bearish indicator, hinting at possible price declines. When paired with decreasing volume, the case for price exhaustion at this juncture becomes more compelling.
The Price & Volume Profile chart serves as another essential tool in pinpointing critical zones. The highlighted POC (‘point of control’) zone represents the price level with the highest frequency of trades. Historically, this has acted as a pivotal support and resistance level for Soybean Oil, demarcating regions of consolidation before prices venture either upwards or downwards. The chart also highlights the volume traded at the different levels as denoted by the volume number at the different price levels. Notably, the current price level showcases a significant volume zone, with the largest volume transacted there.
Looking at the 50 & 200-day moving averages we observe a golden cross which signifies bullishness. But not on the 100 & 200-day moving averages.
On a relative value basis, we can also compare Soybean Oil to its substitute, such as crude palm oil. Here we see 2 defined regimes pre-2021 and post-2021 where the ratio of the two products significantly increased, suggesting that Soybean Oil became relatively pricier than Crude Palm Oil. We have previously delved into this topic in our article “ Fading the Soybean Oil Premium ” where we anticipated a decline in this ratio. Subsequently, this ratio did correct to the 0.06 mark, only to experience a rapid rebound. This surge was attributed to Soybean Oil appreciating at a faster rate than Crude Palm Oil.
Another metric involves contrasting Soybean Oil with its upstream and downstream derivatives: Soybean and Soybean Meal. Once more, we see prices tending to move in tandem until 2021, after which the ratio of Soybean Oil to both Soybean Meal and Soybean underwent a marked shift. With the ratio's support distinctly outlined by pre-2021 resistance, this ratio can be wielded as a metric to identify when Soybean Oil is relatively overpriced compared to its up and downstream products.
In conclusion, a blend of technical indicators seems to point towards more downside for Soybean Oil, such as the RSI divergence and declining volume. Also, prices stuck in the POC have generally preceded breakouts and on a relative value basis, Soybean Oil seems over-extended. We can express this bearish view on soybean oil via a short position on the CME soybean Oil futures at the current level of 63.29, with a stop at 67.50 and take profit at 51.00. Prices are quoted in cents per pound and each $0.0001 increment per pound in the Soybean Oil futures contract is equal to 6.00$.
The charts above were generated using CME’s Real-Time data available on TradingView. Inspirante Trading Solutions is subscribed to both TradingView Premium and CME Real-time Market Data which allows us to identify trading set-ups in real-time and express our market opinions. If you have futures in your trading portfolio, you can check out on CME Group data plans available that suit your trading needs www.tradingview.com
Disclaimer:
The contents in this Idea are intended for information purpose only and do not constitute investment recommendation or advice. Nor are they used to promote any specific products or services. They serve as an integral part of a case study to demonstrate fundamental concepts in risk management under given market scenarios. A full version of the disclaimer is available in our profile description.
Reference:
www.cmegroup.com

Agricultural Commodities: On a Landscape of Market ManipulationThis Fib layout consists of the most important agricultural commodities. Beef, Pork, Soybean, Corn, Wheat, Rice, and Orange Juice Futures.
-Orange Juice is sold as a frozen concentrate which makes it a commodity.
Each Schematic is worked through by Large Institutions on behalf of the Fed.
Market Manipulation through inflation and destroying meat processing plants/Killing livestock shows its effects.

SOYBEAN - IMMINENT SELL OFFSOYBEAN FUTURES - MONTHLY SUPPLY AND DEMAND ANALYSIS
Soybean sold at Monthly Supply Zone -> Destiny: Monthly Demand Zone
I suggest make the following probable trades:
- Sell Soybean until reach Monthly Demand zone
- Buy Soybean from Monthly Demand Zone until Monthly Supply Zone

Heavy Exports Weighing Down SoybeansSoybean is among the world’s most traded crop. It is used in various industries. Soybean drives global food prices. It can tilt trade balances of an entire nation.
This paper describes the importance of Soybean. It lists key producers, consumer and maps the harvesting cycle across the calendar by top producing countries.
Given rising Brazilian exports, higher US planting, and asset manager’s positioning, this paper articulates a case study for a short position in CME Soybeans Futures delivering a 1.3x reward to risk with entry at USc 1,452.5/bushel and target of USc 1,350/bushel hedged by a stop at USc 1,530/bushel.
SOYBEAN IS THE WORLD’S MOST TRADED GRAIN
Soybean is high in protein. Hence, it is a key component of livestock feed for meat & dairy production. Rising consumption of the latter two continues to push Soybeans demand.
Two-thirds of Soybean is used for crushing into oil and meal. Soybean oil is among the most widely used vegetable oils. It is also used as biodiesel.
The two American continents form 80% of global production. Brazil (42%) and the US (31%) are the two largest producers of Soybeans. Argentina is a distant third (7%).
China drives demand. It is the largest importer of Soybeans. It comprises 60% of global imports. Soybeans is
used to feed China’s massive livestock.
Soybean prices are cyclical and prone to price shocks.
HARVESTING CYCLE, WEATHER & TRADE POLICY HUGELY INFLUENCES PRICES
Prices vary through the year. It is lowest at harvest. Increases during the year with rising inventory holding costs.
Harvest seasons are spread differently across North & South America. US harvest is from September to November. While the Brazil & Argentina harvest from March until June.
Not surprisingly, Brazilian and US harvest has an enormous impact on Soybean prices. Actual production deviating from expectations in these two majors can send prices surging or tumbling.
Soybean prices since 2015 is visualised below. Prices have structurally moved up. Prices have surged driven by robust demand since 2020.
Soybean prices on average have ranged 14% from its lowest to the highest over the last eight years with large price gyrations in 2016 and 2020.
Price behaviour during and post-harvest since 2015 is visually described in the heatmap below. All things being equal, Soybean prices trend lower during harvesting followed by price recovery post-harvest.
However, each year presents idiosyncratic conditions related to weather, trade policy, yield and output, causing price fluctuation.
Beyond the harvest cycle, climate has a significant impact. North and South America is heavily affected by El Niño-Southern Oscillation which is a natural climate pattern causing hotter/dryer climate every three to seven years. El- Niño also elevates the chances of droughts and floods.
Demand for Soybean Oil is also impacted by supply and demand of other vegetable oils like Palm Oil due to substitution effect.
Global trade policy has a considerable influence too. Trade restrictions can disrupt global supply-demand balance, resulting in increased volatility.
HIGHER PLANTING IN US, RISING BRAZILIAN EXPORTS, AND FALLING YIELDS IN ARGENTINA
USA : In its recent Market Outlook, the USDA reported that US farmers were planning to plant marginally higher than last year but below market expectations. As per National Oilseed Processors Association (NOPA), soybean crushing spiked to a 15-month high and the second highest level for any month on record in March. The crushing pace jumped as processors bounce back from maintenance related downtime.
Brazil : Soybean exports from Brazil surged 42.5% YoY during the first half of April. Bean prices have trended lower on larger than expected supply.
Argentina : USDA reduced its forecast of Argentina’s soybean crop to twenty-seven million metric tons down from thirty-three million metric tons last month.
Argentina’s soybean yields sunk to historical lows last week as per Buenos Aires Grains Exchange’s (BAGE) weekly report. BAGE warned that its projection, currently at twenty-five million metric tons, could be reduced if yield remains suppressed.
COMMITMENT OF TRADERS REPORT
Two-thirds of soybean crop is crushed into oil and meal. The crush spread, also sometimes referred to as simply the crush, refers to the difference between the value of soybean meal and oil and the price of soybeans. The “crush” is gross processing margin from crushing soybeans.
As such, these three products are deeply intertwined.
Asset managers have reduced net longs in all three contracts since the start of 2023. Intriguingly, asset managers have reduced net longs much more sharply for Oil and Meal relative to Soybeans.
TRADE SET UP
Four key drivers at play. First, rising supply from Brazil. Second, higher planting by US farmers. Third, bearish asset manager positioning. Finally, first three offset by marginal impact of lower yields in Argentina.
In forming a holistic view, this paper posits a short position in CME Soybeans July contract. Each lot provides exposure to 5,000 bushels (~136 tons).
Prices are quoted in U.S. cents per bushel. Minimum price fluctuation (tick) is one-fourth of one-cent. Therefore, every tick represents a change of USD 12.50 per lot.
● Entry: USc 1,452.5
● Target: USc 1,350
● Stop: USc 1,530
● Profit at target: USD 5,125
● Loss at stop: USD 3,875
● Reward-to-risk: 1.3x
MARKET DATA
CME Real-time Market Data helps identify trading set-ups and express market views better. If you have futures in your trading portfolio, you can check out on CME Group data plans available that suit your trading needs www.tradingview.com
DISCLAIMER
This case study is for educational purposes only and does not constitute investment recommendations or advice. Nor are they used to promote any specific products, or services.
Trading or investment ideas cited here are for illustration only, as an integral part of a case study to demonstrate the fundamental concepts in risk management or trading under the market scenarios being discussed. Please read the FULL DISCLAIMER the link to which is provided in our profile description.

It’s Corn!You know the “It’s Corn” song trending on TikTok? It brings a smile to our face every time we hear it. But if you look at Corn’s price chart and fundamental outlook, that’s a whole other story…
Corn’s recent breakout of a symmetrical triangle towards the downside caught our attention. With the clear break and an ensuing retest, Corn is now trading right on previous support levels. We think this might just be a small reprieve in the downward direction it is headed.
Not only that, when you zoom out to a longer timeframe, Corn has just broken its long-term trend support established since 2020.
This combined with the symmetrical triangle break proves to provide a strong bearish case from here. Classical chart pattern analysis points the take-profit range from the triangle pattern, at roughly 292 points away. From the initial point of breakout, 292 points away takes us back to the 360 level which was the average price seen from 2014 to 2020, back to pre-covid and pre-Russian/Ukraine conflict levels.
Additionally, in a or few previous analyses we emphasized how many of the commodities have started to return to ‘normality’ with prices moving back to pre-war levels. We have already seen Wheat and Soybean retracing most of the War rally as prices tumbled, therefore it’s not hard to see Corn do the same soon.
Other supporting fundamental factors include the falling Ethanol prices and in turn, lower usage of corn for Ethanol, resulting in overall supply to increase.
Fertilizer prices have also fallen from all-time highs, with continued downward momentum. Lower fertilizer cost means better margins for the farmers and potentially higher usage of fertilizers in planting, which may result in better crop yield. Both factors work to lower corn price through more competitive pricing from the farmers and increased supply.
Combined, we think the fundamental and technical chart set-up provides a convincing case for Corn to fall lower. We set our stops above the triangle apex and at the previous level of resistance, 688, and our initial take-profit levels at 565 followed by 455, giving us a risk reward of roughly 1.46 and 3.66 from the current level of 637.6. Each 0.0025 point increment in CME Corn Futures is equal to 12.5 USD.
The charts above were generated using CME’s Real-Time data available on TradingView. Inspirante Trading Solutions is subscribed to both TradingView Premium and CME Real-time Market Data which allows us to identify trading set-ups in real-time and express our market opinions. If you have futures in your trading portfolio, you can check out on CME Group data plans available that suit your trading needs www.tradingview.com
Disclaimer:
The contents in this Idea are intended for information purpose only and do not constitute investment recommendation or advice. Nor are they used to promote any specific products or services. They serve as an integral part of a case study to demonstrate fundamental concepts in risk management under given market scenarios. A full version of the disclaimer is available in our profile description.
Reference:
www.cmegroup.com
www.cmegroup.com

Soybean Futures ( ZS1! ), H4 Potential for Bearish DropTitle: Soybean Futures ( ZS1! ), H4 Potential for Bearish Drop
Type: Bearish Drop
Resistance: 1535.00
Pivot: 1514.00
Support: 1490.75
Preferred case: Looking at the H4 chart, my overall bias for ZS1! is bearish due to the current price being under the Ichimoku cloud, indicating a bearish market. If this bearish momentum continues, expect price to possibly drop from the pivot at 1514.00, where the 23.6% Fibonacci line is before continue heading towards the support at 1490.75, slightly below where the -27.2% Fibonacci expansion line is.
Alternative scenario: Price may head back up to retest the resistance at 1535.00, where the 61.8% Fibonacci line is.
Fundamentals: There are no major news.

3 Inflation Scenarios for 2023There are only 3 inflation scenarios that will happen till the end of 2023:
i. Improve CPI to 2%
ii. Range CPI to hover between the band of 5-8%
iii. Continue to trend higher breaking above 9%
Many investors believe scenario (i) & (iii) will be unlikely.
70% of the investors feel that CPI should settle unchanged from how the year started at between 5%-8%.
Therefore, what is moving up then? Both the long-term and short-term? I have explained in the above video.
Feeder Cattle Futures
Minimum price fluctuation:
0.00025 per pound = $12.50
TAS: Zero or +/- 4 ticks in the minimum tick increment of the outright
Disclaimer:
• What presented here is not a recommendation, please consult your licensed broker.
• Our mission is to create lateral thinking skills for every investor and trader, knowing when to take a calculated risk with market uncertainty and a bolder risk when opportunity arises.
CME Real-time Market Data help identify trading set-ups in real-time and express my market views. If you have futures in your trading portfolio, you can check out on CME Group data plans available that suit your trading needs www.tradingview.com

Fading the Soybean Oil premium.Jumping straight into the technicals, we see a head and shoulder pattern on the daily Soybean Oil chart. With the neckline now broken, it seems a bearish set-up might be possible.
While the technicals are important, understanding where the current price level of soybean oil is in context to other products could help us build further conviction on this idea.
Firstly, the Soybean crush components. Currently, Soybean Oil trades at a pretty large premium against Soybean and Soybean Meal. Looking at the price ratios of Soybean Oil/Soybean & Soybean Oil/Soybean Meal, we also see that both have been trading out of the ‘normal’ range since 2021. With both ratios now trending lower and knocking on the door of the normal range again, we will watch closely to see what happens as we approach this critical juncture.
Secondly, Soybean Oil vs its substitute, Crude Palm Oil. Again, we see Soybean Oil as the outlier here, as prices diverge from Crude Palm Oil, with Soybean Oil trading higher. Looking at the bottom chart, we can clearly see the Soybean Oil/Crude Palm Oil ratio deviating from the average range established in 2018 – 2021. With this ratio recently trending lower, a break below the upper level of the range established (dotted line) could accelerate the closing of this premium, as seen in the 2021 to 2022 period, where the ratio collapsed swiftly.
The technically bearish setup, coupled with Soybean Oil’s relative valuation against the soybean complex and Crude Palm Oil on fundamental standpoint, makes a decent case to short Soybean Oil Futures from here.
To express this view, we can consider setting up the trade in a few ways:
1) An outright short on Soybean Oil using the CME Soybean Oil Futures, at the current level of 60.05, setting our stop at 67 and taking profit at 42, with each 1-point move in the Soybean Oil Futures contract equal to 600 USD.
2) A spread trade between Soybean Oil & Crude Palm Oil, by taking a short position in the CME Soybean Oil Futures contract and a long position in the CME Crude Palm Oil futures contract. Such a setup could potentially allow you to stay profitable even if you turn out to be ‘wrong’ in your market views if it eventually proves that crude palm oil has been underpriced and the soybean premium is closed by crude palm oil rallying. For this trade, it is trickier to set up due to the contract size and tick value difference.
Interested readers can check out one of our previous ideas where we have covered this trade in further detail:
The charts above were generated using CME’s Real-Time data available on TradingView. Inspirante Trading Solutions is subscribed to both TradingView Premium and CME Real-time Market Data which allows us to identify trading set-ups in real-time and express our market opinions. If you have futures in your trading portfolio, you can check out on CME Group data plans available that suit your trading needs www.tradingview.com
Disclaimer:
The contents in this Idea are intended for information purpose only and do not constitute investment recommendation or advice. Nor are they used to promote any specific products or services. They serve as an integral part of a case study to demonstrate fundamental concepts in risk management under given market scenarios. A full version of the disclaimer is available in our profile description.
Reference:
www.cmegroup.com
www.cmegroup.com
www.cmegroup.com

TOFU FuturesI posted Cattle futures earlier, but I realize some of my followers may be vegetarian.
Tofu futures also trending up, and I would expect it to bust out to new highs if the Fed doesn't go .50% today. Inflation is not gone, just dipped like this chart did. Trend is once again UP, not down.
The Fed is incompetent and looks at trailing data instead of futures, so I think they screw up just like they did a couple of years ago.

Soybean Oil Futures ( ZL1! ), H4 Potential for Bullish RiseTitle: Soybean Oil Futures ( ZL1! ), H4 Potential for Bullish Rise
Type: Bullish Rise
Resistance: 64.60
Pivot: 61.66
Support: 59.90
Preferred case: Looking at the H4 chart, my overall bias for ZL1!is bullish due to the current price being above the Ichimoku cloud , indicating a bullish market. Expecting price to retest the pivot at 61.66, where the overlap support and 23.6 % Fibonacci line is before heading towards the resistance at 64.60, where the overlap resistance and 61.8% Fibonacci line is.
Alternative scenario: Price could head back down to break the pivot at 61.66, where the overlap support and 23.6 % Fibonacci line is, before heading towards the support at 59.90, where the previous swing low is.
Fundamentals: There are no major news.

ZO1! Potential For Bearish ContinuationLooking at the H4 chart, my overall bias for ZO1! is bearish due to the current price being below the Ichimoku cloud, indicating a bearish market. Looking for a possible pullback sell entry at 354.375, where the 50% Fibonacci line is. Stop loss will be at 377.500, where the previous swing high is. Take profit will be at 330.500, where the recent lows and liquidity hotspots are located.
Please be advised that the information presented on TradingView is provided to Vantage (‘Vantage Global Limited’, ‘we’) by a third-party provider (‘Everest Fortune Group’). Please be reminded that you are solely responsible for the trading decisions on your account. There is a very high degree of risk involved in trading. Any information and/or content is intended entirely for research, educational and informational purposes only and does not constitute investment or consultation advice or investment strategy. The information is not tailored to the investment needs of any specific person and therefore does not involve a consideration of any of the investment objectives, financial situation or needs of any viewer that may receive it. Kindly also note that past performance is not a reliable indicator of future results. Actual results may differ materially from those anticipated in forward-looking or past performance statements. We assume no liability as to the accuracy or completeness of any of the information and/or content provided herein and the Company cannot be held responsible for any omission, mistake nor for any loss or damage including without limitation to any loss of profit which may arise from reliance on any information supplied by Everest Fortune Group.

Soybean Futures ( ZS1! ), H4 Potential for Bearish DropTitle: Soybean Futures ( ZS1! ), H4 Potential for Bearish Drop
Type: Bearish Drop
Resistance: 1535.00
Pivot: 1492.25
Support: 1457.75
Preferred case: Looking at the H4 chart, my overall bias for ZS1! is bearish due to the current price being under the Ichimoku cloud, indicating a bearish market. If this bearish momentum continues, expect price to possibly continue heading towards the support at 1457.75, where the 61.8% Fibonacci line is.
Alternative scenario: Price may head back up to retest the pivot at 1492.25, where the 38.2% Fibonacci line is.
Fundamentals: There are no major news.

Soybean Futures ( ZS1! ), H4 Potential for Bullish ContinuationTitle: Soybean Futures ( ZS1! ), H4 Potential for Bullish Continuation
Type: Bullish Continuation
Resistance: 1535.00
Pivot: 1492.25
Support: 1457.75
Preferred case: Looking at the H4 chart, my overall bias for ZS1! is bullish due to the current price crossing above the Ichimoku cloud , indicating a bullish market. If this bullish momentum continues, expect price to possibly continue heading towards the resistance at 1535.00, where the recent high is
Alternative scenario: Price may head back down to break the pivot at 1492.25, where the 38.2% Fibonacci line is before heading towards the support at 1457.75, where the 61.8% Fibonacci line is.
Fundamentals: There are no major news.
ZS1! Potential For Bearish DropLooking at the H4 chart, my overall bias for ZS1! is bearish due to the current price crossing below the Ichimoku cloud, indicating a bearish market. Looking for a sell entry at 1509.00, where the 38.2% Fibonacci line is. Stop loss will be at 1537.50, where the recent high is. Take profit will be at 1465.50, where the 38.2% Fibonacci line is.
Please be advised that the information presented on TradingView is provided to Vantage (‘Vantage Global Limited’, ‘we’) by a third-party provider (‘Everest Fortune Group’). Please be reminded that you are solely responsible for the trading decisions on your account. There is a very high degree of risk involved in trading. Any information and/or content is intended entirely for research, educational and informational purposes only and does not constitute investment or consultation advice or investment strategy. The information is not tailored to the investment needs of any specific person and therefore does not involve a consideration of any of the investment objectives, financial situation or needs of any viewer that may receive it. Kindly also note that past performance is not a reliable indicator of future results. Actual results may differ materially from those anticipated in forward-looking or past performance statements. We assume no liability as to the accuracy or completeness of any of the information and/or content provided herein and the Company cannot be held responsible for any omission, mistake nor for any loss or damage including without limitation to any loss of profit which may arise from reliance on any information supplied by Everest Fortune Group.

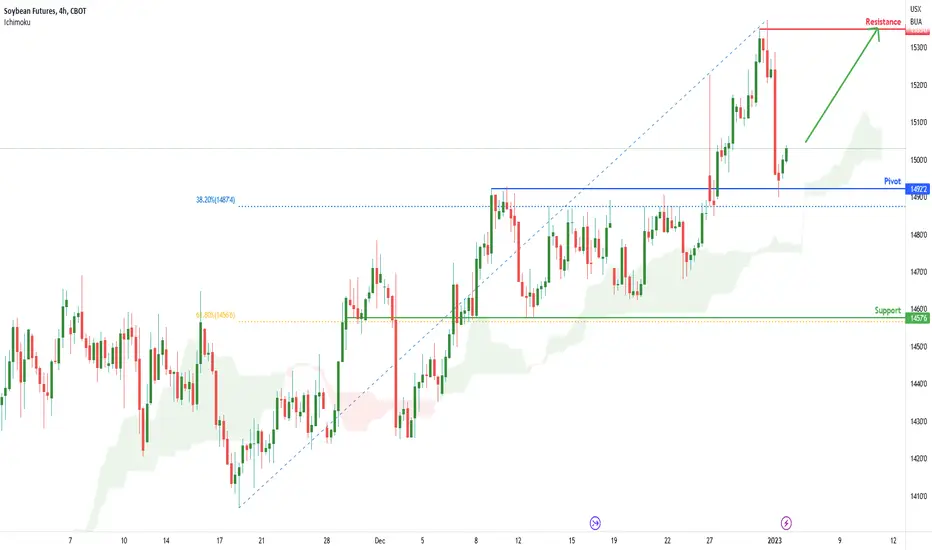
Soybean Futures ( ZS1! ), H4 Potential for Bullish ContinuationTitle: Soybean Futures ( ZS1! ), H4 Potential for Bullish Continuation
Type: Bullish Continuation
Resistance: 1508.75
Pivot: 1469.00
Support: 1423.25
Preferred case: Looking at the H4 chart, my overall bias for ZS1! is bullish due to the current price crossing above the Ichimoku cloud , indicating a bullish market. If this bullish momentum continues, expect price to possibly break the pivot at 1469.00, where the previous high and 78.6% Fibonacci line are before heading towards the resistance level at 1508.75, where the previous swing high is.
Alternative scenario: Price may head back down to the support at 1423.25, where the 38.2% Fibonacci line is.
Fundamentals: There are no major news.

Soybean Futures ( ZS1! ), H4 Potential for Bullish ContinuationTitle: Soybean Futures ( ZS1! ), H4 Potential for Bullish Continuation
Type: Bullish Continuation
Resistance: 1508.75
Pivot: 1469.00
Support: 1423.25
Preferred case: Looking at the H4 chart, my overall bias for ZS1! is bullish due to the current price being above the Ichimoku cloud , indicating a bullish market. If this bullish momentum continues, expect price to possibly continue heading towards the resistance level at 1508.75, where the previous swing high is.
Alternative scenario: Price may head back down to break the pivot at 1469.00, where the previous high and 78.6% Fibonacci line are before heading to the support at 1423.25, where the 38.2% Fibonacci line is.
Fundamentals: There are no major news.
