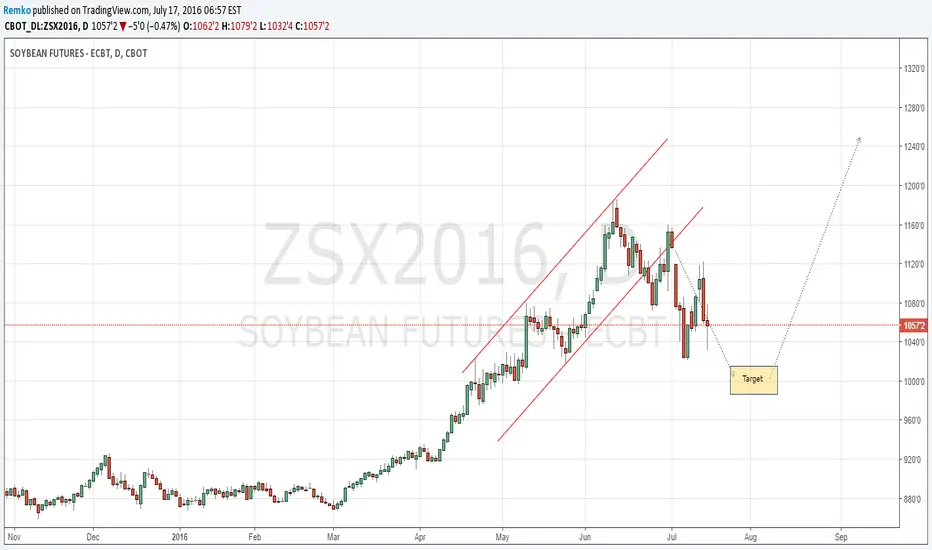
Soybeans CBoT stopped out and waiting for a long play set up nowSoybeans:
Price corrected up during the first half of the past week and still has to complete its move down a bit further to the 10/9.75 region where we expect price to reverse and make a move up of 20%. Traders who entertained the short play last week should have been stopped out and if not their stops were not tight enough so they are more rather lucky than smart.
We expect price to touch our targeted level during the coming week from where a long play can be entertained with an upswing potential of 20/25% in price.
Soybean
Soybean - A Descending Triangle PatternLe'ts take a look at the Soybean Futures market by examining its 2hr chart. What do we see:
- Price has consolidated in a descending triangle.
- Support @1130 running flat
- Resistance is the downtrend line.
- A break out of either way will tell us about its next going direction.
A descending triangle is usually a continuation pattern so here the upside is favored as Soybean price is bullish in daily and weekly chart. There are instances when descending triangles form as reversal patterns at the end of an uptrend, but they are typically continuation patterns.
Stay Tuned.

Weighted Basket of 5 Agri Commoditeis - Hyperinflation Coming*EDIT in text quote on left of chart - *Synchronicity in between
I have created an equally weighted portfolio of 5 sustenance based commodities including Soybean, Soybean Oil, Sugar, Wheat, and Maize (continuous fwd contracts). This is an update to the first chart I have published (rough rice) which isn't updating for some reason but if you see the RR1! graph on another website you will see that my analysis is 100% on point so far and even identifies exact msp level prior to breakout. I am expecting sustenance based commodity hyperinflation in the coming years as we enter a macroeconomic environment that the economics textbooks have never described. The money manager commitment data points to breakout, technicals show clear range suppression and evident accumulation pointing to impeding breakout. Global trade statistics are abysmal, statistics of subprime/consumer debt/corporate debt delinquencies are abysmal, PE ratios of leading equity markets are abysmal. I do not wish for this to happen because this will affect billions of people but this is most likely what is going to happen. Best of luck.

Short Setup and Trade for Soybean CBOTI have my own trading system depending on only numbers and dependin on my system it said short. I only want to publish here to track my records and share with the public.


Long March Soybean Oil - 2 Target TradeSimple trend-line setup on Soybean Oil. 2 targets on this one. 15/1 Risk/Reward to the 1st target.

$SOYBEANS: TARGET 1 COMPLETE!See out PLAN SETUP:
I do appreciate all views be it a like or comment, and if you subscribe to this analysis, you will receive all of our real-time update! Thanks!
SignalSuisse

Soybean (ZS) Testing Downchannel/Descending Wedge ResistanceAfter a two week rally, soybean (ZS) is now bumping into downchannel/descending wedge resistance on the weekly chart, which coincides roughly with the 1000 psychologically key resistance level. Weekly RSI and Stochastics are in rally mode, while the MACD which a few weeks back appeared ready for a negative crossover has strengthened again and is sloping up now.
For my multiple timeframe analysis on ZS, feel free to visit: tradablepatterns.com
Website: tradablepatterns.com
FB: facebook.com
Stocktwits: stocktwits.com
Twitter: twitter.com
Linkedin: www.linkedin.com
YouTube: www.youtube.com
Google+: google.com
Email: info@tradablepatterns.com

ZS upward "C" wave to come (???)Soybean has been a tough market for those traders seeking volatility as it has been on a “wait-and-see” mode for a couple of month now. I do not expect any major movement on the short/mid run; however, I do see a possibility to “widen” the current trading range.
The wave counting above suggests that a B wave would be completed (or nearly completed) and a possible upward C wave would be on the radar screen. For those (unlike me) seeking short-term opportunities it may be a good commodity to keep track on.
I am still holding my long position with stops on a range around 920, although I confess the weekly chart does not look that bullish. In fact, the MACD divergence is killing my sleep lately.
See my comments on ZC at:

Soybean Meal /ZM possiblity of entering textbook resistanceThis could be possibly the easiest short out there on the futures markets. This resistance area at 340 was tested as support numerous times and held until September. It has yet to be tested as resistance. Usually the first touch of support-turned-resistance holds very strongly as multiple traders will be looking at the same area to enter short.
Target is a significant move lower from this area, that could change of course depending on the price action following an entry of the trade. Stop is simply above the resistance area. The risk/reward for this trade is phenomenal due to how clean the resistance is.

Soybeans (ZS) Bottoming on Weekly ChartZS has found major support at around the 900 level, as seen by the weekly RSI, Stochastics and MACD all turning up from oversold levels. The 900 round figure coincides with major bottoms in 2009 and 2010, along with near bottoming activity in late 2008. ZS appears to want to target roughly 1000 in the near-term where downchannel resistance can be expected to hold initially. Feel free to visit stks.co for today's technical analysis on $ZS_F, $ZW_F, $CT_F, $ZC_F, $NG_F, $SI_F, $EURUSD, $GBPUSD, $USDX, $BUXL, $KC_F, $NFLX.
Website: tradablepatterns.com
FB: facebook.com
Stocktwits: stocktwits.com
Twitter: twitter.com
Linkedin: www.linkedin.com
YouTube: www.youtube.com
Google+: google.com
Email: info@tradablepatterns.com
