SoyBeans Price Reversal – Time to Swipe Bearish Profits🔓 Operation SoyBeans: Vault Breach Underway! 💼🌾
🌟Hi! Hola! Ola! Bonjour! Hallo! Marhaba!🌟
Calling All Market Bandits, Scalping Buccaneers & Swinging Looters 🕵️♂️💰💣
We've marked our next robbery target—the "SoyBeans" Commodities CFD Market.
This isn’t just a trade, it’s an orchestrated heist built off Thief Trading intelligence: a mix of technical traps, fundamental cues, and criminal market psychology. 🧠💸
🔎 🎯 Entry Point - Where the Safe Cracks Open:
The vault is wide open—grab bearish loot at any price!
But for maximum stealth, layer in buy limit orders on the pullback using the 15m or 30m timeframe near swing highs/lows.
(We thieves call this: DCA under the radar.) 🕳️📉
🛡️ 🚨Stop Loss - Our Escape Hatch:
Set SL at the nearest 4H candle wick swing high (1040.00).
Customize it based on your loot size (lot size), order count, & risk appetite.
A smart thief knows when to vanish! 🏃♂️💨
🏁 💰Target - The Vault Cash-Out Point:
Main Heist Target: 970.00
Or exit early if the cops (volatility) show up! 🚔🎯
💡 Scalper’s Note - Quick Grab & Dash:
If you’ve got a heavy bag 💼💸, scalp short aggressively.
If not, roll with the swing crew—use trailing SLs to lock the loot and flee clean. 💨📦
📉 Thief Insight – Why We're Robbing This Vault:
"SoyBeans" showing bearish breakdowns due to:
📰 COT Positioning
📦 Inventory & Storage Data
🕰️ Seasonal Weakness
💭 Sentiment Drift
🔗 Intermarket Signals
Get the full scoop—go dig deeper into your own thief intelligence sources. 📚🕵️♂️
⚠️ Stay Alert – Market Mayhem Incoming!
News drops = surveillance upgrades. Avoid new trades during major releases.
Protect running loot with tight trailing SLs—guard your stolen goods! 🛑🗞️📉
❤️🔥 Show Some Love to the Robbery Crew!
💥Smash that BOOST button💥 to fuel the Thief Army.
Together, we rob smarter. 💰🚀
🔔 Stay Tuned, Looters:
Another heist is being planned. Don't miss the next setup.
Money is out there… we just have to take it the thief way. 🧠💎
📜 Disclaimer:
This plan is for chart criminals in training 📉🕵️♂️ – not personalized financial advice.
Always assess your own risks before raiding any market vault.
Soybeans
Soybeans and Rain: Moisture’s Market Impact on the Bean Trade1. Introduction: Moisture & Market Momentum
Soybeans, often referred to as “the oilseed king,” are a cornerstone of global agriculture. As a leading source of protein for both humans and animals, their price fluctuations affect industries ranging from food production to biofuels. One key variable traders often monitor? Rainfall. 🌧️
Moisture plays a critical role in soybean development, influencing yield and quality from the moment the seed is sown. It’s no surprise that many market participants assume a strong correlation between rainfall and price behavior. But is that assumption truly supported by data?
In this article, we analyze how varying precipitation levels impact weekly soybean futures returns. As you'll see, the results might not be as clear-cut as you’d expect—but they still offer meaningful insights.
2. Biological Realities: Soybeans’ Water Needs
Soybeans thrive under specific conditions. While they’re generally resilient, rainfall—or the lack thereof—can tip the balance between bumper harvests and disappointing yields.
During early vegetative stages, sufficient moisture ensures healthy root development. Later, during the pod-fill phase, rainfall becomes even more essential. Too little water at this point leads to incomplete pods or aborted seeds. On the flip side, too much rain can invite fungal diseases and delay harvests, especially in lower-lying regions.
In countries like Brazil and Argentina, soybean fields often face seasonal extremes, while the U.S. Midwest typically enjoys more consistent conditions—though droughts and floods have both hit the Corn Belt in recent years. These environmental realities create natural volatility in both yield and pricing expectations.
3. Methodology: How We Analyzed Weather vs. Futures
To explore the potential connection between rainfall and soybean futures prices, we collected weekly weather data for major soybean-growing cities across the globe. Each week’s precipitation was categorized using a normalized percentile system:
Low Rainfall: below the 25th percentile
Normal Rainfall: between the 25th and 75th percentiles
High Rainfall: above the 75th percentile
We then matched this data against weekly returns of standard soybean futures (ZS) and micro soybean futures (MZS), both traded on the CME Group.
This allowed us to compare average price behavior in different rainfall scenarios—and test whether there was any statistically significant difference between dry and wet weeks.
4. Statistical Findings: Is There a Signal in the Noise?
When examining the data, the initial visual impression from boxplots was underwhelming—return distributions across rainfall categories looked surprisingly similar. However, a deeper dive showed that the difference in mean returns between low and high precipitation weeks was statistically significant, with a p-value around 0.0013.
What does that mean for traders? While the signal may not be obvious to the naked eye, statistically, rainfall extremes do impact market behavior. However, the magnitude of impact remains modest—enough to be part of your strategy but not enough to drive decisions in isolation.
Soybean prices appear to be influenced by a mosaic of factors, with precipitation being just one tile in that complex picture.
5. Charting the Relationship: Visual Evidence
While statistical tests gave us the green light on significance, we know traders love to “see” the story too. Boxplots of weekly soybean futures returns segmented by rainfall categories offered a subtle narrative:
Low-precipitation weeks showed slightly higher average returns and tighter interquartile ranges.
High-precipitation weeks had broader return distributions and more frequent downside outliers.
Normal weeks exhibited relatively stable behavior, reinforcing the idea that the market reacts most during extremes.
This kind of visualization may not scream alpha at first glance, but it reinforces the idea that precipitation events—particularly dry spells—tend to nudge prices upward, possibly as market participants price in production risk.
6. Trading Implications: Positioning Around Weather
Here’s where things get practical. While weather alone won’t dictate every trading decision, it can be a key filter in a broader strategy. For soybean traders, rainfall data can help inform:
Bias assessment: Low-precipitation weeks may suggest bullish tendencies.
Risk control: Expect wider return distributions in high-precip weeks—adjust stops or contract sizing accordingly.
Event trading: Pair weather anomalies with technical signals like trendline breaks or volume surges for potential setups.
It’s also worth noting that weekly weather forecasts from reputable sources can serve as a forward-looking indicator, giving traders a head start before the market fully reacts.
7. Margin Efficiency with Micro Soybeans
For traders looking to scale into soybean exposure without the capital intensity of full contracts, the CME Group’s micro-sized futures offer a compelling alternative.
📌 Contract Specs for Soybean Futures (ZS):
Symbol: ZS
Contract size: 5,000 bushels
Tick size: 1/4 of one cent (0.0025) per bushel = $12.50
Initial margin: ~$2,100 (varies by broker and volatility)
📌 Micro Soybean Futures (MZS):
Symbol: MZS
Contract size: 500 bushels
Tick size: 0.0050 per bushel = $2.50
Initial margin: ~$210
These smaller contracts are perfect for strategy testing, risk scaling, or layering exposure around key macro events like WASDE reports or weather disruptions. For traders aiming to build weather-aligned positions, MZS is a powerful tool to balance conviction with capital efficiency.
8. Wrapping It All Together
Rain matters. Not just in fields, but in futures prices too. While soybean markets may not overreact to every drizzle or downpour, extreme rainfall conditions—especially drought—can leave noticeable footprints on price action.
For traders, this means opportunity. By incorporating precipitation metrics into your workflow, you unlock a new layer of context. One that doesn’t replace technical or fundamental analysis, but enhances both.
And remember: this article is just one piece of a larger exploration into how weather affects the commodity markets. Make sure you also read prior installments.
When charting futures, the data provided could be delayed. Traders working with the ticker symbols discussed in this idea may prefer to use CME Group real-time data plan on TradingView: www.tradingview.com - This consideration is particularly important for shorter-term traders, whereas it may be less critical for those focused on longer-term trading strategies.
General Disclaimer:
The trade ideas presented herein are solely for illustrative purposes forming a part of a case study intended to demonstrate key principles in risk management within the context of the specific market scenarios discussed. These ideas are not to be interpreted as investment recommendations or financial advice. They do not endorse or promote any specific trading strategies, financial products, or services. The information provided is based on data believed to be reliable; however, its accuracy or completeness cannot be guaranteed. Trading in financial markets involves risks, including the potential loss of principal. Each individual should conduct their own research and consult with professional financial advisors before making any investment decisions. The author or publisher of this content bears no responsibility for any actions taken based on the information provided or for any resultant financial or other losses.

Soybean Breakout – Time to Steal Profits!🚨 "SOYBEAN HEIST ALERT: Bullish Loot Ahead! 🎯💰 (Thief Trading Strategy)"
🌟 Greetings, Market Pirates & Profit Raiders! 🌟
"The vault is unlocked—time to plunder the 🌱🍃SOYBEAN CFD market! Here’s your master plan for a smooth heist."
🔎 TRADE SETUP (Thief Edition)
Entry 📈: "Buy the dip or chase the breakout—bullish momentum is ripe for stealing!"
Pro Tip: Use buy limits near 15-30min pullbacks (swing lows/highs) for optimal theft.
Stop Loss 🛑: "Hide your loot!" Set SL at nearest 4H swing low (1030.00). Adjust based on your risk appetite.
Target 🎯: 1085.0 — or escape early if bears ambush!
⚡ SCALPERS’ NOTE:
"Only long scalps allowed! Rich? Raid now. Poor? Join swing thieves & trail your SL!"
🔥 WHY SOYBEAN? (Bullish Catalysts)
Technicals + fundamentals align for a bullish heist.
Check: COT reports, seasonals, macro trends, and intermarket signals (links below 👇).
⚠️ WARNING: NEWS = VOLATILITY
Avoid new trades during major news.
Trailing SLs = your escape rope! Lock profits before the cops (bears) arrive.
💎 BOOST THIS HEIST!
"Smash 👍 LIKE, hit 🔔 FOLLOW, and share the loot! Your support fuels our next raid."
🎯 Final Tip: "Profit is yours—take it and vanish! 🏴☠️"
📢 Stay tuned for the next heist! "Market thieves never sleep…" 😉

Stealing from bears: soybean long setup!🚨 THE GREAT SOYBEAN HEIST: Bullish Raid Plan (Swing/Day Trade) 🏴☠️💸
🌟 ATTENTION, MARKET BANDITS & MONEY SNATCHERS! 🌟
(Hola! Oi! Bonjour! Salaam! Guten Tag!)
🔥 Using the ruthless Thief Trading Strategy (TA + FA), we’re executing a bullish raid on the SOYBEAN Commodities CFD Market! Time to steal profits from the bears before they wake up! 🥷💨
🎯 MASTER HEIST PLAN (BULLISH RAID)
📈 Entry Point (Buy Limit/Market):
"The vault is unlocked—grab the bullish loot at any price!"
🔹 *For precision heists, set buy limits near pullbacks (15M/30M).*
🔹 ALERT: Set price alerts to catch the perfect steal!
🛑 Stop Loss (Escape Route):
📌 Thief SL at nearest swing low (3H timeframe) – 1030.0
📌 Adjust SL based on your risk tolerance & position size.
🎯 Profit Target (Escape Before Bears Strike Back):
💥 1095.0 (or exit early if the trap snaps shut!)
🧲 Scalper’s Bonus:
Only scalp LONG!
Big wallets? Go all-in! Small wallets? Swing-trade the robbery!
Use trailing SL to lock profits and escape clean!
🌱 MARKET TREND: BULLISH (BEAR TRAP SET!)
Overbought? Maybe. But the real trap is where bearish robbers get slaughtered.
High risk = High reward—only for cold-blooded traders!
📡 FUNDAMENTAL INTEL (DON’T SKIP THIS!)
🔗 Full reports (COT, Macro, Seasonals, Sentiment, Intermarket Analysis) in our biio!
🚨 TRADING ALERT: NEWS = DANGER ZONE!
❌ Avoid new trades during news!
🔐 Use trailing stops to lock profits & escape alive!
💥 BOOST THIS HEIST! (HELP US ROB THE MARKET!)
🔥 Hit LIKE & FOLLOW to strengthen our robbery squad!
💰 More heists = More profits. Stay tuned for the next raid!
🐱👤 See you in the shadows, bandits! 🤑🚀

Soybeans and Heat: Subtle Signals in a Volatile Market1. Introduction
Soybeans aren't just a staple in livestock feed and global cuisine—they’re also a major commodity in futures markets, commanding serious attention from hedgers and speculators alike. With growing demand from China, unpredictable yields in South America, and increasing climatic instability, the behavior of soybean prices often reflects a deeper interplay of supply chain stress and environmental variability.
Among the many weather variables, temperature remains one of the most closely watched. It’s no secret that extreme heat can harm crops. But what’s less obvious is this: Does high temperature truly move the soybean market in measurable ways?
As we’ll explore, the answer is yes—but with a twist. Our deep dive into decades of data reveals a story of statistical significance, but not dramatic deviation. In other words, the signal is there, but you need to know where—and how—to look.
2. Soybeans and Climate Sensitivity
The soybean plant’s sensitivity to heat is well documented. During its flowering and pod-setting stages, typically mid-to-late summer in the U.S., soybean yields are highly vulnerable to weather fluctuations. Excessive heat during these windows—particularly above 30ºC (86ºF)—can impair pod development, lower seed count, and accelerate moisture loss from the soil.
The optimal range for soybean development tends to hover between 20ºC to 30ºC (68ºF to 86ºF). Within this window, the plant thrives—assuming adequate rainfall and no pest infestations. Go beyond it for long enough, and physiological stress builds up. This is precisely the kind of risk that traders price into futures markets, often preemptively based on forecasts.
Yet, trader psychology is just as important as crop biology. Weather alerts—especially heatwaves—often drive speculative trading. The market may anticipate stress well before actual yield reports come out. This behavior is where we see the beginnings of correlation between temperature and market movement.
3. Quantifying Weather Impact on Soybean Futures
To test how meaningful these heat-driven narratives are, we categorized weekly temperatures into three buckets:
Low: Below the 25th percentile of weekly temperature readings
Normal: Between the 25th and 75th percentile
High: Above the 75th percentile
We then calculated weekly returns of Soybean Futures (ZS) across these categories. The results?
Despite the modest visual differences in distribution, the statistical analysis revealed a clear pattern: Returns during high-temperature weeks were significantly different from those during low-temperature weeks, with a p-value of 3.7e-11.
This means the likelihood of such a difference occurring by chance is effectively zero. But here’s the catch—the difference in mean return was present, yes, but not huge. And visually, the boxplots showed overlapping quartiles. This disconnect between statistical and visual clarity is exactly what makes this insight subtle, yet valuable.
4. What the Data Really Tells Us
At first glance, the boxplots comparing soybean futures returns across temperature categories don’t scream “market-moving force.” The medians of weekly returns during Low, Normal, and High temperature periods are closely clustered. The interquartile ranges (IQRs) overlap significantly. Outliers are present in every category.
So why the statistical significance?
It’s a matter of consistency across time. The soybean market doesn’t suddenly explode every time it gets hot—but across hundreds of data points, there’s a slightly more favorable distribution of returns during hotter weeks. It’s not dramatic, but it’s reliable enough to warrant strategic awareness.
This is where experienced traders can sharpen their edge. If you’re already using technical analysis, seasonal patterns, or supply-demand forecasts, this weather-based nuance can serve as a quiet confirmation or subtle filter.
5. Why This Still Matters for Traders
In markets like soybeans, where prices can respond to multiple fundamental factors—currency shifts, export numbers, oilseed competition—small weather patterns might seem like background noise. But when viewed statistically, these small effects can become the grain of edge that separates average positioning from smart exposure.
For example:
Volatility tends to rise during high-heat weeks, even when average return shifts are small.
Institutional players may rebalance positions based on crop health assumptions before USDA reports arrive.
Weather trading algos can push prices slightly more aggressively during risk-prone periods.
In short, traders don’t need weather to predict price. But by knowing what weather has historically meant, they can adjust sizing, bias, or timing with greater precision.
6. Contract Specs: Standard vs. Micro Soybeans
Accessing the soybean futures market doesn’t have to require big institutional capital. With the launch of Micro Soybean Futures (MZS), traders can participate at a more granular scale.
Here are the current CME Group specs:
📌 Contract Specs for Soybean Futures (ZS):
Symbol: ZS
Contract size: 5,000 bushels
Tick size: 1/4 of one cent (0.0025) per bushel = $12.50
Initial margin: ~$2,100 (varies by broker and volatility)
📌 Micro Soybean Futures (MZS):
Symbol: MZS
Contract size: 500 bushels
Tick size: 0.0050 per bushel = $2.50
Initial margin: ~$210
The micro-sized contract allows traders to scale into positions, especially when exploring signals like weather impact. It also enables more nuanced strategies—such as partial hedges or volatility exposure—without the capital intensity of full-size contracts.
7. Conclusion: A Nuanced Edge for Weather-Aware Traders
When it comes to soybeans and temperature, the story isn’t one of obvious crashes or dramatic spikes. It’s a story of consistent, statistically measurable edges that can quietly inform better trading behavior.
Yes, the return differences may look small on a chart. But over time, in leveraged markets with seasonality and fundamental noise, even a few extra basis points in your favor—combined with smarter sizing and timing—can shift your performance curve meaningfully.
Using tools like Micro Soybean Futures, and being aware of technical frameworks, traders can efficiently adapt to subtle but reliable signals like temperature-based volatility.
And remember: this article is just one piece in a multi-part series exploring the intersection of weather and agricultural trading. The next piece might just provide the missing link to complete your edge. Stay tuned. 🌾📈
When charting futures, the data provided could be delayed. Traders working with the ticker symbols discussed in this idea may prefer to use CME Group real-time data plan on TradingView: www.tradingview.com - This consideration is particularly important for shorter-term traders, whereas it may be less critical for those focused on longer-term trading strategies.
General Disclaimer:
The trade ideas presented herein are solely for illustrative purposes forming a part of a case study intended to demonstrate key principles in risk management within the context of the specific market scenarios discussed. These ideas are not to be interpreted as investment recommendations or financial advice. They do not endorse or promote any specific trading strategies, financial products, or services. The information provided is based on data believed to be reliable; however, its accuracy or completeness cannot be guaranteed. Trading in financial markets involves risks, including the potential loss of principal. Each individual should conduct their own research and consult with professional financial advisors before making any investment decisions. The author or publisher of this content bears no responsibility for any actions taken based on the information provided or for any resultant financial or other losses.

"SOYBEANS" Commodities CFD Market Bearish Heist (Swing Trade)🌟Hi! Hola! Ola! Bonjour! Hallo! Marhaba!🌟
Dear Money Makers & Robbers, 🤑💰💸✈️
Based on 🔥Thief Trading style technical and fundamental analysis🔥, here is our master plan to heist the 🥔🍀🍃SOYBEAN🍃🥔🍀 Commodities CFD Market. Please adhere to the strategy I've outlined in the chart, which emphasizes long entry. Our aim is to escape near the high-risk ATR Zone. Risky level, overbought market, consolidation, trend reversal, trap at the level where traders and bearish robbers are stronger. 🏆💸"Take profit and treat yourself, traders. You deserve it!💪🏆🎉
Entry 📈 : "The vault is wide open! Swipe the Bullish loot at any price - the heist is on!
however I advise to Place buy limit orders within a 15 or 30 minute timeframe most recent or swing, low or high level. I Highly recommended you to put alert in your chart.
Stop Loss 🛑:
Thief SL placed at the Nearest / Swing low level Using the 1D timeframe (980.0) Day/Swing trade basis.
SL is based on your risk of the trade, lot size and how many multiple orders you have to take.
🏴☠️Target 🎯: 1100.0 (or) Escape Before the Target
🧲Scalpers, take note 👀 : only scalp on the Long side. If you have a lot of money, you can go straight away; if not, you can join swing traders and carry out the robbery plan. Use trailing SL to safeguard your money 💰.
🍀🍃SOYBEAN🍃🍀 Commodities CFD Money Heist Plan is currently experiencing a bullishness,., driven by several key factors. .☝☝☝
📰🗞️Get & Read the Fundamental, Macro, COT Report, Inventory and Storage Analysis, Seasonal Factors, Sentimental Outlook, Intermarket Analysis, Future trend targets and Overall outlook score..., go ahead to check👉👉👉🔗🔗🌎🌏🗺
⚠️Trading Alert : News Releases and Position Management 📰🗞️🚫🚏
As a reminder, news releases can have a significant impact on market prices and volatility. To minimize potential losses and protect your running positions,
we recommend the following:
Avoid taking new trades during news releases
Use trailing stop-loss orders to protect your running positions and lock in profits
💖Supporting our robbery plan 💥Hit the Boost Button💥 will enable us to effortlessly make and steal money 💰💵. Boost the strength of our robbery team. Every day in this market make money with ease by using the Thief Trading Style.🏆💪🤝❤️🎉🚀
I'll see you soon with another heist plan, so stay tuned 🤑🐱👤🤗🤩

Soybeans: The Global Protein Powerhouse🟡 1. Introduction
Soybeans might not look like much at first glance — small, round, unassuming. But behind every bean lies a global story of protein demand, export flows, and economic policy.
They feed livestock, fuel vehicles, nourish entire populations, and move markets. In fact, soybeans sit at the intersection of agriculture, industry, and geopolitics — making them one of the most actively traded and strategically watched commodities in the world.
If you’re looking to understand how soybeans move markets — and how you can trade them effectively — this article is your starting point.
🌍 2. Why the World Cares About Soybeans
Few agricultural commodities carry the weight soybeans do. Their importance spans both the food and energy sectors — and their global footprint is enormous.
Here’s why they matter:
Protein Meal: After processing, about 80% of the soybean becomes high-protein meal used to feed poultry, pigs, and cattle.
Soybean Oil: Roughly 20% is extracted as oil — a key ingredient in cooking, industrial products, and increasingly, biodiesel.
Biofuels: As the push for renewable energy grows, soybean oil plays a major role in sustainable fuel strategies.
Top producers:
United States — historically the world’s largest producer.
Brazil — now rivals or exceeds U.S. production in some years.
Argentina — a dominant player in soybean meal and oil exports.
Top importers:
China — imports over 60% of globally traded soybeans.
EU, Mexico, Japan — also large buyers.
Soybeans are a bridge commodity — connecting livestock feed, food manufacturing, and renewable energy. That’s why traders from Chicago to Shanghai watch every yield forecast and export announcement closely.
💹 3. CME Group Soybean Contracts
Soybeans trade on the CME Group’s CBOT platform, with two main futures products:
o Standard Soybeans
Ticker: ZS
Size = 5,000 bushels
Tick = 0.0025 = $12.50
Margin = ~$2,150
o Micro Soybeans
Ticker: MZS
Size = 500 bushels
Tick = 0.0050 = $2.50
Margin = ~$215
Soybean futures are among the most actively traded agricultural contracts, offering deep liquidity, tight spreads, and excellent volatility for strategic traders. Keep in mind that margins are subject to change — always confirm with your broker. Micro contracts are ideal for scaling in/out of trades or learning market structure without large capital risk.
📅 4. The Soybean Calendar
Soybeans follow a seasonal cycle that creates rhythm in the market — and a potential edge for informed traders.
In the United States:
🌱 Planting: Late April to early June
☀️ Pod development / blooming: July and early August (weather-sensitive)
🌾 Harvest: September through November
In Brazil:
🌱 Planting: October to December
🌾 Harvest: February through April
This staggered calendar means that soybean markets have multiple weather risk windows each year. It also means the export flows and global pricing dynamics shift between the Northern and Southern Hemispheres throughout the calendar year.
That’s why soybeans tend to have two major volatility windows — mid-summer (U.S. crop concerns) and early Q1 (South American weather). Traders often build seasonal strategies around these patterns — buying weakness before key USDA reports, fading rallies during overbought harvests, or trading futures spreads between U.S. and Brazilian supply flows.
🔄 5. How Soybeans Are Traded Globally
Soybeans move through a complex international web of growers, crushers, exporters, and consumers. As a trader, understanding this flow is essential — because each node introduces price risk, opportunity, and reaction points.
Key players:
o Hedgers:
U.S. and Brazilian farmers hedge production risk using futures or options on futures.
Exporters hedge shipping schedules against fluctuating basis and FX risk.
o Crushers:
Companies like Cargill or Bunge buy soybeans to crush into meal and oil.
Crush margin (aka “board crush”) affects demand and influences futures spreads.
o Speculators:
Institutional funds trade soybeans as a macro or relative value play.
Retail traders use micro contracts (MZS) to capture directional or seasonal moves.
o China:
Its purchasing pace (or sudden cancellations) can move markets dramatically.
Announcements of bulk U.S. purchases could trigger short-covering rallies.
Additionally, soybeans are sometimes traded indirectly via their by-products:
Soybean Meal (ZM)
Soybean Oil (ZL)
These contracts often lead or lag ZS based on demand shifts in feed or fuel.
📈 6. What Makes Soybeans Unique to Trade
Compared to wheat and corn, soybeans are:
More weather-sensitive during July and August (especially to drought and heat).
More globally integrated, thanks to China’s dominant import role.
More complex, due to crush dynamics and multiple end-use markets.
This multifaceted nature is why many professional traders monitor soybeans, even if they aren’t actively trading them every week.
📌 7. Summary / Takeaway
Soybeans are one of the most important — and most tradable — commodities in the world. They feed livestock, fuel industry, and anchor the agricultural markets across two hemispheres.
Their unique role in food, fuel, and feed makes them more than just another contract — they’re a barometer for global health, demand, and policy.
Whether you’re trading the standard ZS contract or getting started with MZS, mastering soybeans means understanding weather, trade flows, product demand, and seasonality.
🧭 This article is part of our agricultural futures trading series.
📅 Watch for the next release: “Weather and Corn: A Deep Dive into Temperature Impact”
When charting futures, the data provided could be delayed. Traders working with the ticker symbols discussed in this idea may prefer to use CME Group real-time data plan on TradingView: www.tradingview.com - This consideration is particularly important for shorter-term traders, whereas it may be less critical for those focused on longer-term trading strategies.
General Disclaimer:
The trade ideas presented herein are solely for illustrative purposes forming a part of a case study intended to demonstrate key principles in risk management within the context of the specific market scenarios discussed. These ideas are not to be interpreted as investment recommendations or financial advice. They do not endorse or promote any specific trading strategies, financial products, or services. The information provided is based on data believed to be reliable; however, its accuracy or completeness cannot be guaranteed. Trading in financial markets involves risks, including the potential loss of principal. Each individual should conduct their own research and consult with professional financial advisors before making any investment decisions. The author or publisher of this content bears no responsibility for any actions taken based on the information provided or for any resultant financial or other losses.

SOYBEAN - wyckoff accumulation3 Monthly turnaround on wyckoff accumulation
also a monthly reversal
On week timeframe it also looks like a reversal. the price is pushing the upper boundary of the sideways.

"SOYBEAN" Commodities CFD Market Bearish Heist (Swing/Day Trade)🌟Hi! Hola! Ola! Bonjour! Hallo! Marhaba!🌟
Dear Money Makers & Robbers, 🤑 💰💸✈️
Based on 🔥Thief Trading style technical and fundamental analysis🔥, here is our master plan to heist the 🥔🍀🍃SOYBEAN🍃🥔🍀 Commodities CFD Market. Please adhere to the strategy I've outlined in the chart, which emphasizes long entry. Our aim is to escape near the high-risk MA Zone. Risky level, overbought market, consolidation, trend reversal, trap at the level where traders and bearish robbers are stronger. 🏆💸"Take profit and treat yourself, traders. You deserve it!💪🏆🎉
Entry 📈 : "The vault is wide open! Swipe the Bullish loot at any price - the heist is on!
however I advise to Place buy limit orders within a 15 or 30 minute timeframe nearest or swing low or high level for pullback entries.
Stop Loss 🛑:
📍 Thief SL placed at the recent/swing low level Using the 30mins timeframe (1015) Day trade basis.
📍 SL is based on your risk of the trade, lot size and how many multiple orders you have to take.
🏴☠️Target 🎯: 1060 (or) Escape Before the Target
🧲Scalpers, take note 👀 : only scalp on the Long side. If you have a lot of money, you can go straight away; if not, you can join Day traders and carry out the robbery plan. Use trailing SL to safeguard your money 💰.
🥔🍀🍃"SOYBEAN"🍃🥔🍀Commodities CFD Market Heist Plan (Swing/Day) is currently experiencing a bullishness,., driven by several key factors.☝☝☝
📰🗞️Get & Read the Fundamental, Macro, COT Report, Inventory and Storage Analysis, Seasonal Factors, Sentimental Outlook, Intermarket Analysis, Future trend targets and Overall outlook score..., go ahead to check 👉👉👉🔗🔗
⚠️Trading Alert : News Releases and Position Management 📰 🗞️ 🚫🚏
As a reminder, news releases can have a significant impact on market prices and volatility. To minimize potential losses and protect your running positions,
we recommend the following:
Avoid taking new trades during news releases
Use trailing stop-loss orders to protect your running positions and lock in profits
💖Supporting our robbery plan 💥Hit the Boost Button💥 will enable us to effortlessly make and steal money 💰💵. Boost the strength of our robbery team. Every day in this market make money with ease by using the Thief Trading Style.🏆💪🤝❤️🎉🚀
I'll see you soon with another heist plan, so stay tuned 🤑🐱👤🤗🤩

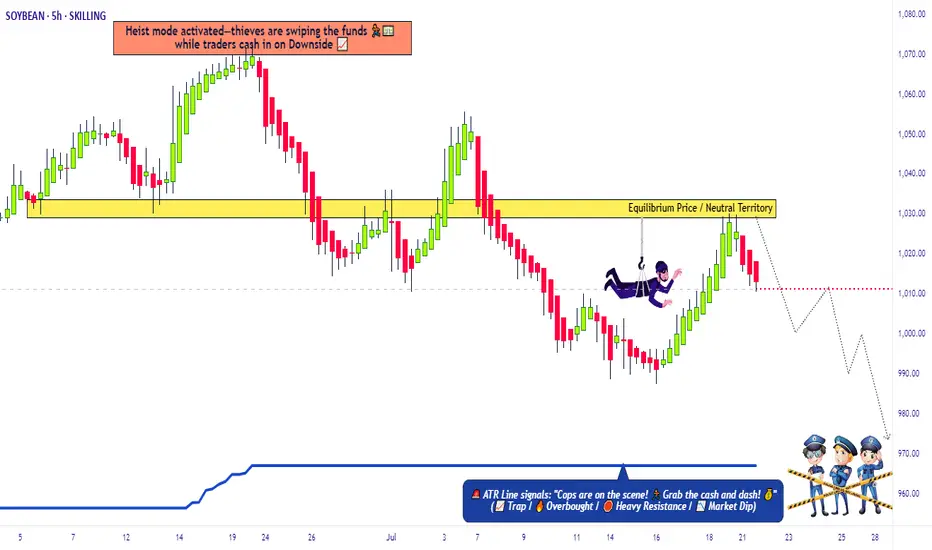
"SoyBeans" Commodities CFD Market Robbery Plan (Swing Trade)🌟Hi! Hola! Ola! Bonjour! Hallo! Marhaba!🌟
Dear Money Makers & Robbers, 🤑💰✈️
Based on 🔥Thief Trading style technical and fundamental analysis🔥, here is our master plan to heist the "SoyBeans" Commodities CFD Market. Please adhere to the strategy I've outlined in the chart, which emphasizes short entry. Our aim is the high-risk Green Zone. Risky level, oversold market, consolidation, trend reversal, trap at the level where traders and bullish robbers are stronger. 🏆💸Book Profits Be wealthy and safe trade.💪🏆🎉
Entry 📈 : "The heist is on! Wait for the breakout (975.0) then make your move - Bearish profits await!"
however I advise placing Sell Stop Orders below the breakout MA or Place Sell limit orders within a 15 or 30 minute timeframe. Entry from the most recent or closest low or high level should be in retest. I Highly recommended you to put alert in your chart.
📌I strongly advise you to set an "alert (Alarm)" on your chart so you can see when the breakout entry occurs.
Stop Loss 🛑: Thief SL placed at (1015.0) Swing Trade Basis Using the 4H period, the recent / swing high or low level.
SL is based on your risk of the trade, lot size and how many multiple orders you have to take.
Target 🎯: 935.0 (or) Escape Before the Target
🧲Scalpers, take note 👀 : only scalp on the Short side. If you have a lot of money, you can go straight away; if not, you can join swing traders and carry out the robbery plan. Use trailing SL to safeguard your money 💰.
🥔🍀🍃"SoyBeans" Commodities CFD Market Heist Plan is currently experiencing a bearishness,., driven by several key factors.
📰🗞️Get & Read the Fundamental, Macro, COT Report, Inventory and Storage Analysis, Seasonal Factors, Sentimental Outlook, Intermarket Analysis, Future trend targets.. go ahead to check 👉👉👉🔗
⚠️Trading Alert : News Releases and Position Management 📰 🗞️ 🚫🚏
As a reminder, news releases can have a significant impact on market prices and volatility. To minimize potential losses and protect your running positions,
we recommend the following:
Avoid taking new trades during news releases
Use trailing stop-loss orders to protect your running positions and lock in profits
💖Supporting our robbery plan 💥Hit the Boost Button💥 will enable us to effortlessly make and steal money 💰💵. Boost the strength of our robbery team. Every day in this market make money with ease by using the Thief Trading Style.🏆💪🤝❤️🎉🚀
I'll see you soon with another heist plan, so stay tuned 🤑🐱👤🤗🤩

Using Micro Soybean Futures to Finetune Trading StrategiesCBOT: Micro Soybean Futures ( CBOT_MINI:MZS1! )
Shipping industry news recently reported that 30 U.S. soybean ships (about 2 million tons) are currently heading to China, nearly half of which will arrive after April 12th, when China's 10% retaliatory tariffs on U.S. soybeans will take effect.
How big are the tariffs? Let’s say a cargo of soybeans, or 65,000 tons, is sent to China. Assuming the trade is $10 per bushel, given 36.74 bushels per ton, total cargo value is $23.88 million. Upon arriving in China, you owe a new tax bill for $2.39 million!
According to people familiar with the matter, many cargoes are for China Grain Reserves, which may be exempted from tariffs. Soybean cargoes loaded before March 12th are eligible for a one-month grace period. Data from the U.S. Department of Agriculture on March 20th showed that the stock of unsold agricultural products in China was 1.22 million tons. Any sign of order cancellation will help us assess the real impact of tariffs.
In anticipation of the tariffs, China rushes to buy U.S. soybeans in the past two months. In January and February, China bought 9.13 million metric tons of soybeans from the U.S., up 84% year-over-year. I expect the buying will vanish by the second quarter, given new crop arriving from Brazil at much lower prices without the tariffs imposed by China.
China relies heavily on imported soybeans to crush into soybean oil for cooking use and soybean meal, a key ingredient in animal feed.
The oversupply of soybeans pushes the downstream soybean meal market to crash. According to the statistics of China Feed Industry Information, soybean meals spot market prices tumbled more than 600 yuan per ton to 3,180 since February, nearly a 20% drop.
Top feed processing companies, including New Hope, Haida, and Dabeinong, have each announced price cuts ranging from 50 to 300 yuan per ton for their chicken feed and hog feed products.
With lower overall demand, and tariffs making South American soybeans more competitive, U.S. soybeans face a shrinking export market. On my March 17th commentary “Soybeans: Déjà vu all over again”, I expressed a bearish view on CBOT Soybean Futures and discussed the possibility of $8 beans.
Trading with Micro Soybean Futures
On February 24th, CME Group launched a suite of micro-size agricultural futures contracts, including Micro Corn (MZC) futures, Micro Wheat (MZW) futures, Micro Soybean (MZS) futures, Micro Soybean Meal (MZM) futures and Micro Soybean Oil (MZL) futures.
The contract size of the micro soybean futures (MZS) is 500 bushels, or just 1/10 of the benchmark standard soybean futures (ZS). The minimum margin is $200 for the front futures month, and it gets smaller further out. For instance, the margins for May, July, August, September and November are $200, $190, $180, $170, and $165, respectively.
The smaller capital requirement makes it easier for traders to express an opinion ahead of the release of a USDA report or anticipate the impact of tariffs and retaliation.
The latest CFTC Commitments of Traders report shows that, as of March 25th, CBOT soybean futures have total open interest of 853,368 contracts, up 5% in two weeks.
• Managed Money has 89,649 in long, 123,470 in short, and 139,427 in spreading
• Compared to two weeks ago, long positions were down by 12% while shorts were increased by 12%. This shows that the “Small Money” has turned bearish on soybeans
In my opinion, micro soybean futures would be a great instrument to trade market-moving events, particularly the USDA reports. I list the big reports here for your information:
• World Agricultural Supply and Demand Estimates (WASDE), monthly, April 10th
• Prospective Plantings, annually, March 31st
• Grain Stocks, quarterly, March 31st, June 30th, September 30th
• Export Sales, weekly, every Thursday
• Crop Progress, weekly during growing season, April 7th, April 14th, April 21st
• Acreage, annually, June 30th
Hypothetically, a trader expects more soybean planting in this crop year and wants to express a bearish opinion ahead of April 7th Crop Progress. He could enter a short order for May contract MZSK5 at the current market price of 1,023. If he is correct in his view and the contract price drops to 900, the short position would gain $1.23 per bushel (= 1023-900) and the total gain is $615 given the contract size at 500 bushels.
The risk of short futures is the continuous rise in soybean prices. The trader would be wise to set a stoploss at his sell order. For example, a stop loss at $11.00 would set the maximum loss to $385 (= (11.00-10.23) x 500).
To learn more about all Micro Ag futures contracts traded on CME Group platform, you can check out the following site:
www.cmegroup.com
Happy Trading.
Disclaimers
*Trade ideas cited above are for illustration only, as an integral part of a case study to demonstrate the fundamental concepts in risk management under the market scenarios being discussed. They shall not be construed as investment recommendations or advice. Nor are they used to promote any specific products, or services.
CME Real-time Market Data help identify trading set-ups and express my market views. If you have futures in your trading portfolio, you can check out on CME Group data plans available that suit your trading needs www.tradingview.com

Soybeans: Deja Vu all over againCBOT: Micro Soybean Futures ( CBOT_MINI:MZS1! )
Let’s rewire the clock back for seven years. In 2018, trade tensions escalated between the US and China, resulting in a series of tariffs and retaliations.
On July 6, 2018, US imposed a 25% tariff on $34 billion of Chinese imports. On the same day, China immediately hit back with 25% tariff on equal value of US goods.
American soybeans were among the hardest hit by tariffs. The United States has been the largest soybean producer in the world. According to USDA data, American farmers produced 120 million metric tons of soybeans in 2017, contributing to 35.6% of the world production. About 48.2%, or 57.9 metric tons, were exported to the global market, making US the second largest soybean exporter after Brazil.
China is the largest soybean consumer and importer. In 2017, it imported 94 million metric tons of soybeans, accounting for 61.7% of the global imports. Brazil and the US were the largest sources of China’s imports, with 53% and 34% shares, respectively.
Tariffs on US soybeans punished American farmers. Total tariff level was raised from 5% to 30%. As a result, the FOB cost to Shenzhen harbor in southern China hiked up 700 yuan (=$110) per ton. This made US soybeans 300 yuan more expensive than imports from Brazil.
Tariffs priced American farmers out of the Chinese market. According to USDA Foreign Agricultural Service, China imported 1,164 million bushels of US soybeans in 2017. By 2018, China import dropped 74% to 303. While US exports recovered to 831 in 2019, it did not resume to the pre-tariff level until the signing of US-China trade agreement. CBOT soybean futures plummeted 15-20% in the months after the tariffs were imposed.
US farmers incurred huge losses from both reduced sales and lower prices. The following illustration is an exercise of our mind, not from actual export data.
• Without trade tensions, we assume exports of 1,164 million bushels each in 2018 and 2019, at an average price of $105 per bushel. This comes to a baseline export revenue of $244.4 billion for both years combined.
• Tariffs lowered export sales to 1,134 million bushels for the two-year total, at an average price of $87. Thus, the tariff-impacted revenue data comes to $98.6 billion.
• The total impact on soybean sales volume would be -51%, from 2,328 down to 1,134.
• The total impact on export revenue would be -60%, from $244.4 to $98.6 billion.
It is déjà vu all over again.
In February 2025, the Trump administration announced 10% additional tariffs on Chinese goods. This was raised by another 10% in March, setting the total to 20%.
To retaliate against US tariffs, China imposed import levies covering $21 billion worth of U.S. agricultural and food products, effective March 10th. These comprised a 15% tariff on U.S. chicken, wheat, corn and cotton and an extra levy of 10% on U.S. soybeans, sorghum, pork, beef, aquatic products, fruits and vegetables and dairy imports.
This is just the beginning. In the last trade conflict, average US tariff on Chinese imports was raised from 4% to 19%. Now we set the starting point at 39%. How high could it go? From history, we learnt that this could go for several rounds before it settles.
Trading with Micro Soybean Futures
On March 11th, USDA published its World Agricultural Supply and Demand Estimates (WASDE) report. Both the U.S. and global 2024/25 soybean supply and use projections are basically unchanged this month, meeting market expectations.
In the last week, soybean futures bounced back by about 2%, recovered most the lost ground since China first announced the retaliative measures.
The latest CFTC Commitments of Traders report shows that, as of March 11th, CBOT soybean futures have total open interest of 810,374 contracts.
• Managed Money has 101,927 in long, 109,849 in short, and 108,993 in spreading positions.
• It appears that the “Small Money” spreads their money evenly, not knowing which direction the soybean market would go.
In my opinion, the futures market so far has completely ignored the possibility of a pro-long trade conflict with China.
• Seriously, ten percent is just the start. What if the tariff goes to 30% like in 2018?
• How would soybean prices react to a 50% drop in US soybean exports?
Anyone with a bearish view on soybeans could express it by shorting the CBOT micro soybean futures (MZS). These are smaller-sized contracts at 1/10 of the benchmark CBOT soybean futures. At 500 bushels per contract, market opportunities are more accessible than ever with lower capital requirements, an initial margin of only $200.
Coincidently, Friday settlement price of $10.17 for May contract (MZSK5) is identical to the soybean futures price of $10.40 immediately prior to the 2018 tariff.
History may not repeat, but it echoes . At the last time, the tariff on soybeans saw futures prices plummeting 20% within a month. If we were to experience the same, soybeans could drop to $8.00. This is a likely scenario if tariffs were to rise higher.
Hypothetically, a decline of $2 per bushel would cause a short futures position to gain $1,000, given each micro contract has a notional of 500 bushels.
The risk of short futures is the continuous rise in soybean prices. The trader would be wise to set a stoploss at his sell order. For example, a stop loss at $10.50 would set the maximum loss to $165 (= (10.50-10.17) x 500), which is less than the $200 initial margin.
To learn more about all Micro Ag futures contracts traded on CME Group platform, you can check out the following site:
www.cmegroup.com
Happy Trading.
Disclaimers
*Trade ideas cited above are for illustration only, as an integral part of a case study to demonstrate the fundamental concepts in risk management under the market scenarios being discussed. They shall not be construed as investment recommendations or advice. Nor are they used to promote any specific products, or services.
CME Real-time Market Data help identify trading set-ups and express my market views. If you have futures in your trading portfolio, you can check out on CME Group data plans available that suit your trading needs www.tradingview.com

"SOYBEAN" Commodities Market Bullish Heist Plan🌟Hi! Hola! Ola! Bonjour! Hallo! Marhaba!🌟
Dear Money Makers & Thieves, 🤑 💰🐱👤🐱🏍
Based on 🔥Thief Trading style technical and fundamental analysis🔥, here is our master plan to heist the "SOYBEAN" Commodities Market market. Please adhere to the strategy I've outlined in the chart, which emphasizes long entry. Our aim is the high-risk Red Zone. Risky level, overbought market, consolidation, trend reversal, trap at the level where traders and bearish robbers are stronger. 🏆💸Book Profits wealthy and safe trade.💪🏆🎉
Entry 📈 : "The heist is on! Wait for the MA breakout (1045.00) then make your move - Bullish profits await!"
however I advise placing Place Buy limit orders within a 15 or 30 minute timeframe. Entry from the most recent or closest low or high level should be in retest.
Stop Loss 🛑:
Thief SL placed at the recent / nearest low level Using the 2H timeframe (1020.00) swing trade basis.
SL is based on your risk of the trade, lot size and how many multiple orders you have to take.
Target 🎯:
1st Target - 1083.00 (or) Escape Before the Target
Final Target - 1130.00 (or) Escape Before the Target
🧲Scalpers, take note 👀 : only scalp on the Long side. If you have a lot of money, you can go straight away; if not, you can join swing traders and carry out the robbery plan. Use trailing SL to safeguard your money 💰.
📰🗞️Fundamental, Macro, COT, Sentimental Outlook:
🌾"SOYBEAN" Commodities Market is currently experiencing a bullish trend,., driven by several key factors.
Market Overview
Current Price: 1036.00
30-Day High: 1080.00
30-Day Low: 980.00
30-Day Average: 1000.00
Previous Close Price: 1020.00
Change: 16.00
Percent Change: 1.57%
🍀Fundamental Analysis
Supply and Demand: Global soybean demand is expected to increase, driven by growing demand for soybean oil and meal.
Weather Trends: Weather conditions in major soybean-producing countries are expected to be favorable, potentially leading to increased production.
Inventory Levels: Global soybean inventory levels are expected to decrease, driven by growing demand and limited supply.
Trade Trends: Global soybean trade is expected to increase, driven by growing demand for soybean products.
🍀Macro Economics
Global Economic Trends: The ongoing global economic recovery is expected to drive up demand for soybeans, driven by increasing investor confidence.
Inflation Rate: Global inflation is expected to rise to 3.8% in 2025, potentially increasing demand for soybeans as a hedge against inflation.
Interest Rates: Central banks are expected to maintain low interest rates in 2025, potentially increasing demand for soybeans.
Commodity Prices: Commodity prices are expected to rise by 5% in 2025, driven by increasing demand for raw materials.
🍀COT Data
Non-Commercial Traders (Institutional):
Net Long Positions: 60%
Open Interest: 150,000 contracts
Commercial Traders (Companies):
Net Short Positions: 30%
Open Interest: 80,000 contracts
Non-Reportable Traders (Small Traders):
Net Long Positions: 10%
Open Interest: 20,000 contracts
COT Ratio: 2.0 (indicating a bullish trend)
🍀Sentimental Outlook
Institutional Sentiment: 65% bullish, 35% bearish
Retail Sentiment: 60% bullish, 40% bearish
Market Mood: The overall market mood is bullish, with a sentiment score of +50.
🍀Next Move Prediction
Bullish Move: Potential upside to 1120.00-1150.00.
Target: 1150.00 (primary target), 1200.00 (secondary target)
Next Swing Target: 1250.00 (potential swing high)
Stop Loss: 980.00 (below the 30-day low)
Risk-Reward Ratio: 1:2 (potential profit of 114.00 vs potential loss of 57.00)
🍀Overall Outlook
The overall outlook for SOYBEAN is bullish, driven by a combination of fundamental, technical, and sentimental factors. The expected increase in global soybean demand, favorable weather trends, and bullish market sentiment are all supporting the bullish trend. However, investors should remain cautious of potential downside risks, including changes in global economic trends and unexpected weather events.
⚠️Trading Alert : News Releases and Position Management 📰 🗞️ 🚫🚏
As a reminder, news releases can have a significant impact on market prices and volatility. To minimize potential losses and protect your running positions,
we recommend the following:
Avoid taking new trades during news releases
Use trailing stop-loss orders to protect your running positions and lock in profits
📌Please note that this is a general analysis and not personalized investment advice. It's essential to consider your own risk tolerance and market analysis before making any investment decisions.
📌Keep in mind that these factors can change rapidly, and it's essential to stay up-to-date with market developments and adjust your analysis accordingly.
💖Supporting our robbery plan will enable us to effortlessly make and steal money 💰💵 Tell your friends, Colleagues and family to follow, like, and share. Boost the strength of our robbery team. Every day in this market make money with ease by using the Thief Trading Style.🏆💪🤝❤️🎉🚀
I'll see you soon with another heist plan, so stay tuned 🤑🐱👤🤗🤩

Can Soybeans Survive the Global Trade Chessboard?In the intricate game of international trade politics, soybeans have emerged as pivotal pieces on the global economic chessboard. The soybean industry faces a critical juncture as nations like the European Union and China implement protectionist strategies in response to US policies. This article delves into how these geopolitical moves are reshaping the future of one of America's most significant agricultural exports, challenging readers to consider the resilience and adaptability required in today's volatile trade environment.
The European Union's decision to restrict US soybean imports due to the use of banned pesticides highlights a growing trend towards sustainability and consumer health in global trade. This move impacts American farmers and invites us to ponder the broader implications of agricultural practices on international commerce. As we witness these shifts, the question arises: How can the soybean industry innovate to meet global standards while maintaining its economic stronghold?
China's strategic response, which targets influential American companies like PVH Corp., adds complexity to the global trade narrative. The placement of a major U.S. brand on China's 'unreliable entity' list highlights the power dynamics involved in international commerce. This situation prompts us to consider the interconnectedness of economies and the potential for unforeseen alliances or conflicts. What strategies can businesses implement to navigate these challenging circumstances?
Ultimately, the soybean saga is more than a tale of trade disputes; it's a call to action for innovation, sustainability, and strategic foresight in the agricultural sector. As we watch this unfold, we are inspired to question not just the survival of soybeans but the very nature of global economic relationships in an era where every move on the trade chessboard can alter the game. How will the soybean industry, and indeed, international trade, evolve in response to these challenges?


Obvious Long on Soybeans Soybeans have been consolidating for some time between the yellow and red trend lines after finding support just above the 1500 week ma. Corn has led the market with downward action and now leads it with upward trajectory. Soy's have finally broken out of the RSI downtrend they've been in for almost 4 years. It seems obvious that Soybeans will follow corn and move to the green line at the very least. The stochastic RSI on the monthly has had a confirmed cross up signaling bu8llish momentum in the next several months. For reference corn had a confirmed cross up last fall. The price I'm expecting is 12.5 a 15-17% gain from todays prices. If corn can keep moving higher the next target for soybeans is 14ish. I will start booking my soybeans for the 2025 season if we can get a 10-15% gain from here.
I'm a farmer from Canada and have been studying charts for about 8 years now. i started implementing my TA into commodity futures a few years ago.
Thanks for reading

Beans looking to drop hard, after all... Beans have been looking weak lately, and all this current and near future trade war fundamentals and uncertainty aren't going to help at all. Volatility is likely to go up this week across a lot of markets, and the ag commodities will certainly be part of that, with emotional fears from the last market crashing during the last Trump term. Beans especially didn't fair well during that time, and the corn-to-bean ratio was out of wack to where us farmers didn't want to plant beans period. We all thought (and were told) they might go to $7 or less! All while corn was poor, but much more palatable with the breakevens. Farmers, as a rule, certainly prefer to plant corn over beans anyway, if they live where they can choose as such.
But back to the bean chart, I've been thinking there was a decent enough chance we could chop around in here and bounce off of any short term weakness and key support, to make new highs for the move. A lot of guys were looking to target the high 10s and even around $11, before expecting a notable correction. Well, unfortunately, I think we've already recently peaked and are more likely to now keep correcting down, potentially quite violently.
On Friday, the 20 day EMA gave us bounce off support, but if we get a confirmation close Monday below that (likely), my opinion is we confirm we're in a larger scale wave 3 down already, and should eventually target the 9.47 and likely even lower ultimately, before we bottom in February or March, before spring seasonality and US planting weather premium allows for us to rise again.
Longterm, for this summer and beyond into 2026, I am quite bullish grains and ultimately, expect to see new all time highs, but it's not gonna be this year. Mostly due to the likelihood of a major cycle drought of our lifetime, which could happen this year but not truly affect the supply issue drastically until new crop turns into "old crop".

What If I Told You... Soybeans Are Ripe for a Short? | COT StratFollow Me Down the Rabbit Hole: The Soybeans Market Setup for Shorts
What if I told you... the soybean market is on the verge of a paradigm shift? That the signals are all around you, hidden in plain sight, waiting for those who can read the code. The Commitment of Traders (COT) data is flashing red, and the truth is undeniable: the smart money is preparing for a downturn.
Take the red pill, and let’s decode why the path of least resistance points down.
The COT Index: A Matrix of Sell Signals
The COT Index is the Oracle, revealing the intentions of the market’s architects. Commercial traders – the ones who truly understand the construct – have loaded up on shorts at levels even more bearish than May. And they’re doing it at lower prices.
This isn’t just resistance to the rally. It’s a calculated move. A whisper in the system that the rally is but an illusion, built on a fragile code.
Overvalued in the Grand Simulation
When you step back and compare soybeans to the benchmarks of reality – gold, Treasuries, and the almighty DXY – their overvaluation becomes clear. The system’s balance demands equilibrium, and soybeans are poised to correct.
Sentiment: The False Prophet
The Advisor Sentiment Index reveals an uncomfortable truth: the herd is ecstatic. But as you’ve learned, the crowd rarely escapes the Matrix unscathed. Bullish sentiment at these extremes is a trap, and the smart money is already fading this illusion of strength.
Spread Divergence: Cracks in the Code
The spread divergence between the front-month and the next-month contracts is a glitch in the system. Short-term excitement isn’t aligning with the longer-term structure. When spreads diverge like this, it’s a signal: the construct is destabilizing.
Distribution: The Hidden Hand
The POIV (Price-Open Interest Volume) divergence reveals a pattern of distribution. The architects of the market are selling into the rally, while the unwitting masses continue to buy. The code doesn’t lie. This is the calm before the storm.
The Technical Trinity: %R, Stochastic, and Oscillator
Three powerful indicators align, pointing to an impending shift:
%R Indicator: Overbought and ready to turn.
Stochastic Oscillator: Rolling over, signaling exhaustion.
Ultimate Oscillator: Confirming the downward momentum.
Combine this with the down-sloping 52-day SMA, and the dominant trend reveals itself: the Matrix is designed to move lower.
Patience: The Key to the System
This isn’t a call to blindly short. No one escapes the system without discipline. Wait for the daily chart to confirm the trend change. Only then can you move with precision, ensuring that every move aligns with the code.
The Choice Is Yours
The soybean market is more than what it seems. The smart money, the sentiment extremes, the divergences – they all point to a single truth: this rally is an illusion. But as always, the choice is yours.
Will you take the blue pill and believe what you want to believe? Or take the red pill, follow me, and see how deep the COT hole really goes? The trend is your ally – until it isn’t. And this one is collapsing before your eyes.
Stay tuned, stay sharp, and remember: the Matrix rewards those who see beyond the veil.
Acknowledgment
The strategies and concepts taught in this class draw significant inspiration from the works and teachings of Larry Williams, a pioneer in trading and market analysis. His groundbreaking research and methodologies have shaped the foundation of modern trading education.
While this class incorporates Larry Williams’ principles, the content has been adapted and presented to reflect my own understanding and application of these ideas. Full credit is given to Larry Williams for his original contributions to the field of trading.
Disclaimer
The information provided in this content is for educational and informational purposes only and should not be construed as financial advice, investment recommendations, or an offer to buy or sell any securities or financial instruments.
Trading financial markets involves significant risk, including the potential loss of capital. Past performance is not indicative of future results. You are solely responsible for your trading decisions and should conduct your own research or consult with a licensed financial advisor before making any financial decisions.
The creator of this content assumes no liability for any losses or damages resulting from reliance on the information provided. By engaging with this content, you acknowledge and accept these risks.

SOYBEAN CFD Commodity Market Bullish Heist Plan🌟Hi! Hola! Ola! Bonjour! Hallo!🌟
Dear Money Makers & Robbers, 🤑 💰
Based on 🔥Thief Trading style technical and fundamental analysis🔥, here is our master plan to heist the SOYBEAN CFD Commodity market. Please adhere to the strategy I've outlined in the chart, which emphasizes long entry. Our aim is the high-risk Red Zone. Risky level, overbought market, consolidation, trend reversal, trap at the level where traders and bearish robbers are stronger. Be wealthy and safe trade.💪🏆🎉
Entry 📈 : Traders & Thieves with New Entry A bull trade can be initiated on the MA level breakout of 1050.00.
however I advise placing Buy limit orders within a 15 or 30 minute timeframe. Entry from the most recent or closest low or high level should be in retest.
Stop Loss 🛑: Using the 4H period, the recent / nearest low or high level.
Target 🎯: 1130.00 (or) Escape Before the Target
Scalpers, take note 👀 : only scalp on the Long side. If you have a lot of money, you can go straight away; if not, you can join swing traders and carry out the robbery plan. Use trailing SL to safeguard your money 💰.
Warning⚠️ : Our heist strategy is incompatible with Fundamental Analysis news 📰 🗞️. We'll wreck our plan by smashing the Stop Loss 🚫🚏. Avoid entering the market right after the news release.
Fundamental Outlook 📰🗞️
The SOYBEAN CFD is expected to move in a bullish direction.
REASONS FOR BULLISH TREND:
Weather Conditions: The weather conditions in the US and Brazil, the two largest soybean-producing countries, are expected to be favorable for soybean production. This will lead to a potential increase in supply, which will put upward pressure on prices.
Demand from China: China, the largest importer of soybeans, is expected to increase its imports of soybeans due to a shortage of domestic supply. This will lead to an increase in demand for soybeans, which will drive up prices.
US-China Trade Deal: The US and China have signed a trade deal, which includes an agreement to increase Chinese purchases of US agricultural products, including soybeans. This will lead to an increase in demand for soybeans, which will drive up prices.
Low Inventory Levels: The inventory levels of soybeans in the US are currently low, which will lead to an increase in prices as demand increases. When inventory levels are low, suppliers are less likely to offer discounts, and buyers are more likely to pay a premium to secure supplies.
Strong Export Demand: The export demand for soybeans is expected to remain strong, driven by demand from countries such as China, Mexico, and Japan. This will lead to an increase in demand for soybeans, which will drive up prices.
Production Costs: The production costs for soybeans are expected to increase due to higher costs for inputs such as seeds, fertilizers, and pesticides. This will lead to an increase in the cost of production, which will be passed on to consumers in the form of higher prices.
Government Policies: The US government has implemented policies to support soybean farmers, such as subsidies and tariffs. These policies will help to increase the profitability of soybean farming, which will lead to an increase in production and higher prices.
Market Sentiment: The market sentiment for soybeans is currently bullish, with many traders and investors expecting prices to rise. This will lead to an increase in demand for soybeans, which will drive up prices.
Technical Analysis: The technical analysis for soybeans is currently bullish, with the price trading above its 50-day and 200-day moving averages. This indicates that the trend is upward, and prices are likely to continue to rise.
Seasonal Trends: The seasonal trends for soybeans are currently bullish, with prices typically rising during the summer months due to strong demand from countries such as China and Mexico.
These fundamental points suggest that the SOYBEAN CFD is likely to move in a bullish direction, with prices expected to rise due to strong demand, low inventory levels, and favorable weather conditions.
Please note that this is a general analysis and not personalized investment advice. It's essential to consider your own risk tolerance and market analysis before making any investment decisions.
Keep in mind that these factors can change rapidly, and it's essential to stay up-to-date with market developments and adjust your analysis accordingly.
💖Supporting our robbery plan will enable us to effortlessly make and steal money 💰💵 Tell your friends, Colleagues and family to follow, like, and share. Boost the strength of our robbery team. Every day in this market make money with ease by using the Thief Trading Style.🏆💪🤝❤️🎉🚀
I'll see you soon with another heist plan, so stay tuned 🫂

Spot bullish to close the daily gapNearest area exactly thats daily gap ,
consider pullback in S30 area ,
daily range is +-100ticks with bull weight

SOYBEAN CFD Market Money Heist Plan on Bullish SideHallo! My Dear Robbers / Money Makers & Losers, 🤑 💰
This is our master plan to Heist SOYBEAN CFD Market based on Thief Trading style Technical Analysis.. kindly please follow the plan I have mentioned in the chart focus on Long entry. Our target is Red Zone that is High risk Dangerous level, market is overbought / Consolidation / Trend Reversal / Trap at the level Bearish Robbers / Traders gain the strength. Be safe and be careful and Be rich.
Entry 📈 : Can be taken Anywhere, What I suggest you to Place Buy Limit Orders in 15mins Timeframe Recent / Nearest Swing Low Point.
Stop Loss 🛑 : Recent Swing Low using 2h timeframe.
Attention for Scalpers : If you've got a lot of money you can get out right away otherwise you can join with a swing trade robbers and continue the heist plan, Use Trailing SL to protect our money 💰.
Warning : Fundamental Analysis news 📰 🗞️ comes against our robbery plan. our plan will be ruined smash the Stop Loss 🚫🚏. Don't Enter the market at the news update.
Loot and escape on the target 🎯 Swing Traders Plz Book the partial sum of money and wait for next breakout of dynamic level / Order block, Once it is cleared we can continue our heist plan to next new target.
Support our Robbery plan we can easily make money & take money 💰💵 Follow, Like & Share with your friends and Lovers. Make our Robbery Team Very Strong Join Ur hands with US. Loot Everything in this market everyday make money easily with Thief Trading Style.
Stay tuned with me and see you again with another Heist Plan..... 🫂

SOYBEANS - Are We Close to a Major Bottom? Cycles Say YES.Here is what I am currently watching for SOYBEANS.
-We need to be aware that there is a major bullish divergence setup (not trigger) developing on the quarterly & monthly charts. We need to pay close attention to this setup, because if triggered/confirmed, it implies a massive move up for Soybeans would be on the horizon.
-Interestingly, the Weekly chart has confirmed bullish divergence. The first target (1090) has not yet been hit, but in my opinion, it looks probable that Soybeans will hit that target (and possibly go as high as the second target (1179). This implies that I believe Soybeans is likely to rally at least 5% in the near future, and possibly rally as much as 10% from current price levels.
-I will be aggressive with taking profits on any short setups that present, due to the bullish weekly divergence that has triggered.
-Utilizing the Weekly MAC & Valuation methods, I note that this market is in an area where we can look for H6/Daily short trades. As mentioned in previous paragraph, I will utilize more aggressive targets.
-The cycles for Soybeans...wow, they are quite something. Decennial cycle suggests significant low being put in, APZ's suggest major low around October 4th, major 5 year cyclical low RIGHT NOW. Other temporary and permanent blended cycles suggest a major low right now. Composite of the 3 most similar years of price action also suggest a major low could happen soon, with a major rally to March 2025.
-A combination of the cycles and the major timeframe bullish divergences have me leaning somewhat towards calling a possible major bottom in the Soybeans market. I would prefer to see commercials COT positioning support this idea, which makes me think maybe we get another nice selloff into the August lows before the real bottom is in. But time will tell.

Is Your Summer BBQ in Jeopardy?The seemingly innocuous drought in Brazil could have far-reaching consequences for global food supply chains. As the world's largest soybean exporter, Brazil's weather patterns significantly influence the availability and affordability of various food products.
The delayed planting of soybean crops due to dry conditions in Brazil is raising concerns about potential shortages and price hikes. This could have a ripple effect on the production of meat, poultry, and other food items that rely on soybeans as a key ingredient.
Beyond the immediate impact on soybean prices, the drought could also have broader implications:
Increased Food Costs: The shortage of soybeans could lead to higher prices for animal feed, ultimately affecting the cost of meat and poultry.
Disruptions in Food Processing: Industries that rely heavily on soybeans, such as food processing and biofuel production, may face disruptions due to limited supply.
Global Economic Impacts: The drought could have economic consequences beyond the food sector, affecting trade, transportation, and employment in related industries.
The question now is: How will the global food system adapt to this challenge?
As the world grapples with the implications of Brazil's drought, it is crucial to explore sustainable solutions and strategies to mitigate the potential impacts on food security and economic stability.
