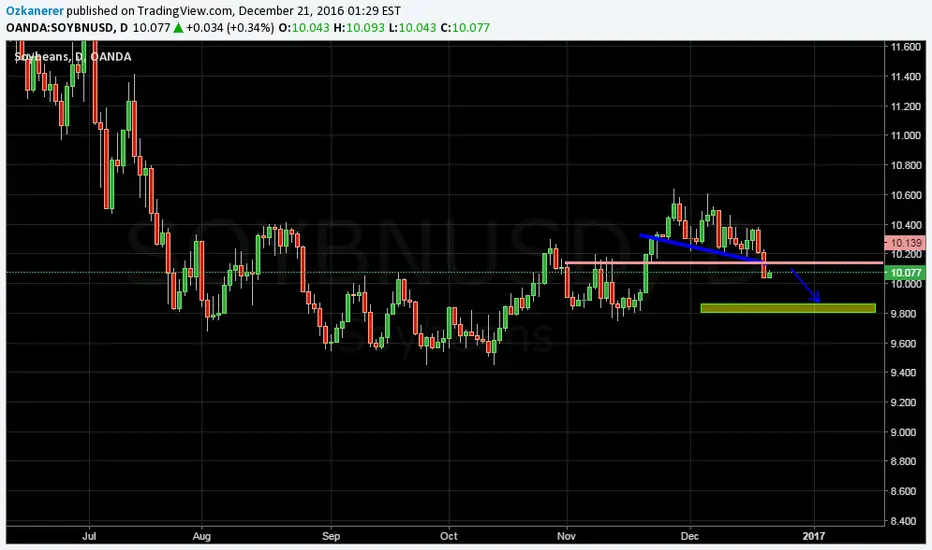
Soybeans: Potential Confluence of 2 Bearish AB=CD PatternsMy main idea here is to watch for weakness and short in the red area which is the completion of the two bearish AB=CD patterns shown in the chart. There is also a longer term downtrend line at this zone which would be a nice place to enter. At that point I will also look for divergence in my indicators, as well as check for any warning signs such as large bullish candles, etc.
For this idea to play out Soybeans still has room to the upside but there is of course the possibility that these patterns do not complete. So for the shorter term I am watching for trade set-ups in either direction with a slightly bullish bias.
Your comments and feedback are always welcome and appreciated.
Soybeans

Soybeans: My Long Term Perspective and Possible PatternsIn the chart are potential patterns which I have identified on the long term Soybeans chart. While only some or even none may complete I will be using this idea as a journal which I am planning to update every week or two regarding the patterns in the chart or any new patterns which I can identify.
If the smallest AB=CD patterns shown fail the trendline will probably have also broken, which would suggest to me we could get enough bullish momentum to take us to the completion point of some of the larger patterns. I am very interested in seeing how this chart will play out.
If you have any views on Soybeans please share it with me!

SoybeansMay Soybeans has rebounded slightly off of the 20 day moving average. A bullish flag is still intact. Will South American beans be a factor in an upsurge for this market. Time will tell. Friday didn't quite produce a "Harami" reversal pattern. The real body of the candle wasn't fully in the down candle. However, we still may see an up day tonight and into the next day. The coming week maybe a buying opportunity.


SoybeansMay Soybeans continue a bullish flag, however there could be an interpretation that 3 black crows have appeared in this flag promising more downside. There is suggestion from fundamentalists that the crop in Brazil and Argentina is now being harvested and may slow this bull run, so be cautious. A Gartley pattern would end just where the market is right now.

SoybeansMarch Soybeans were up again today, but traded back. Possible pause before heading higher to complete the Cypher pattern. See 1030 as support and the 20 day moving average at 1025'4. Headwinds will come in at 1071'6 the last top.


SOYBEAN MEAL TRIANGLE BREAKOUT IS VERY BULLISHSince october we have been moving in a sideway motion. I think this range is coming to an end. The bulls dried out the bears, and are now ready to take the price to the next level higher at 360. The impulsive breakout yesterday is paving the way for more gains to come.
Note the bullish hidden divergence, which also shows the increasingly strong hand of the bulls and the RSI breakout.
The seasonal pattern is also in favor of the bull side, from february until june is the best seasonal phase for soybean price pressure, so this might support this trade idea.
I am personally looking for a small retracement towards 320 and will look at the lower timeframes for signs to enter with a stop at 310 and the plan is to trail this position towards 360.
Please use proper risk management and dont risk too much.
Best of luck.

March Soybean MealMarch Soybean Meal is wedging down and looking to complete an bullish Cypher pattern that has been going on for quite a while. Don't be surprised if Monday is another up day followed by more chop. If bears can push it lower, look for 304.2 as a target.

March SoybeansMarch Soybeans is wedging down and is looking at a bullish Bat / Butterfly to start the next week. Wouldn't be surprised if Monday was an up day as this market is a rollercoaster. If prices continue to fall look for 966 as the first target with 921'6 as the butterfly end.

Current thinking on SoybeansI've included several charts here that high-lite some of my current thoughts on Soybeans. Starting with the monthly chart and then working through the weekly, daily, and then 4hr that has some thoughts on entry into the market to long side.
Weekly:
Daily:
4hr:

CBoT SoybeansSoybeans:
Price has developed an ascending channel during the past months with higher highs and higher lows. The latest EW count suggests that price is initiating a 3 of 3 wave which should make price a considerable move to the upside from here. Ideally, price would correct one more time to the lower and supportive line of the ascending price during next week where price should then find support at the 1020/1010 zone after which is can trade up with the 1100 mark as first target during the first half of January. The 1100 region will offer price some resistance and will probably cause a minot corrective move to the downside after which price can continue its move up towards substantial higher levels. If and when price would go down to the 985 level we will have to reconsider our bull scenario

Soybean staging for another run at resistanceIs soybeans setting the stage to make another run at an upper channel line of resistance started with the August 2012 high? Current weekly and daily action looks like this is the case. Should price continue up, how it responds will indicate if new shorting positions should be taken of existing longs can be held. Another option would be to hold longs with this line as target and then re-enter once price shows direction.
weekly:
daily:

Soybeans short into 9.550 support Good evening traders, this is on my watchlist as price is showing some deceleration mid run, 50 EMA crossing yesterday's and today's wick, might provide resistance.
Hope you liked this idea, good luck!

Soybeans: A case for biggest trade since 2007I believe soybeans are staging to have the largest run up since 2007
Daily
Since Sept, indicators (slow stoch, TSI, and RSI) have been diverging with price. Additionally, the 9 and 20 period EMA on price have crossed and turned up as well as crossing over the 50P EMA. In Oct, the ADX dropped below 0 signaling price consolidation. On 10/17, price broke through resistance pulling ADX and +DMI up over 20.
However, how does this daily action fit within the context of the weekly and monthly charts? The daily chart is bullish but is it fighting bearish weekly and/or monthly charts or running with them.
Weekly
Coinciding with this bullish daily chart is a bullish weekly chart. Going back to Sept 2015, the ADX dropped below 20 signaling price consolidation and remained there thru Mar 2016. Once price broke above resistance, it carried up 2 1/2 months. During this time:
RSI hit 80 (which is the overbought range for a bull trend)
TSI hits 100
ADX hits 45 (I consider 40 to be overbought/sold on weekly chart)
Since this high, price has spent remainder of 2016 correcting.
Now, the weekly indicators have begun to turn positive
Slow stoch has crossed and moved
TSI has moved up and is sitting at 0. A break above 0 is bullish
RSI was held at 40 which is bottom of range for a bull trend and has begun to move up
ADX is still above 20 with +DMI crossing up over -DMI signaling a possible change in dominance
Monthly
The monthly chart is bullish too. Again, the Mar 2016 move pushed indicators positive with a strong change in dominance on ADX
Slow stoch hit 80 and has pulled back during correction
TSI moved over 50 and has now pulled back toward 0
RSI pulled back from 60 to 40 and now 9P EMA and 45P WMA have turned up. I believe this next run up will take monthly RSI to 80
ADX looks like another change in dominance may happen
A green bar close above red resistance line will signal continuation of up trend
Targets: 121x, 152x, and 179x
4H and 1H charts ,
I will be using the 4H and 1H charts to trigger an entry long for soybeans.
For now, the key to watch is the 4H ADX. Recently, it hit 50 and held to the 27th of Oct. Now that it has started down, the -DMI has moved up. The other indicators have diverged with price and are moving down too.
I'm looking for this corrective action to continue setting up the resistance line on the daily chart.
Should these actions happen, I look for an entry when 4H indicators/price turn up and the daily resistance line has a green bar above it.

Buy Soybean Futures now and hold for 2 weeksThe soybean chart looks prime to push higher for the next 2 weeks. I recommend buying soybeans a 986.0 or better before the end of the week, and hold it until the end of the first week of November, or cover around 1028.0 or better.

CBoT soybeans still a sort playSoybeans:
Volumes for the X16 contract are still almost twice as high as volumes for the F17 contract but open interest went already higher for the F17 during the past week. We will roll over soon as well but still kept the X16 for this week.
Price made a 2% advance during the week which is not the end of the world but it did break our first resistance at 975 which is not what we were looking for. The most essential resistance at 994, however, remained intact and as long as that pivotal resistance has not been broken we keep our bear bias unchanged.
The most significant thing that we can see on this chart is that price has not been making any ardent moves during the past 6 to 7 weeks. After it impulsive decline from 1020 to 938 during the last week of August price has been bouncing between the 935/940 level on the downside and the, roughly, 990 zone on the upside without making any decisive moves. This, together with our pivotal resistance at 994 still being intact and the current operative EW count, is a very strong reason for us to keep our bear bias still in force. Nothing much has changed for our outlook in the chart except that we have moved on our price target in time a bit.
The pressure in the market is building up which means that we should expect a violent move on very short notice. Our preference is that same impulsive move will be to the downside with a potential of 10% decline from here. However, price is so close to the pivotal resistance that there is an increasing chance that the move will be up and that we will have to call for a long term tradable bottom in this market as well. So caution is to be added to caution and stops are to be tightened.

Long Soybeans on Consolidation BreakoutSoybeans has been supported by a rising trendline(yellow) and has just broken out upwards of the consolidation area. We should see higher prices from here on...

Soybeans anticipating pullback on daily before moving higherI'm watching soybeans for a pullback on stoch and for ADX to move over 20 with +DMI holding. A move up in price after this scenario could be a buy signal.

CBoT soybeans keeps its bear scenario for nowSoybeans:
The first essential resistance of 975 was not broken but price certainly knocked on its door during Wednesday's and Friday's session which makes us to add caution to caution with our outlook for this chart. Basically the week showed a jigsaw candle that did not break the resistance on the upside and did not take the previous low on the downside. In other words: no decisive move was made during the past week. Price is also moving with an ending diagonal already since the second half of August. An ending diagonal principally is a reliable continuation pattern from where price usually breaks out at 2/3 to 3/4 of the diagonal which, ideally, would have happened last week but could still happen next week.
In short: nothing really shocking happened during the past week and, even though we did not see the expected decisive break to the downside, the bias remains unchanged to be bearish. As long as the pivotal resistance at 994 remains intact we have no reason to change our opinion.

CBoT soybeans remain a short playSoybeans:
We will roll over to the JAN17 chart as soon as JAN's volume starts equalling NOV's volume.
Again no decisive break of price during the past week which is something that we have been waiting for since some time now. The weekly chart (not displayed/attached) shows us again a 'spinning top' candle which principally expresses indecisiveness of a market and which still leaves the door for our bear bias wide open. Last week's 'spinning top' candle had a relative long topping tail which indicates that the bull forces ran our of power during the process of trading up. Even though it does so less than perfect, price still reasonably follows our preferred path that we drew on the chart three weeks ago and we keep our bear bias unchanged. A break of the most recent low at 934 will give price an acceleration to the downside. Last week's high at 975 represents a resistance value that we would not like to see broken and a break of the 994 resistance will negate our bear bias outright and will send us back to the drawing board.

CBoT soybeans still bearishSoybeans:
We were expecting that price would break down through the lower boundary of the sideways channel at 935/940 but price continued trading sideways during the week although price took out its most recent low during last Tuesday's session. This break of the most recent low at 937 was not followed by further decline though.
The weekly chart (not displayed) shows a 'spinning top' for the past week which indicates indecision of the market and which keeps the door wide open for further decline. We maintain our bear bias for this chart and expect, again, that price will now decisively break out to the downside of the flat sideways during the coming week. The next challenges are the lows at the 916/910 zone of early April after which the 880 level comes in sight as first target.
