Soybeans Long PlayPrice did not make the corrective move down to 975 during last week as was preferred by us but rather traded a sideways pattern between, roughly 1010 and 1050. It doesn't change our general expectation of the development of this price but we need to adjust our preferred path a bit. We take our view to the upside from here and have a bias with 1100 as target which we would like to see reached latest by the end of May. If price breaks the 1000 level, however, we will have to go back to the drawing board again and start considering the correction down after all. For now we are in for a 5% swing up from current levels.
Soybeans

RunningAlpha Upgrades Commodity Markets Update to Priority ListRunningAlpha dot com Capital Markets Intelligence High Priority Update for Monday, May 2nd, 2016
Although $39 and $36.50 remains baseline intermediate to long-term support for Light Crude Oil ( in reference to June Contract Pricing ), the recent advance upwards has opened the door for a further short covering rally upwards to $62 to $65, and perhaps $74 to $76 levels if on a spike. Bullish window for buying on dips extends into at least June period -- this also applies to Brent Crude. Russian Stock Market ( $RSX ) looks bullish during this period. Oil and Gas Drilling stocks will likely continue higher on balance -- particularly a core position in stocks like $PBR.A would be sensible, which should also benefit from a continued bullish run in Brazilian Equities ( which I expect Brazilian equities should trend higher into the summer, and again later in the fall to close out the year much higher ). Among many other equities in Latin America, $ARCO and $KOF also have a strong bullish bias with sentiment conviction windows extending into foreseeable future.
Other Commodity Markets showing very significant sentiment strength going forward are in the Agricultural complex -- Soybean, particularly Soybean Meal $SOYB, Rice, Corn $CORN, Cotton $BAL and Coffee ( $JO is ETF -- when above $18.02 and especially when trading above above $19.00, then $27 is interim target ), and even wheat to some degree. Equities that would benefit from a rise in these commodity markets should have a tail-wind. Silver and Gold stocks, which RunningAlpha.com has been bullish on for a few months now, still shows signs of strength on pullbacks. Sourced from premium sentiment conviction list on RunningAlpha dot com

SoybeansSoybeans:
Price has made a strong move up during most of April but is now running a bit out of breath and needs a correction before it can make another move up. Price is now in a 4 of (3) but has not made a decisive move yet to complete same 4. Ideally, price will make a move down to 975 during first half of the coming week before it reverses and develops its 5 of (3) which should take price up to the 1100 level during the remainder of May.

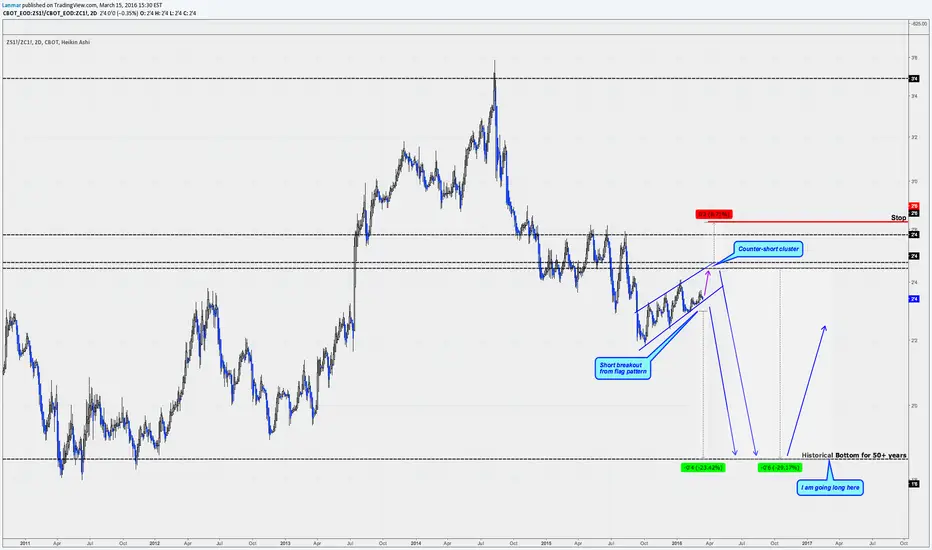
Follow up from post 14 days agoExhibition has correctly predicted the break out from the sideways range of Soybeans. Let's see how high can this thing go.


Short Soybeans against Corn long termThe soybean/corn spread presents a great opportunity to short into historical lows.
Soybeans breaking up after accumulation Soybeans today gapped up after friday closed obove the broken trendline. Im going long here because softs are way behind metals and energy, black line is comparing with commodity index


ZS looking more and more tempting.A little lower and Im not sure I could resist a low risk (punt).
If it doesnt, I will look to enter on a decisive break of the upper band of the L/T down channel.
Break of HZ support, will look to enter.
Still will be a great trade for 2016 either way


Still waitingAnother commod that looks like primed for a big move. Just waiting for the U$ to decide


ARSUSD: Long pesos, yes...long.Here I am with a little contrarian idea.
There's a nice 15% spread to be filled when comparing the Argentine peso to the other South American economies.
The stock market also took a nose dive and is poised to retrace, since it's possible that live cattle and soybeans will head up from this point (and the Merval has a healthy correlation with those two among other agriculturals, for obvious reasons).
That being said, to my fellow countrymen, this is a nice low risk trade, upside is 15%, downside is merely 2%. Sell dollar for 13, buy back at 10-11, give or take, and or invest in other assets once we reach that target.
Good luck,
Ivan Labrie.

How about some "POP" Corn?Corn is ripe for the picking and ready to POP. With glut of corn in silo's we like the downside...BUT, this can either way. Be nimble. We expect a nice 6-8 day run.

Soybeans - Look at this interesting chartLook at this really interesting chart of Soybeans. I entered long Corn almost a week ago and I was waiting for a good signal on soybeans. The price reached the rejection line of the descending channel. Volumes dropped on the last down move, and the 14 periods RSI shows a strong divergence. I believe a break back above 900 dollars would be a strong bullish signal.

Bullish momentum as a consequence of weather conditionsJune brought an abundant wave of relentless storms, almost double the normal monthly rainfall, and a strong rally in grain prices. The wet conditions have spurred a long list of concerns for U.S. farmers and U.S. crop conditions substantially deteriorated in the final two weeks of June, according to the USDA.
Nitrogen leaching and the lack of days available to spray post emergence crop protection chemicals are two of the major concerns affecting crop conditions. Weed, pest, and disease pressure may all increase as the growing season progresses due to the deadly combination of wet and cold weather after planting, followed by delayed spraying.
Also, soybeans are known for an inverted correlation with the US dollar.
Sources:
www.investing.com
www.investing.com
www.whig.com
www.signalfinancialgroup.com
www.investing.com
Commodities are less risky than forex and stocks, but beware of consequences if you trade on other's people ideas anyway.

$SOYBEANS: TARGET 1 COMPLETE!See out PLAN SETUP:
I do appreciate all views be it a like or comment, and if you subscribe to this analysis, you will receive all of our real-time update! Thanks!
SignalSuisse

Corn is CooperatingWe may have missed the Crude trade however, Corn is a different story. We are expecting Corn to trigger today. Our targets are listed. If Corn triggers and then closes inside the wedge we will close the trade, otherwise our targets are posted. Stay tuned

Time to pick some CornCorn has broken and closed below it's wedge on a weeky time frame. We are looking for pullback triggers to get involved to the short side. Targets are identified and the stop will come from the trigger (on a 60 or 240 min chart)...NO TRIGGER, NO TRADE!

Weekly setupCorn on the weekly chart is coiling and setting up for a great move. As we always say ...if you want strong moves that will last longer than a day then you need to watch the weekly charts. It takes patience to wait but they are nice when they explode. Stay tuned.

Soybean (ZS) Testing Downchannel/Descending Wedge ResistanceAfter a two week rally, soybean (ZS) is now bumping into downchannel/descending wedge resistance on the weekly chart, which coincides roughly with the 1000 psychologically key resistance level. Weekly RSI and Stochastics are in rally mode, while the MACD which a few weeks back appeared ready for a negative crossover has strengthened again and is sloping up now.
For my multiple timeframe analysis on ZS, feel free to visit: tradablepatterns.com
Website: tradablepatterns.com
FB: facebook.com
Stocktwits: stocktwits.com
Twitter: twitter.com
Linkedin: www.linkedin.com
YouTube: www.youtube.com
Google+: google.com
Email: info@tradablepatterns.com

The squeeze is comingAbove 998 and the squeeze will have shorts scrambling. A close above this area and we will be looking for triggers long.

ZS upward "C" wave to come (???)Soybean has been a tough market for those traders seeking volatility as it has been on a “wait-and-see” mode for a couple of month now. I do not expect any major movement on the short/mid run; however, I do see a possibility to “widen” the current trading range.
The wave counting above suggests that a B wave would be completed (or nearly completed) and a possible upward C wave would be on the radar screen. For those (unlike me) seeking short-term opportunities it may be a good commodity to keep track on.
I am still holding my long position with stops on a range around 920, although I confess the weekly chart does not look that bullish. In fact, the MACD divergence is killing my sleep lately.
See my comments on ZC at:
