Savage bull likely pulling back next weekImpressive and incredible bull-run from the lows but it's time to be cautious & patient at these levels.
- Hovering near the top of a 6 month resistance TL.
- The run seems to be overextended with RSI's overbought at nearly all longer timeframes.
- Trading way over the 10 & 20 day EMA's, unlikely to sustain at this pace for much longer.
- The SPX gap between 4020 and 4047 will certainly be filled; NDX gap-ups have fueled this rally.
- Decreasing volume & SMA approaching spike zone.
- 6-hour volume weighted MACD cross-over signaling potential reversal soon. The most recent 5 cross-overs always followed with a pullback as highlighted.
I'm not bearish, there is no reason to be bearish as this market can still grind higher but it's foolish to also believe the market won't take a needed breather in the process. ES levels from 3970-4010 are more likely to be tested sooner than later.
Note: I am not neglecting the possibility of a rally running into big tech earnings towards the end of the month; market never fails to surprise.
Trade safe!
Sp500analysis

SPXI think a nice correction back here to the inverted head & shoulders neckline is coming. Would be super bullish and set up for the next parabolic move towards 4600.
We have the Fed buying bonds 20-30yr in order to implement YCC. We have also the fed stating the inflation is not a concern. (Which is B S IMO)
We have a reopening economy, entire world soon to be vaccinated if not already and Trillions of dollars in stimulus money floating around looking for a vacation and some DOGE coin entries.
Don't be a stupid bear and buy the dip like BIG MIKE Fam!
As always BIG MIKE PERMA BULL loves you guys and hopes we all get rich AF. ;)


Big move incoming in the coming weeksThe S&P 500 Vanguard Euronext is about to make a big move in the coming weeks. Target 62.4 euro (bottom of the wedge) in the bearish scenario and 68.5 euro in the bullish scenario.

SP500This looks Short term toppish to me guys I expect a break thru and a run to 4600 but to expect a quick push to 4600 is a bit naive IMO

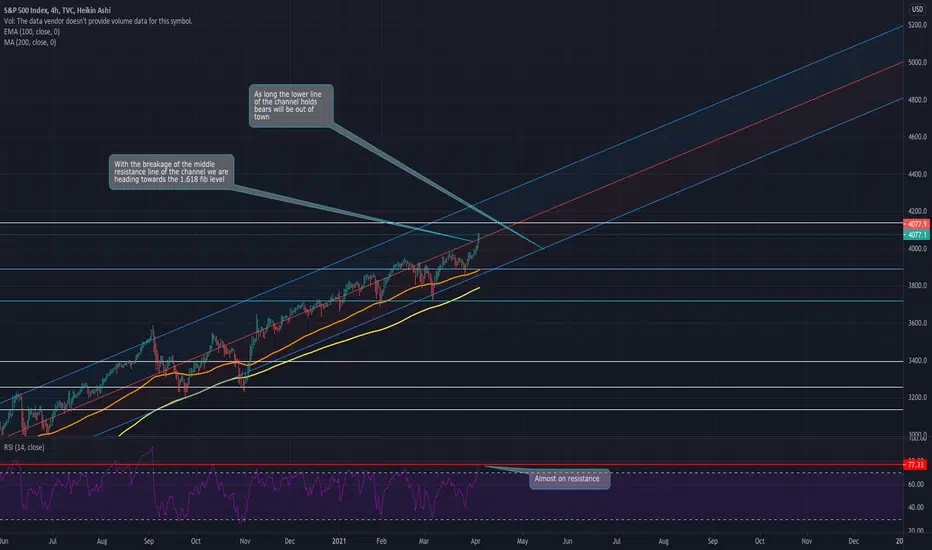
SP500 On Steroids With No signs Of PullbackHello everyone, if you like the idea, do not forget to support with a like and follow.
SP500 made a new high yesterday and it's looking to make new ones until the Friday closure.
We are heading to 1.618 fib level after breaking the middle line of the channel.
A breakage of the 1.618 level will take us to retest the upper trend line of the channel.
EMA100 seems to holding nice as a support and MA200 yet to be touched from November.
Overall very bullish but until when ?
Beyond technical levels, the S&P 500s already bullish backdrop has strengthened on the start of April and all technical trends continue to point higher.
I will updating this idea, stay tuned.
Thank you for reading my post, have a great day, wish you all the best !
Information provided is only educational and should not be used to take action in the market.
Feel free to ask anything in the comments :)

SPX's Elliott wave count weekly,for the RSI deep & crazy stuff !Guys it is probable now, that we might have and extended first wave count !!!. Comparing
2009's bottom and Covid's bottom we have very clearly identified two sets of Elliot counts
one is Text book count (2009), and the other is since Mach's low and it is still in progress !!!
Both are for the RSI (Not SPX's price ) . If this plays out, it would be just insane to say the
least. whether it happen or no is something else. Lets follow this with an actual Elliot count
for SPX's price and see how does the RSI count follows the actual SPX's price. Either way,
this is just another attempts to figure out our location in this "Universe" of SPX :-) .
I really guys, pray, you are digging what i am trying to tell you and chart before you .
So, what does it mean if we are extended in wave 1 .Well, the Elliott guide are here
to explain to us what is next to be excepted.
Fibonacci Retracement and Extension Guidelines:
If wave 1 is extended, then the size of wave 3 through to the end of wave 5 is often 61.8% – 78.6% relative to the size of wave 1
If wave 1 is extended, then wave 2 and 4 are very likely to be shallow (i.e. 23.6% – 38.2%)
If wave 1 is extended, then wave 2 will often end at the level of sub-wave 4 of 1 (i.e. the internal wave 4 of wave 1)

SPX's Since 1957 Inception's day & before 'SHOCKING STUDY'"Unbelievable results, Could that be possible. This will make All technical and wave analysis = Worthless ;-)

US 500 UPDATE.. As predicted on the 11th, S&P IS GONNA FIGHT ITS WAY THRU THE CURRENT RESISTANCE AREA AROUND $3985.
IF price can breakout of this restricted area it could reach 4035 before any sight of resistance will be near.

SP500 - The Phantom Menace (Episode I)As can be seen in the graph, after the pandemic, it collected rapidly and it seems that it will continue the rising wedge movement to the end.
If the targets for the future will not be 4000+, we can see a very sharp decline as a result of the rising wedge formation from here. In this sense, it would not be wrong to expect the prices to fall back to 3000 levels due to the formation target. However, this 25% decrease would be a disaster for the financial markets.
The place to enter the game is as important as where and when we exit the game. It is useful to be careful, especially in light of these inflationary expectations. TVC:SPX
It contains only personal views and opinions. Does not contain legal investment advice ...

SP500 Lifetime OpportunityHi there,
SP500 at the moment is a clear buy with target above 4000
If we pay attention to the DXY chart, we are starting a uptrend but still on sideways moment, which SP500 due to many retails shorting it, has been making new highs every week, as long as dollar is weak it will keep doing it, but dollar is soon ending this sideways market to start an uptrend.
SP500 then will top at that moment
If we look at the elliot wave theory, we are in the final phase, Blow off, close to a top to begin then a new trend.
This is a long term view, if your looking to sell it, sell only at the mentioned wave 5, near it.
Good luck

SPX500 Short SetupSPX500 Short Setup
🔵 Entry: $3,885.0
🟢 TP & RR: $3,787.4 (1.91)
⛔ Stop Loss: $3,936.1
Trade Reasons:
✔️ Price bounced off the upper trendline
✔️ Price still ranging within the triangle
✔️ Somewhat overbought levels

SPX's P/E Probability game Average crash 42 % Median crash 37 %All Major crashes since 1902:
-------------------------------------------------------------------------------------
Year % Crash P/E@ Beg. P/E@ End Days lasted
2020 35 % 26 19 28
2007 57% 21 120 490
2000 50% 27 29!!! 763
1987 36% 21 13.7 28
1980 28% 9 9 609
1973 49% 18 7 609
1968 37% 18 13 483
1961 29% 22 16 147
1937 57% 16 8 1855
1929 84% 18 9 973
1916 37% 7 !!! 14! 1708
1909 28% 13.65 14.54 1764
1906 37% 13 9 637
1902 29 14 11 364
--------------------------------------------------------------------------------
Extra Info:
All reading Above 21 P/E
-------------------------------------------
April, 19 - Presents
March, 15 - October, 18 crash
November, 07 November , 09 crash
June , 97 January , 04 bull
August, 91 November, 93 bull
July 87 July 87 crash
March, 61 November 61 crash
April 46 July 46 crash
May 33 March 34 correction
October 21 December 21 bull
--------------------------------------
statistic wise, 66.33 we will crash/correct
33.33 bull market (Excluding present time)
----------------------------------------------------------------------------------------
Tips:
***Only 2 times in history we got reading
as high as now.
1/ Current reading is 37 P/E
2/ similar reading
A. October , 2008- December 2009 End of a crash
B. October 2001 - May 2002 last 1/3 of a crash
-----------------------------------------------------------------------------------------
summary:
Probability game is :
Average crash 42 %
Median crash 37 %

SPX's weekly update. First week of March 2021In coming months Puts will be bought, with "Golden Cross" on PC.
wish you all the best.

SPX500 back at important support area! watch for opportunitiesAfter forming the first real lower high, the market pulled back to this important support zone. This could be indicative of a bearish new trend if that support is broken or price springs back up to form another lower low. So bulls beware. Exercise caution when trading in the next several sessions until the stimulus bill is passed or rejected

S&P500 Short SetupS&P500 Short Setup
🔵 Entry: $3,934.7
🟢 TP & RR: $3,903.0 (1.46)
⛔ Stop Loss: $3,956.4
Trade Reasons:
✔️ 1.618 Fib Extension
✔️ Reached previous resistance level

S&P 500 Long PositionS&P 500 Long Position
🔵 Entry: $3,886.0
🟢 TP & RR: $3,929.1 (2.44)
⛔ Stop Loss: $3,868.3
REASONS FOR THE TRADE
✔️ Market Flow Green
✔️ Higher low on lower time frame
📝 I am expecting a small retracement upwards before price continues to go down. The second order I am looking to open is for a short at the $3,914.0 level.


LOADING UP ON TNA TNA which is the Direxion Daily S&P Small Cap 3x leveraged is an ETF that I just came across. I usually trade TQQQ and SPXL while carrying a small position overnight in order to mitigate my risk from daily rebalancing of the leverage ETFs. TNA has run up under 980% since the COVID - 19 sell off and is approximately 40% above its pre - pandemic high. I have heard that small cap stocks will lead the charge up or down before there's a market turn in the S&P 500.
I'm looking at two entry points for this ETF. My first entry point will be at $89.92 and my second position will at $71.32. Due to TNA being a leveraged ETF the goal is to take a small position relative to my account and potential day trade the TZA (the inverse) or TNA with a larger position. I am very bullish on the market and I am loving the pullback that we are experiencing. Based on past analysis, TNA hit a resistance and then pulled back towards a support at $71.32 before breaking through its resistance - and now support - at $89.92 creating a new resistance. The sell off from the resistance at $104.14 looks healthy but I am looking for a bounce off of $89.92 here. TNA is holding its 15 and 50 day EMA strongly after breaking below its 5 day EMA. I will cut my position and turn bearish on TNA if we break below the 50 day EMA. This is the first post that I have made and I am looking to create more whether my analysis is correct or wrong. Thank you in advance for any feedback that readers provide me with as I am looking to do this full time!

S&P500 - The "Mayan Calendar" Chart Fearing an upcoming crash / correction I've been looking at all the key indexes etc, and this was one of my earlier explorations using Fibonacci.
I look at this chart with a large pinch of salt, more a fascinating oddity than something scientific (maybe!), but I do find all the correlations very interesting.
Ultimately this connects well with my Vix & Gold charts in regards to overall cycles so I do pay attention to this and it's progression.
Time will tell! Enjoy this "Mayan Calendar" chart as it was jestingly called on Twitter ;)

S&P500 2021 - Signs Of The Impending CorrectionThis is a another chart where I've look for clues in different ways this time on if / when a correction / crash may happen.
All correlating with what has been found previous imo.

S&P500 Long SetupSPX500 Long Setup
🔵 Entry: $3,911.9
🟢 TP & RR: $3,954.0 (2.48)
⛔ Stop Loss: $3,894.9
REASONS FOR THE TRADE
✔️ Market Flow Indicator went green
✔️ Trade in direction of the trend
📝 Not much to analyse here aside that it's a trade based on my system. With that being said the price may drop down to the support level, where I will be looking to open a long order again.
