If you already sell, then now even more! #SP500We recommend a sell signal although the trend is bullish and very risky to trade against the trend, the reasons are:
1. In the daily graph, we have a Double top and a stochastic that started its decline.
2. On the weekly chart according to the Stochastic, we are completely overbought (looking at the past we can see that this did not always cause significant declines)
3. On the monthly chart according to the Stochastic, we reach the last top line of the overbought
Our target 2775
Current price: 2928
Sp500analysis

S&P 500, Trading plan1. I will open buy if the price will make a pullback to 2860
Because there is a huge chance that it will happen
The goal will be before historical high 2942
2. Near 2942 I will open Sell if there will be a fake broke
Mostly price bounce 1st time from such powerful levels
In that situation potential profit could be in 10 - 20 times bigger than a risk

S&P 500, Trading planI will open Sell near 2817
- Berish outside candle which stopped all up move
- Near key level low risk

SPX SP 500 LONG But possible Trendchange to come
Hello to all who follow my charts.
Today has been an interesting day.
Of course, the S & P 500 was still long and continued up the long trendline
But today we experienced a reversal day and that always does not bode well for the respective trend direction.
The day started normally, then went much higher in the end but to go deeper from the market. A reversal just.
Often, such a reversal day announces a turnaround.
So please be careful with long positions currently.
We have to see tomorrow what happens.
If SP 500 continues to move up the trend line, negate the Reversel signal or begin to tip over the trend lines.
We will have to take a close look.
Currently, the long scenario is definitely at risk.
----------------
--This information is not a recommendation to buy or sell. It is to be used for educational purposes only .Alllways do your own research---
----------------

#SP500 On the way to another summit?As can be seen in the graph above, resistance has been breached and as you know we have a simple rule if support or resistance breaks it is very good to enter the market in this case we recommend buying with a target price of 2940 At this price, the sp500 will have a real test and we will see whether it will pass it successfully or that it has created a double top pattern
Buy sp500:
Entre Price: 2845
Stop loss: 2790
Take Profit: 2940

SPX LONG S&P 500 Taken out The Resistance on Daily ViewHello to all who watch my charts.
Contrary to the opinion of many here is in my view S & P 500 a Long Setup.
As you can see we had it at the beginning of March
a short trend which I marked with the orange trend lines.
Now, however, the index has risen above all short resistance and has both major resistance levels
which I marked purple. In the near future no direct resistance is to be seen.
Next is at around 2870
That's why I see these Index in a long trend.
To be cautios here , its needed that SPX fall below
2800 and
2786
at end of day chart
If that wil happen the long setup is gone.
----------------
--This information is not a recommendation to buy or sell. It is to be used for educational purposes only .Alllways do your own research---
-----------------

#sp500 follow closelyWe are very close to a very sensitive area on the sp500 as you can see in the graph above Every time the sp500 touched this resistance it fell sometimes small fell and sometimes more long falls. We will continue to follow and respond when necessary

S&P 500, Trading plan.Near 2785 is a good place to open buy entry
- Price broke up key level 2783
- Daily candle close above
- Risk/reward 1 to 4

Which side will the #sp500 choose?For the past 14 days, the price of the S & P500 has been stuck between 2767 and 2813. We believe that because of the wait for Trump and China, will they reach an agreement or not? If the Chinese and the Americans reach this agreement, it is good for sp500 and if not is bad, All this in terms of Fundamental Analysis, In terms of technical analysis we see in the graph above that we are really close to serious resistance, in case the sp500 will succeed in breaking the resistance the increase in the index will be serious, Since we are at the bottom of the last 14 day range and the trend is uptrend we recommend buying with a lot of caution
Buy SP500:
Stop loss: 2760
Take Profit: 2910

sell at 2746 with 2 tp before end weekmuch overbought in short time
face biggest resistance
market euphori on shutdown and trade talks but nothing is done,is buy the rumour for now..so investor will surely take some rofit sonnest

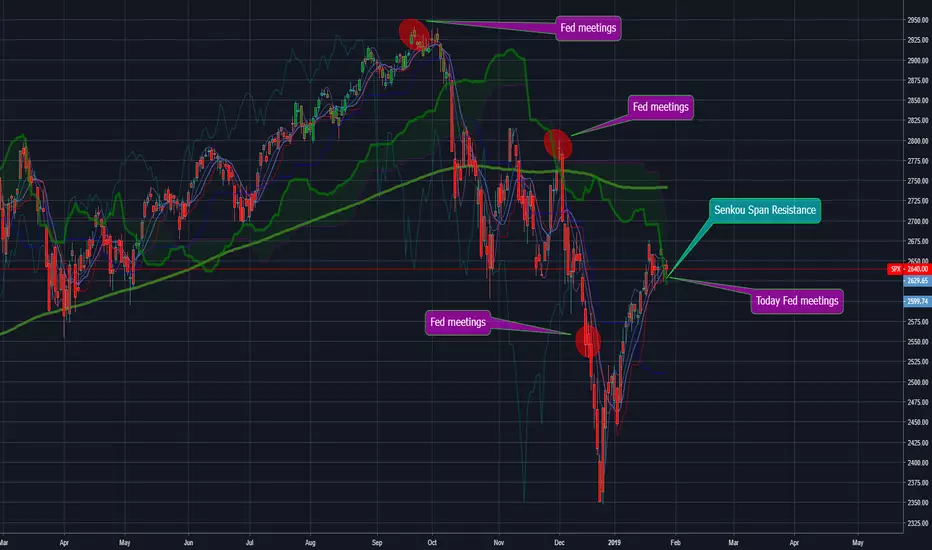
#S&P 500 INDEX SignalAs you can see in the graph above in the last three times of Fed meetings The market dropped, Today there will also be a meeting of the Fed so we recommend opening a sell position and continuing the trend of meetings, The second (sell) reason is the line of resistance of (Ichimoku Indicator) Senkou Span
sell S&P 500
Entry Price: 2655
Stop Loss: 2703
Take Profit: 2400

sp500 waiting for a sonnest clear signal in basic chart set -upthe pattern of the sp500 is clearly showing that he waiting for a soonest clear singal for to know if we go long or short
basic chart reading- good for beginner who ant study this basic chart setup

Bullish market is on the run. SPX Euro hedged analysisLet's take a look at a different angle on multi year SPX run - SPX Euro hedged.
Almost 45 years of bullish market with price action in only the one upside channel, with 2 exceptions that were resulted to US recessions .
So what about 50% decline to early 2020x.

Bearish Reversal on S&PMirror Channel Down pattern developing on 1D as 2,741 has been priced as the latest Lower High (ADX = 21.036) on the current 2018 bear cycle. 4H has already initiated its Channel Down (Highs/Lows = -10.9821, BBP = -14.4680) with only MACD = 8.280 supporting from further downtrend. Expected targets are the supports (2,697.60 and 2,680.50 the most immediate).
