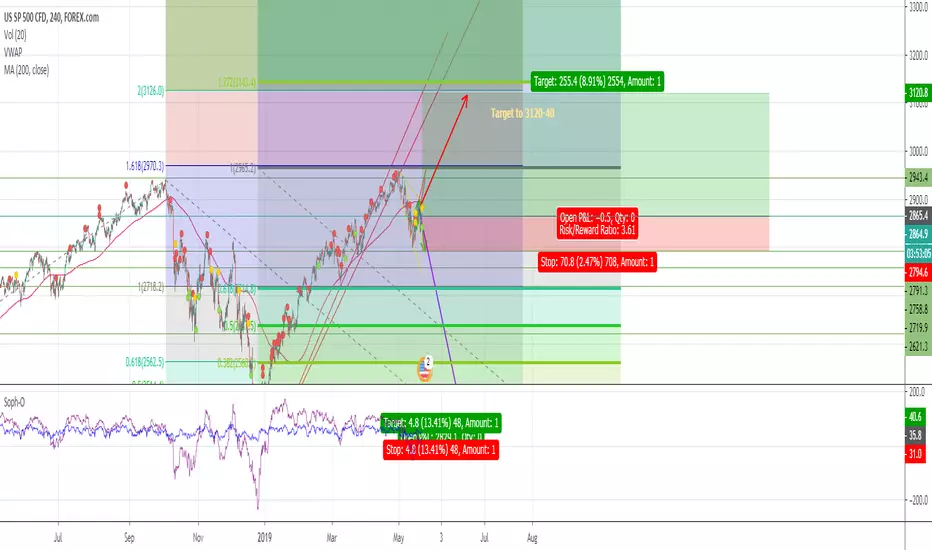
A.I. Powered Morning Trading Plans - OutcomesThe chart depicts how the trading plans published in the morning - idea published on TradingView at 9:52am - tracked the market action. You can read the detailed results tracking at our site tradersAI.
Hope you all had a good trading day, and if not, remember that tomorrow is another day of opportunity to utilize the lessons learned and the experience gained. Good night!
Sp500future

SP500 more sell off.. but first : a test of the small H&SSP500 more sell off.. but first : a test of the small H&S

[UPDATE] SHORT S&P500 TD Sequentials, Aggressive 13 Has AppearedComments included within Chart and 'Link to Related Ideas' directory. As predicted this 2.9K range was the local top for now.


S&P 500 E-Mini Future Long +692 TicksThe S&P 500 E-mini Futures Daily time
frame is in an up swing with a fib extension
price point 3022.75 about +692 ticks away.
The Daily time frame is at a low price and
at the back side of the old down trend line.
I am going to turn to the smaller time frames
and will look for up fib wave movements and
buying trades towards the daily target.

SP500 Sitting on the 50MA. Striking Similarities with 2018SP500 Futures are sitting right on the 50MA at approximately 2862 this morning before the open. Striking similarities with the 2018 fractal. The market topped, paused briefly on the 50MA. Upon breaking the 50MA, the market plummetted nearly 392bps in a single session on a red 5 candle (TD indicator), which is exactly what it's setting up to do now. If the 50MA is broken, watch out below.

S&P 500, Trading planOpen buy near 2942
- Price broke Up Historical high
- Daily candle close above
- The main trend is bullish
- Price still in upward channel
That`s why I think that the bullish trend will continue

ES1!, S&P 500 E-mini Futures: Forecast on H4. ES1, S&P 500 E-mini Futures: Forecast on H4.
- Triangle pattern on H4=> UP

SP500 SPY ETF supply and demand analysis and forecastSP500 QQQ ETF supply and demand analysis and forecast for 22nd April 2019. SP500 SPY ETF is trying to break weekly supply at all time highs around 293.
There is a clear long term weekly and monthly uptrend with all time highs previously eliminated and brand new demand zones created on bigger timeframes like the one on the weekly timeframe around 281.
In an uptrend, supply levels are eliminated and demand levels are created and respected.NASDAQ QQQ ETF has already broken all time highs, expecting to see similar price action on QQQ and other american indexes like Dow Jones and Russell 2000 indexes.The bigger the impulse created by new imbalances of demand the better. There is no reason to go short counter-trend on SP500 SPY ETF when everything is heading north and new demand levels are being created. Trading with the trend is always higher odds.

S&P500, You've got 2 options to decide where we areHistorically examining price action on S&P500, we've got one of two scenarios unfolding currently. We could be facing a repeat of Red arrows or Green arrows.

ES1!, S&P 500 E-mini Futures: Forecast on H4.ES1!, S&P 500 E-mini Futures: Forecast on H4.
- Triangle pattern on H4=> UP

#SP500 On the way to another summit?As can be seen in the graph above, resistance has been breached and as you know we have a simple rule if support or resistance breaks it is very good to enter the market in this case we recommend buying with a target price of 2940 At this price, the sp500 will have a real test and we will see whether it will pass it successfully or that it has created a double top pattern
Buy sp500:
Entre Price: 2845
Stop loss: 2790
Take Profit: 2940

SPX LONG S&P 500 Taken out The Resistance on Daily ViewHello to all who watch my charts.
Contrary to the opinion of many here is in my view S & P 500 a Long Setup.
As you can see we had it at the beginning of March
a short trend which I marked with the orange trend lines.
Now, however, the index has risen above all short resistance and has both major resistance levels
which I marked purple. In the near future no direct resistance is to be seen.
Next is at around 2870
That's why I see these Index in a long trend.
To be cautios here , its needed that SPX fall below
2800 and
2786
at end of day chart
If that wil happen the long setup is gone.
----------------
--This information is not a recommendation to buy or sell. It is to be used for educational purposes only .Alllways do your own research---
-----------------

ES FUTURO DEL MINI SP500 CORTOSResistencia clara entorno a los 2800 , con posible retroceso definido.

#sp500 follow closelyWe are very close to a very sensitive area on the sp500 as you can see in the graph above Every time the sp500 touched this resistance it fell sometimes small fell and sometimes more long falls. We will continue to follow and respond when necessary

Which side will the #sp500 choose?For the past 14 days, the price of the S & P500 has been stuck between 2767 and 2813. We believe that because of the wait for Trump and China, will they reach an agreement or not? If the Chinese and the Americans reach this agreement, it is good for sp500 and if not is bad, All this in terms of Fundamental Analysis, In terms of technical analysis we see in the graph above that we are really close to serious resistance, in case the sp500 will succeed in breaking the resistance the increase in the index will be serious, Since we are at the bottom of the last 14 day range and the trend is uptrend we recommend buying with a lot of caution
Buy SP500:
Stop loss: 2760
Take Profit: 2910


SP500 FUTURO ES LONGMantenemos la idea de continuidad alcista con la ruptura del viernes pasado, hasta alcanzar el beneficio 1 a 1, para desplazar el stop loss y consolidad beneficios.
www.yatrading.com
www.yatrading.es

SPX500 Reversal setting up (Possible Short)SP500 have been trading with in a multi sessions bullish channel with price action just making marginal highs, current price action approaching almost the top of the resistance channel where I am seeing fresh falls taking place.
Higher time frames picture is still bearish with momentum on all across the bigger picture still bearish. Keep an eye on this market for a possible good medium term trade.
Good Luck.

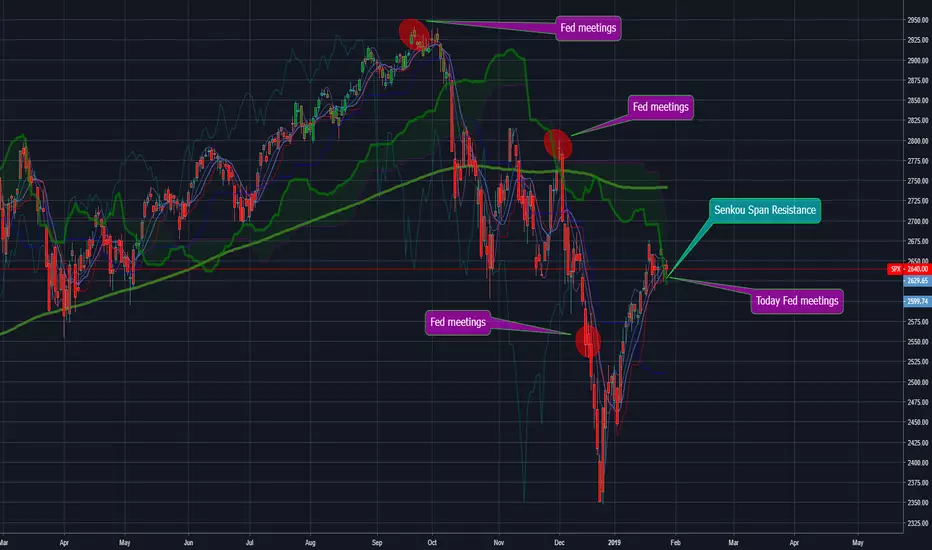
#S&P 500 INDEX SignalAs you can see in the graph above in the last three times of Fed meetings The market dropped, Today there will also be a meeting of the Fed so we recommend opening a sell position and continuing the trend of meetings, The second (sell) reason is the line of resistance of (Ichimoku Indicator) Senkou Span
sell S&P 500
Entry Price: 2655
Stop Loss: 2703
Take Profit: 2400
SP 500 24.01.2019Buongiorno, SET UP DI GANN
SET UP 2 GG del 17 e 18 Gennaio è di MASSIMO - RP 2677-2596
SET UP 3 GG del 18-21-22 ERA DI MASSIMO - RP 2677-2616, SODDISFATTO IERI CON MINIMO A 2612.
SET UP 6 GG dal 15 AL 22.01 E' DI MASSIMO - RP 2677-2580
SET UP 12 GG dal 15 AL 30 è IN FASE DI CONFIGURAZIONE - RP 2677-2580
SET UP SETTIMANALE dal 21 AL 25 è INSIDE E IN FASE DI CONFIGURAZIONE - RP 2673-2612
OGGI PARLA DRAGHI 14.30 - PRE 13.45
Il metodo di Gann è personale e come tutti i metodi va valutato con flessibilità.
I set up possono esser un faro e annullati, quindi proteggersi sempre con Stop Loss.
E nel caso il mercato presentasse scenari "non favorevoli" per mantenere il trade, evitare overnight.
Le perdite potrebbero esser maggiori dello stop loss preventivato.
