Sp500future

I'm waiting for such a movement from SP&500 . SHORT . Intraday .Everything can be seen on the graph. We are waiting for the approach to the price to the zone of interest, if it does not interrupt EQL .

SP500: Snoop Dogg! 🐕🦺🐕🦺🐕🦺We expect the SP500 to fly high like SnooP(500) Doggy Dogg and reach above 4238 (sorry not 420). There, a correction should set in which will bring us back below 4238 points. However, afterwards we expect the SP500 to rise again and reach new all-time highs.
Stay tuned!

HEARD OF THE NASDAQ MOP TRADE? IF NOT CLICK THE LINK!Our proprietary model uses 26 inputs to calculate which day is going to be the high and low for the coming week. If you like trading QQQ or Nasdaq OPTIONS than you need to subscribe.
We bought the QQQ 343 Calls last Friday at 1.62.
Today the range for the 343 Calls was 1.58 / 2.65 and the calls closed at 2.32 (after the Tesla earnings report created a little weakness after the close).
We will hold our 343 Calls if Tuesday High > Monday High, and we will add to our current position if the 30 minute low holds after the open. If that low breaks and forms a good low that occurs in the 1st 120 minutes today we will add more at that point. If Tuesday makes a new low after 120 minutes from the open we will not add to our 343 Calls until the last 60 minutes of trading (unless Tue low < Mon Low 338.91). This is one of our model's inputs!
The MODEL PREDICTIONS for this week:
Monday or Tuesday low this week (higher % Mon low)
Thursday or Friday High (higher % Fri High)
Model is predicting if Monday is the low for the week = Friday's Close > 343.54 and possibly as high as 346.46
Now if you cannot monetize this information, our model is producing, than you need to send us a private message so we can show you how youcan!!!
Good Luck Today
(if anyone has any questions about getting any intraday updates just send us a private message on this platform)

What Does Biden’s Tax Hike Proposal Mean for SP500Traders are digesting news that Biden plans to double capital gains taxes on the wealthy. As result, SP500 lost $30 in one trading session. However, it recovered the next day. The proposal has not been officially announced but details reported by Bloomberg include raising the top marginal tax rate to 39.6% from 37% while lifting the capital gains rate from 20% currently to 39.6% for people earning $1 million or more.
Fundamental analysis
Democrats planned a tax hike for a long time. So, it wasn’t that big surprise. A big question is when the rate hikes might go into effect, which would likely impact decisions on when or if to book profits from the market. And that’s what we all want to pay attention to. Meaning, if a big tax hike is coming next year, could we see a selloff this year with investors looking to ensure the lower tax rate?
And what if the timing is different? Stock bears have been warning for a while that investors were not pricing in higher taxes ahead. The market reaction last week was relatively mild, with markets down overall but the major indexes all lost less than a full percentage point.
Congress has to approve the tax high. And I believe it will be not that easy. It will likely find no support from Republicans and possibly many Democrat defectors. So the early consensus in Washington seems to be that these tax increases stand little chance of passing at the levels being suggested. It will be interesting to see if Wall Street agrees as more details are revealed.
President Biden is expected to unveil the proposal next Wednesday, April 28. Keep in mind, the White House has already announced a plan to raise corporate taxes to 28%.
Economic reports
Economic data last week was a sort of a mixed bag. Initial jobless claims posted another decline to hit the lowest levels of the pandemic. However, there are some signs of headwinds for the housing market with Existing Home Sales falling for the second straight month but inventory levels are at record lows, so it’s tough to draw a negative conclusion. Housing supply did climb nearly +4% last month but it was still more than -28% lower than 2020 levels.
The Wall Street Journal pointed out that, nationally, there were more real estate agents than there were homes listed for sale in March. At the same time, the median home sale price rose to a new record high of $329,100, marking a +17.2% gain over last year as supply constraints have led to the fastest selling pace on record.
What to look for next week?
Things kick into high gear next week though with announcements from some of America’s largest companies, including Tesla on Monday, followed by tech giants Alphabet and Microsoft on Tuesday, Apple and Facebook on Wednesday, and Amazon on Thursday.
Other big names reporting next week include AbbVie, Agco, Altria, Amgen, AstraZeneca, BASF, Boeing, Boston Scientific, BP, Bristol Myers Squibb, Caterpillar, Charter Communications, Chevron, Chubb, Clorox, CME, Colgate Palmolive, Comcast, Dominos, Ebay, Eli Lilly, Exxon, Ford, General Electric, Gilead Sciences, GlaxoSmithKline, Intercontinental, Keurig Dr. Pepper, Kraft Heinz, Mastercard, McDonalds, Merck, MGM Resorts, Mondelez Int., Moody’s, Nio, Norfolk Southern, Northrop Grumman, Novartis, O’Reilly Automotive, Phillips 66, Qualcomm, Royal Dutch Shell, Shopify, Spotify, Starbucks, Texas Instruments, Thermo Fisher, Twitter, UPS, Visa, Yum Brands, …among many others.
Data to watch
Nearly every sector will get some coverage which will help analysts and investors get a better sense of what to expect from the rest of this earnings season. It will also help shape expectations for the quarters ahead as more companies provide full-year guidance.
Next week also brings the Federal Reserve’s two-day policy meeting on April 27-28, which comes amid a busy economic data schedule that includes Consumer Confidence Tuesday; the first read on first quarter GDP and Pending Home Sales on Thursday; and Consumer Sentiment, Chicago PMI, PCE inflation reads, and Personal Income and Spending on Friday.
SP500 technical analysis
SP500 futures found support near 4100 last week. In the absence of big news, we can expect it to hold. However, Biden’s tax proposal can shake the market. So, I wouldn’t rely on that support much. Advanced Decline Line shows signs of weakness. However, there is no clear divergence. If the price sustains above last week’s high, 4250 is the next magnet. But as I mentioned above we may see big volatility next week. So, I don’t trust those levels much.
The range 3950 – 4000 is technically more important and more reliable. However, with cycles turning to the downside and ADL showing signs of weakness, tax proposals may be catalysts for sell-off. Yet, in the absence of clear signal, I think traders have to stick to Gann levels on an intraday basis.

SP500 to 4200 by 4/20When twitter starts posting VIX charts, you know its time to buckle up for them to scream "GolDen AgE oF AsSeT BubBlEs" when the market, against all the social media narratives, rips shorts to shreds.
"ArCHEgOs iS goNnA buRsT tHiS BuBBle" -> /es runs to 4k+ instantly
No, this is not the 2001 Tech Bubble.
4104 is top line resistance. If hit, we'll have a small pullback (4050-4060 floor). I estimate the pullback to last approx till 4/14-4/15. Option expiration and after -> Insane melt-up coming.
Never short a dull market.
This is not financial advice.

ES Hits target after target for longsIt will come down to the next mean reversion for a look to enter now, but wow if you were long this last week or so, you are happy! It was pretty easy to stay in this trend this time around, and good places to take targets too.

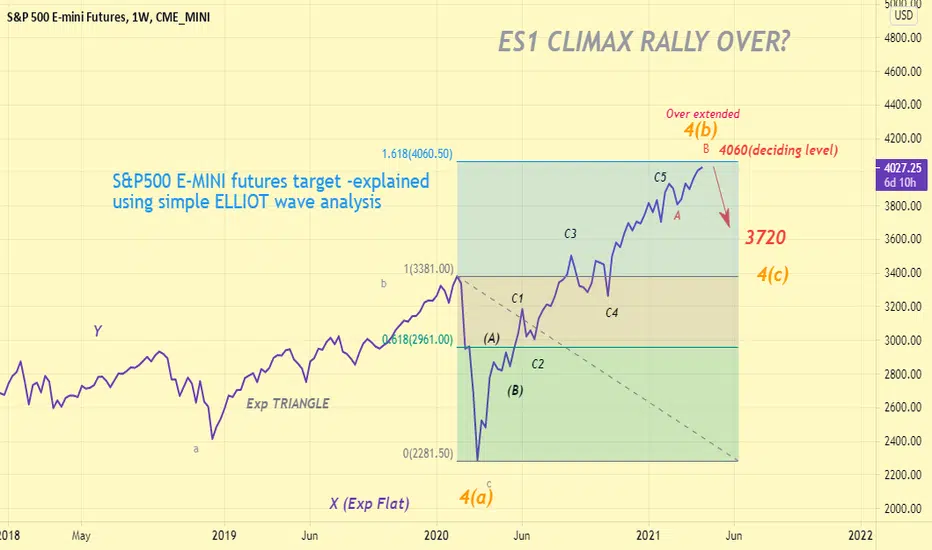
ES1 CLIMAX OVER?4060 is the key level to reach by S&P500 futures to decide its further bull run.
REASON ; c5=c1+c3
LOGIC; B wave over extention limit is 4060
CONFIRMATION ; next week monday selling from this leveLl
NEAR TERM BEARISH as (4b) recovery completed and next (4c) will begin DOWN to 3720 next week
SELVAM,
NEO WAVE ANALYST
S&P500 CLIMAX RALLY 4100 NEo wave Analysis & time cycle is the best way to forecast the next move .
My previous analysis (3600) postponed for a fortnight.
The next achievable target (5th wave of C)within 2 weeks time is 4100
So , Get into the bulltrain for sometime..
Enjoy trading , Enjoy life, TRADE to LIVE
SELVAM,B
BE,MBA
Neo wave Analyst

S&P FUTURE IDEAHi,
I am expecting a retracement of last candle then will keep its way until the upper daily band

US 500 UPDATE.. As predicted on the 11th, S&P IS GONNA FIGHT ITS WAY THRU THE CURRENT RESISTANCE AREA AROUND $3985.
IF price can breakout of this restricted area it could reach 4035 before any sight of resistance will be near.

SP500 Lifetime OpportunityHi there,
SP500 at the moment is a clear buy with target above 4000
If we pay attention to the DXY chart, we are starting a uptrend but still on sideways moment, which SP500 due to many retails shorting it, has been making new highs every week, as long as dollar is weak it will keep doing it, but dollar is soon ending this sideways market to start an uptrend.
SP500 then will top at that moment
If we look at the elliot wave theory, we are in the final phase, Blow off, close to a top to begin then a new trend.
This is a long term view, if your looking to sell it, sell only at the mentioned wave 5, near it.
Good luck

SP500 will break above again? 🦐SP500 is moving inside a descending channel in a retracement move.
Even if the market looks extremely overbought on the big picture the bulls seem to hold the present level.
According to PLancton's strategy if the price will break above we can set a nice long order.
–––––
Follow the Shrimp 🦐
Keep in mind.
• 🟣 Purple structure -> Monthly structure.
• 🔴 Red structure -> Weekly structure.
• 🔵 Blue structure -> Daily structure.
• 🟡 Yellow structure -> 4h structure.
• ⚫️ Black structure -> >4h structure.
Here is the Plancton0618 technical analysis , please comment below if you have any question.
The ENTRY in the market will be taken only if the condition of the Plancton0618 strategy will trigger.

📉 S&P500 rising wedge in falling channel: ES1! - Bears roaringCME_MINI:ES1! forming declining megaphone pattern, now it coul be falling channel also as you can see in my chart. There is an evidence of steadely incrasing volatility so its nod good sign for bulls. As you notice small rising wedge evolved in the megaphone pattern. Today i expecting some bulls come back to the game and will touch higher trendline of the rising wedge to the (blue) supply zone to retest and there is higher trendline of declining megaphone pattern. I expecting further downside move from there, so there is nice sweet spot to plan entry to short trades. My next target on ES is 3660
It can be apply to AMEX:SPY

💵 Thursday? More like GREENDAY! 💚My fellow kings 👑 , we yet again taste the sweet diabetic delight of profit.
This makes three days in a row, we still going strong boys.
Though for tomorrow I am putting the BBQ away.
I think we'll be up on an upward correction.
Over the last 90+ years the SPX has grown at an average of about 9% a year.
We started this year at an SPX of 3793, therefore we will end it at an SPX of 4135.
4135 - 3793 = 342 342/12 = 28,5 28,5*3 = 85,5 85,5 + 3793 = 3878.
So the price we should be at is 3878 ish. We are not because of market forces.
Those same market forces will soon make the index explode upwards.
I am not certain the downswing will end Thursday, though I am convinced Thursday will be green.
Friday is tricky to me and could go both ways, depending on tomorrows economic numbers.
Though i am convinced we'll end green tomorrow I can't rule out striking below 3800 before ^^^
Biden's Covid effort is going stronger than anticipated and the market has been sleeping on it.
The rates will balance out and NASDAQ will stabilized its outrageous valuations before long.
I can't state enough that with the current info I believe we're about to board a mega rocket later this month.
Anyway, whether you're short or long tomorrow, may your positions be as blessed as this beautiful day.
"President Biden said on Tuesday that a key milestone in the fight against COVID-19 could be reached two months faster than earlier projected.
By the end of May, there should be enough vaccine doses for every adult in America, he said — a dramatic improvement to his initial timetable for late July. "
www.bbc.com


SP500 - SHORT; Look for a Short Entry, right here!Like the title says...
... and the Nasdaq100
... and the NDX/US30 (Nadaq/Dow)
... and the Dow/Gold from this post;


Short MarketThe market has reached its all time high creating a new higher high which can be treated as a resistance @3941.1 for now. The RSI suggests that the market has been heavily overbought on 30m chart and a recorrection is to be expected.
On 4hr chart the support level 3896.8 is constantly being tested and looks like the market will test this level one more time before making yet another bullish move. If bears break the supp levels expect the market to test zone @3877.7 to 3868.5 supp level.
Else the long move is to be assumed go up to 4017.0.
Supp levels:
3918.0
3894.5 --> getting weak
3877.7 to 3868.5 --> strong supp zone

S&P500 2021 - Signs Of The Impending CorrectionThis is a another chart where I've look for clues in different ways this time on if / when a correction / crash may happen.
All correlating with what has been found previous imo.

ALL TIME HIGHS FRIDAY...IT WILL CONTINUE THIS WEEK!!!With 30 minutes before Monday's open QQQ above Friday's High:
If Monday opens above Friday's High:
Our Model predicts:
30 minute low holds = Monday closes above Monday's Open = Monday's 30 minute low should be the low for the entire week !!!
30 minute low breaks > -20 cents = Monday's closes below Monday's Open
If Monday's 30 minute low eliminates the gap from Friday's close = Monday High week !!! ( Isn't it amazing how that one gap fill changes the whole week's outcome ? )
So our model is expecting another strong week with at least one good down day mixed in.
Unless Monday opens and goes straight down to 331.36 (Friday's Close) we will be buying QQQ Calls and SQQQ Puts in Monday morning is the 30 min low either holds or breaks < -20 cents
