Retest of 4960 area/ Fed Day !I think we will go back down and test the 4960 area. We have broken the short term Up angle today in one swoop. RED UMVD has appeared after divergence as well. FED Day today - get ready for some serious moves.
Sp500index

SP500 Mid term planOur friend Fibonacci is showing up a possible next move for SPX. Actually is ranging exactly on the 1.618 level of the last leg, and usually this level to a retrace till the level 1. There we could probably see a reversal that could lead the price into the resistance area at 5250, but it's probably too early for that

SP500 in the hammer zoneSP500 reached a strong reversal area where price reacted in the previous week. I was expecting a little pump in my previous ideas, and honestly i wasn't expecting it to rise so much. But i am holding my short trades and i am adding more here, consider i expect a selloff this month. First target the support zone at 4990

07May'24 /// SP500 // ES Key zone 23.5 stm.ES again closed with Buyers in control and now we have the Strong Resistance Zone at (ES 5209-5219) where Sellers are likely to be active on 1st test.
Short-term Neutral-Bullish
Intermediate Neutral-Bearish

SP500// ES Key zone 23.6 stm.All Board market strength
But rally from OVN.
Let see the action on good location.

When it comes to broadening wedges...AMEX:SPY Here we have a few broadening wedges. The last 2 were descending and SPY blasted off to new ath highs. Now were in a ascending wedge and sitting at 514. We have a few big name ERs that can put us back on the path to new aths but I think we are heading back to 480 by July based on the previous wedge behavior, and long support and resistance.

Level to watchWe are in the middle of a bulls rally. But still in bearish territory. The 510 level is going to be very intense to watch. If the bulls manage to break up and consolidates above 510 bears are dead. I'm not shorting anything yet. I'm just sitting and looking at my long positions.

S&P 500 At Major Decision PointThe stock market is at a major decision point, with 1969 low unemployment up-trending for the better part of the last year. Low unemployment *potentially* signals the maximum productivity of an economy. This is an important area to watch and wait. If we break above and trend-line check into support it could mean a bull market similar to 1990's is starting.
However if it holds as resistance we're unfortunately looking at a move back down to support much much lower than where we are right now.
I'd like to think because of visiting support twice in the dot-com crash and mortgage crisis that we are much more likely to break upward. But caution should be on our minds.
It's a very good idea to sit on the sidelines and wait for a clear direction to emerge.
Good luck!

SP500 Everything goodSP500 is on track and is following the idea i shared some days ago. I expect a continuation of the drop till the 4800-4900 area, and probably the target will be hit in May/June. Here i will look for longs to hold till Q4 2024. Updates will follow

SP500// ES Key zone 26.9 stm.We have the initial Resistance zone which is the intraday Bias changing zone.
Where the market is going to move if ES/ SP500 holding below initial resistance following the FC announcement then the reason to weakness then could still remain in play for move down to initial support.
/////////////////
Short-term Neutral-Bearish
Intermediate Neutral-Bearish
/////////////////

Correction in a larger degree of wave (Bear scenario)Esteemed analysts and traders,
I hope this correspondence finds you in good health and high spirits, prepared to tackle the upcoming week with renewed energy. I extend my best wishes for your continued success in all your business endeavors. It is worth noting that success in trading is largely dependent on the consistent definition and adherence to one's own rules.
As a supporter of the Elliott Wave Principle, I consider this methodology an invaluable tool for market analysis. After three years of personal experience, I have developed my approach by combining this principle with meticulous consideration of different market scenarios. I strive to avoid market surprises by maintaining a range of market prospects, which enables me to recognize the market structure forming with 100% accuracy.
I am pleased to share my analysis with you, with the caveat that I do not provide buy or sell signals. My perspective on idea analysis is entirely impartial, and if my analysis meets your standards, it may serve as a guide to making an informed decision.
For your reference and comparison, I have attached my previous analysis of the same market. All the details of my analysis are clearly labeled for ease of comprehension. Nonetheless, familiarity with the Elliott Wave Principle theory would facilitate an understanding of the analytical idea.
My study of the Elliott Wave Principle took nearly three years, during which my understanding and experience with this invaluable tool have grown. My progress thus far is a testament to the legacy of Ralph Nelson Eliot, whose genius has provided the foundation for my achievements. May he rest in peace.
I express my gratitude for your continued support and kindness, and welcome your comments and critiques.
May my analysis be a valuable asset to your business journey, and I remain sincerely yours,
Mr. Nobody
Bullish scenario

Key zone SP500 - ES //27.25-point stmListen to the Market
opinions are typically wrong but the market is never wrong
Intermediate: Neutral-Bearish

SP500 Main targetSP500 is looking bearish, and i think we will see a major correction in the next weeks. I have my main target at $4.750, were the price could bounce back up. I will enter short with small size and i will add shorts if the price will go up, invalidation above actual highs at $5.300

Key zone SP500 - ES //30.5-point stm. Keep an eye on $NQKeep an eye on $NQ_F
it's leading the reversal and is at better Resistance.
Intermediate Neutral-Bearish

ABD teknoloji Hisseleri abd teknoloji hisseleri düşüş sonrası valörlü Fon Yerine Bu EFT ler alınır mı ?

The bullish scenario based on 5.3.5.3.5Esteemed analysts and traders,
I hope this correspondence finds you in good health and high spirits, prepared to tackle the upcoming week with renewed energy. I extend my best wishes for your continued success in all your business endeavors. It is worth noting that success in trading is largely dependent on the consistent definition and adherence to one's own rules.
As a supporter of the Elliott Wave Principle, I consider this methodology an invaluable tool for market analysis. After three years of personal experience, I have developed my approach by combining this principle with meticulous consideration of different market scenarios. I strive to avoid market surprises by maintaining a range of market prospects, which enables me to recognize the market structure forming with 100% accuracy.
I am pleased to share my analysis with you, with the caveat that I do not provide buy or sell signals. My perspective on idea analysis is entirely impartial, and if my analysis meets your standards, it may serve as a guide to making an informed decision.
For your reference and comparison, I have attached my previous analysis of the same market. All the details of my analysis are clearly labeled for ease of comprehension. Nonetheless, familiarity with the Elliott Wave Principle theory would facilitate an understanding of the analytical idea.
My study of the Elliott Wave Principle took nearly three years, during which my understanding and experience with this invaluable tool have grown. My progress thus far is a testament to the legacy of Ralph Nelson Eliot, whose genius has provided the foundation for my achievements. May he rest in peace.
I express my gratitude for your continued support and kindness, and welcome your comments and critiques.
May my analysis be a valuable asset to your business journey, and I remain sincerely yours,
Mr. Nobody
The bearish scenario of any corrective pattern and trend continuation

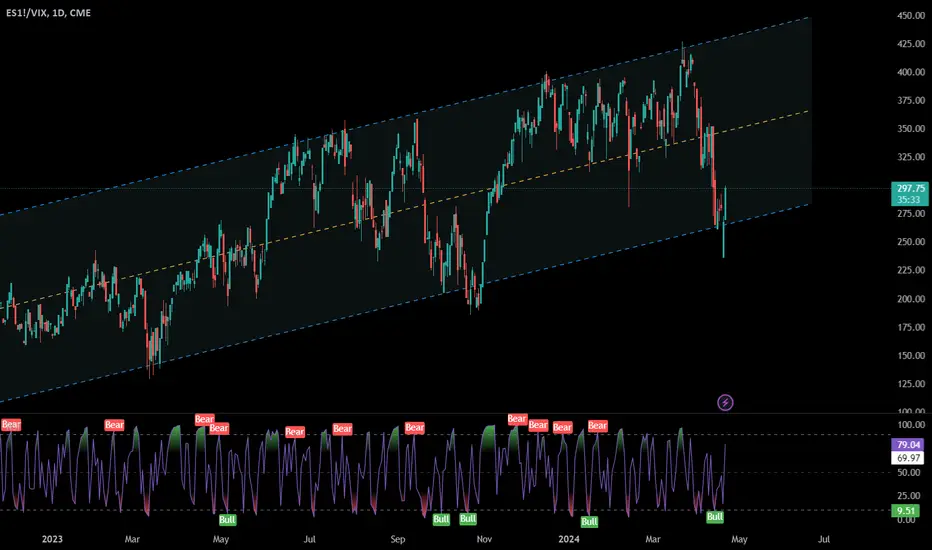
SP500 reversal in progressfrom the sp500/vix ratio it emerges that there is an increase in the relative strength of the stock market compared to the fear index. We could witness a bull market reabsorbing the bearish excess of the month of April
SP 500 Trade setup on broad market weakness.SP 500
SP 500 Trade setup on broad market weakness.
Stay hold below pre-market resistant.
So ideally wait to see break down pre-market support.
retrace and continue downside.

S&P 500 set to advance after a bout of selling on FridayEfforts are underway to head off a full-blown Middle East war.
What’s Happening Now:
A tense calm prevailed in the Middle East after Iran’s missile and drone attack on Israel. Global markets showed signs of stability on speculation the conflict will remain contained.
Iran said there wouldn’t be further attacks as long as Israel didn’t react aggressively, but Benjamin Netanyahu warned, “Whoever strikes Israel, we will strike him.”
A diplomatic race is underway to help ensure any retaliation doesn’t raise the stakes too high.
“It’s right to price more geopolitical risk premia into assets, but at the end of the day equity markets are still only about 2% off all-time highs,” said Timothy Graf, head of EMEA macro strategy at State Street. “This was a well-telegraphed geopolitical development. A lot of the bad news is in the price already.”
As we can see on the chart, the index is still trading in the tight diagonal canal which once broken a higher liquidity impulse can be expected. With the current situation of repricing rate cuts, higher inflation, and war tensions rising I am strongly expecting a quick 3-7% test to the previous lows.

$SPX $SPX500USDSummary
#SPX is approaching a key level where it may make a decision to bounce or break lower.
A zone ranging between 4800 : 4920 "highlighted" will determine the upcoming short term trend.

S&P500 Uptrend$5000 level is the target of this uptrend. Weekly chart shows that recession It is too early! EMA-150 and EMA-200 is used on this chart to determine the trend... Also we have bullish MACD divergence !

👀 Three Black Crows. Bear Market Candlestick PatternThree Black Crows is a term used to describe a bearish candlestick pattern that can predict a reversal in an uptrend.
Classic candlestick charts show "Open", "High", "Low" and "Close" prices of a bar for a particular security. For markets moving up, the candlestick is usually white, green or blue. When moving lower they are black or red.
The Three Black Crows pattern consists of three consecutive long-body candles that opened with a gap above or inside the real body of the previous candle, but ultimately closed lower than the previous candle. Often traders use this indicator in combination with other technical indicators or chart patterns to confirm a reversal.
Key points
👉 Three Black Crows is a Bearish candlestick pattern used to predict a reversal to a current uptrend, used along with other technical indicators such as the Relative Strength Index (RSI).
👉 The size of the Three black crow candles, timeframe they appeared on, the gaps when they opened, the downward progression sequence, as well as their shadows can be used to judge whether there is a risk of a pullback on a reversal.
👉 The “Three Black Crows” pattern should be considered finally formed after the sequential closure of all three elements included in it.
👉 The opposite pattern of three black crows is three white soldiers, which indicates a reversal of the downward trend. But maybe more about that another time.
Explanation of the Three Black Crows pattern
Three Black Crows is a visual pattern, which means there is no need to worry about any special calculations when identifying this indicator. The Three Black Crows pattern occurs when the bears outperform the bulls over three consecutive trading bars. The pattern appears on price charts as three bearish long candles with or without short shadows or wicks.
In a typical Three Black Crows appearance, bulls start the time frame with the opening price or gap up, that is, even slightly higher than the previous close, but throughout the time frame the price declines to eventually close below the previous time frame's close.
This trading action will result in a very short or no shadow. Traders often interpret this downward pressure, which lasted across three time frames, as the start of a bearish downtrend.
Example of using Three black crows
As a visual pattern, it is best to use the Three Black Crows as a sign to seek confirmation from other technical indicators. The Three Black Crows pattern and the confidence a trader can put into it depends largely on how well the pattern is formed.
Three Black Crows should ideally be relatively long bearish candles that close at or near the lowest price for the period. In other words, candles should have long real bodies and short or non-existent shadows. If the shadows are stretching, it may simply indicate a slight change in momentum between bulls and bears before the uptrend reasserts itself.
Using trading volume data can make the drawing of the Three Black Crows pattern more accurate. The volume of the last bar during an uptrend leading to the pattern is relatively lower in typical conditions, while the Three Black Crows pattern has relatively high volume in each element of the group.
In this scenario, as in our case, the uptrend was established by a small group of bulls and then reversed by a larger group of bears.
Of course, this could also mean that a large number of small bullish trades collide with an equal or smaller group of high volume bearish trades. However, the actual number of market participants and trades is less important than the final volume that was ultimately recorded during the time frame.
Restrictions on the use of three black crows
If the "Three Black Crows" pattern has already shown significant downward movement, it makes sense to be wary of oversold conditions that could lead to consolidation or a pullback before further downward movement. The best way to assess whether a stock or other asset is oversold is to look at other technical indicators, such as relative strength index (RSI), moving averages, trend lines, or horizontal support and resistance levels.
Many traders typically look to other independent chart patterns or technical indicators to confirm a breakout rather than relying solely on the Three Black Crows pattern.
Overall, it is open to some free interpretation by traders. For example, when assessing the prospects of building a pattern into a longer continuous series consisting of “black crows” or the prospects of a possible rollback.
In addition, other indicators reflect the true pattern of the three black crows. For example, a Three Black Crows pattern may involve a breakout of key support levels, which can independently predict the start of a medium-term downtrend. Using additional patterns and indicators increases the likelihood of a successful trading or exit strategy.
Real example of Three black crows
Since there are a little more than one day left before the closing of the third candle in the combination, the candlestick combination (given in the idea) is a still forming pattern, where (i) each of the three black candles opened above the closing price of the previous one, that is, with a small upward gap, (ii ) further - by the end of the time frame the price decreases below the price at close of the previous time frame, (iii) volumes are increased relative to the last bullish time frame that preceded the appearance of the first of the “three crows”, (iv) the upper and lower wicks of all “black crows” are relatively short and comparable with the main body of the candle.
Historical examples of the Three Black Crows pattern
In unfavorable macroeconomic conditions, the Three Black Crows pattern is generally quite common.
The weekly chart of the S&P500 Index (SPX) below, in particular, shows the occurrence of the pattern in the period starting in January 2022 and in the next 15 months until April 2023 (all crows combinations counted at least from 1-Month High).
As it easy to notice, in each of these cases (marked on the graph below) after the candlestick pattern appeared, the price (after possible consolidations and rollbacks) tended to lower levels, or in any case, sellers sought to repeat the closing price of the last bar in series of the Three Black Crows candlestick pattern.
Bottom Line
👉 As well as in usage of all other technical analysis indicators, it is important to confirm or refute its results using other indicators and analysis of general market conditions.
👉 Does History repeat itself? - Partially, yes.. it does. This is all because financial markets (as well as life) is not an Endless Rainbow, and after lovely sunny days, earlier or later, dark clouds may appear again, and again.

Mid April: Market pullbacks, inflation concerns; critical levelsIn April, the markets navigated a sluggish terrain, witnessing pullbacks from the record highs achieved in March for both the S&P 500 and the Dow. Meanwhile, the NASDAQ experienced a marginal dip, bolstered by specific technology stocks. Persistent concerns surrounding inflation lingered, exacerbated by the latest Consumer Price Index data revealing a 3.5% annual increase in March, with core inflation climbing to 3.8%. These figures, coupled with inflation data surpassing expectations, tempered anticipations for immediate interest-rate adjustments.
Our analysis pinpoints a notable development as the US stock market dipped below the critical 5141 level, meriting close observation. Signs suggest a potential further descent, potentially to close a gap, presenting a prospective opportunity for traders.
We recommend traders monitor these levels vigilantly for insights into market trajectory and potential trading prospects, particularly surrounding the 4982 gap level. This juncture could serve as a pivotal support or resistance zone, contingent upon price action and market sentiment. Diligently tracking these benchmarks can furnish invaluable guidance for making well-informed trading decisions amidst the current market landscape.
