Bullish continuation?S&P500 (US500) is falling towards the pivot which acts as a pullback support and could bounce to the 1st resistance, which aligns with the 161.8% Fibonacci extension.
Pivot: 6,127.80
1st Support: 5,785.00
1st Resistance: 6,428.64
Risk Warning:
Trading Forex and CFDs carries a high level of risk to your capital and you should only trade with money you can afford to lose. Trading Forex and CFDs may not be suitable for all investors, so please ensure that you fully understand the risks involved and seek independent advice if necessary.
Disclaimer:
The above opinions given constitute general market commentary, and do not constitute the opinion or advice of IC Markets or any form of personal or investment advice.
Any opinions, news, research, analyses, prices, other information, or links to third-party sites contained on this website are provided on an "as-is" basis, are intended only to be informative, is not an advice nor a recommendation, nor research, or a record of our trading prices, or an offer of, or solicitation for a transaction in any financial instrument and thus should not be treated as such. The information provided does not involve any specific investment objectives, financial situation and needs of any specific person who may receive it. Please be aware, that past performance is not a reliable indicator of future performance and/or results. Past Performance or Forward-looking scenarios based upon the reasonable beliefs of the third-party provider are not a guarantee of future performance. Actual results may differ materially from those anticipated in forward-looking or past performance statements. IC Markets makes no representation or warranty and assumes no liability as to the accuracy or completeness of the information provided, nor any loss arising from any investment based on a recommendation, forecast or any information supplied by any third-party.
Sp500index

SP500 approaching rising trendline from belowThere has always been some correction when the market approaches the rising trendline from below. AMEX:SPY has about 10 point and SP:SPX about 100 points to go still. The volume is still on the buy side. I expect that to fade before a correction. Some market leaders like AMZN have already touched that trendline

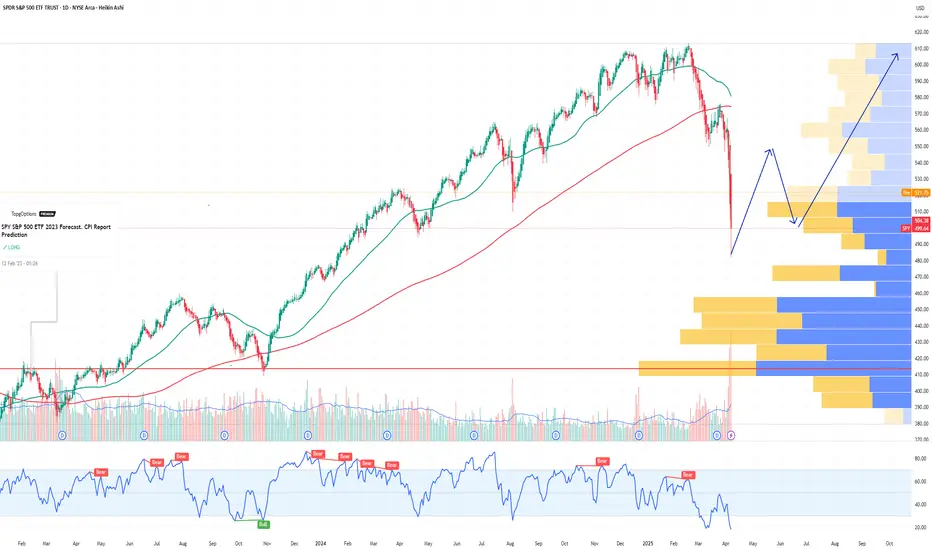
SPY S&P 500 ETF Potential W-Shaped Recovery Forming We may be witnessing the formation of a W-shaped recovery on the SPY (S&P 500 ETF) – a classic double-bottom structure that often signals a strong reversal after a period of correction or volatility. Let’s dive into the technicals and what this could mean in the sessions ahead.
🔍 The Technical Setup:
SPY recently tested key support around the $485-$500 zone, bouncing off that area twice in the past few weeks. This gives us the left leg of the W and the first bottom. After a modest relief rally to ~$520, we saw another pullback – but this second dip failed to break below the first bottom, a hallmark of the W-pattern.
As of today, SPY is starting to reclaim ground toward the $517-$520 resistance zone. If bulls can push through this neckline area, especially with volume confirmation, we could see a breakout that targets the $530-$535 area in the short term.
🔑 Key Levels to Watch:
Support: $490-$500 (double-bottom support zone)
Neckline/Resistance: $530
Breakout Target: $550 (previous highs)
Invalidation: A break below $490 with volume could invalidate the W-recovery idea and shift bias bearish.
📊 Momentum & Volume:
RSI is climbing back above the 50 level – bullish momentum building.
MACD shows a potential crossover forming, hinting at a shift in trend.
Watch for increasing buy volume as SPY approaches the neckline – that’s where the bulls will need to step up.
🧠 Macro & Earnings Angle:
Don’t forget – we’re entering a heavy earnings season and rate cut expectations are still a wildcard. A dovish tone from the Fed and strong corporate results could be the fuel that sends SPY higher to complete this W-shaped recovery.
🧭 Final Thoughts:
This is a high-probability setup if neckline resistance is broken cleanly. Wait for confirmation before going heavy – fakeouts are common in double-bottom scenarios. If we do get the breakout, we may be looking at a broader market rebound going into summer.
🔔 Set alerts near $525. A confirmed breakout could mean the bulls are back in charge.
S&P500: Target Zone DeactivatedThe S&P 500 extended its bullish trend yesterday, moving beyond our now-deactivated (formerly magenta) Target Zone. Existing positions remain intact, as the stop set 1% above the upper boundary has not been triggered. In our updated primary scenario, we anticipate continued upward movement within magenta wave (B), potentially reaching the resistance at 6675 points. Once this peak is established, we expect a corrective decline to begin in the form of wave (C), which should guide the index into the green Long Target Zone between 4988 and 4763 points. There, the larger green wave is expected to complete. A sustained breakout above the 6675-point level would shift the outlook in favor of the alternative scenario. In that case, green wave alt. would be considered complete—a trajectory we currently assign a probability of 40%.
📈 Over 190 precise analyses, clear entry points, and defined Target Zones - that's what we do.

Rising Geopolitical Tension (Iran Conflict) Signals Market RiskMoving Partially to Cash (VEA, QQQ, TQQQ, SPY, TECL, SOXL)
The global market is entering a high-risk environment. Geopolitical escalation, particularly the growing threat of direct US involvement in a military conflict with Iran, is pushing global uncertainty to new highs. Tensions in the Middle East, rising oil and gold volatility, and increased friction between major world powers all point toward a potential market breakdown. On the chart, VEA ETF is showing signs of topping out within a rising wedge pattern. Meanwhile, institutional funds are starting to reduce exposure to high-risk assets. I'm taking partial profits and shifting to cash across VEA, QQQ, TQQQ, SPY, SOXL, and TECL to preserve gains. Buy-back zones are set around 53.00, 48.00, and 44.00. In an environment of global escalation and rapid risk-off sentiment, active portfolio defense is more important than passive hope.

The sell moment is coming? SP500Market is greed as of now, and the chart is showing a potential reversal pattern. I expect a quick short liquidation first and a big short next. I expect the market to retrace till the 5700 level in the coming weeks.
If you are a scalp trader, check my accounts page!
AMD - Inverted Head & Shoulders (Bullish Reversal)Let´s see if we can break the neckline (White trendline) and stay above with a close and possibly a retest on the neckline to confirm this pattern. If so, Im looking for the previous top on daily which is the all time high (So far).
This is not a financial advise. Always do your own research and decision before investing.

**** Market Trading Strategy Idea SP500 ***Key Chart & Economic Insights:
- Current Market Position
- The S&P 500 is around $6000, showing positive momentum (+1.03%).
- Upward trend visible, indicating strong buying interest.
- Economic tailwinds support continued growth.
- Projected Price Movements
- 6800 USD: Key resistance level where selling pressure could emerge.
- Market pullback: A correction after 6800 may create a buyback opportunity.
- Recovery phase: Expected rebound toward 7000-7500 USD, another selling position.
- Economic Context: U.S. Manufacturing Boom & GDP Growth
- The United States is ramping up domestic production, boosting industrial output and reshoring manufacturing.
- This shift is fueling GDP growth, strengthening economic fundamentals and potentially sustaining bullish market momentum.
- Strong consumer spending & investment could drive stocks higher, aligning with the planned trade strategy.
Risk Management & Optimization:
- Entry & Exit Precision: Define stop-loss and take-profit levels.
- Momentum Confirmation: Ensure price action validates expected moves.
- Economic Indicators: Watch manufacturing & GDP data for trend validation.
If you want to refine this analysis or explore other scenarios, I'm here to dive deeper into key points! 🚀 Subscribe! TSXGanG
I hold a CCVM and MNC (Certificate of Competence to become a securities broker anywhere in Canada) and have been working as a trader for five years.
It’s a pleasure for me to help people optimize their trading strategies and make informed financial market decisions.

S&P500: Approaching the 88.70% RetracementThe S&P 500 continued its climb, nearing the 88.70% Fibonacci retracement level. The top of magenta wave (B) has not yet been confirmed, so under the primary scenario, we continue to expect further upside into the magenta Target Zone between 5,880 and 6,166. Once that zone is reached, wave (C) is expected to take over and drive the index into the next Target Zone — the green zone between 4,988 and 4,763. Short positions initiated within the upper zone remain viable and can be protected with a stop 1% above the top of the range. The alternative scenario — assigned a 40% probability — assumes the rally will continue directly into wave alt.(III) in blue, with a breakout above the 6,675 resistance. Over the long term, we continue to expect one final impulsive leg higher in blue wave (III) once the broader green wave correction is complete. This should take the S&P 500 well above the 6,166 mark.
📈 Over 190 precise analyses, clear entry points, and defined Target Zones - that's what we do.

The tariff legal zig-zagWith different US courts firing "shots" at each other over the legality of tariffs, the market is taking a bit of a pause from accelerating further. Let's dig in!
DJ:DJI
TVC:SPX
TVC:NDQ
TVC:DXY
Let us know what you think in the comments below.
Thank you.
77.3% of retail investor accounts lose money when trading CFDs with this provider. You should consider whether you understand how CFDs work and whether you can afford to take the high risk of losing your money. Past performance is not necessarily indicative of future results. The value of investments may fall as well as rise and the investor may not get back the amount initially invested. This content is not intended for nor applicable to residents of the UK. Cryptocurrency CFDs and spread bets are restricted in the UK for all retail clients.

Bullish bounce off overlap support?S&P500 is falling towards the support level which is an overlap support that lines up with the 23.6% Fibonacci retracement and could bounce from this level to our take profit.
Entry: 5,784.04
Why we like it:
There is an overlap support level that aligns with the 23.6% Fibonacci retracement.
Stop loss: 5,689.40
Why we like it:
There is a pullback support level that is slightly above the 38.2% Fibonacci retracement.
Take profit: 5,973.58
Why we like it:
There is a pullback resistance level.
Enjoying your TradingView experience? Review us!
Please be advised that the information presented on TradingView is provided to Vantage (‘Vantage Global Limited’, ‘we’) by a third-party provider (‘Everest Fortune Group’). Please be reminded that you are solely responsible for the trading decisions on your account. There is a very high degree of risk involved in trading. Any information and/or content is intended entirely for research, educational and informational purposes only and does not constitute investment or consultation advice or investment strategy. The information is not tailored to the investment needs of any specific person and therefore does not involve a consideration of any of the investment objectives, financial situation or needs of any viewer that may receive it. Kindly also note that past performance is not a reliable indicator of future results. Actual results may differ materially from those anticipated in forward-looking or past performance statements. We assume no liability as to the accuracy or completeness of any of the information and/or content provided herein and the Company cannot be held responsible for any omission, mistake nor for any loss or damage including without limitation to any loss of profit which may arise from reliance on any information supplied by Everest Fortune Group.

SP500 Ready to Continue it's Bullish MoveI just bought SP500 for it's bullish move continuation.
Monthly structure is bullish.
Weekly is bullish.
Daily is also bullish.
I entered for a long buy on the daily time frame retracement.

S&P ES Long setup target 5963.50 / Calls SPY target 596Fibonacci technical analysis : S&P 500 E-mini Futures CME_MINI:ES1! has already found support at the Fib level 78.6% (5623.50) of my Down Fib. Last Daily candle (May 2) has closed above retracement Fib level 78.6%. My Down Fib guides me to look for CME_MINI:ES1! to eventually go up to hit first target at Fib level 127.2% (5963.50).
CME_MINI:ES1! – Target 1 at 127.2% (5963.50), Target 2 at 161.8% (6205.50) and Target 3 at 178.6 (6322.75)
Stop loss slightly below the 61.8% retracement Fib level (5506.25).
Option Traders : My AMEX:SPY chart Down Fib shows price to go up to Target 1 at 127.2% (595.82), Target 2 at 161.8% (620.50) and Target 3 at 178.6 (632.50)
Stop loss slightly below the 61.8% retracement Fib level (549).
Enjoy the trading process and take time to smell the roses🌹

$SPX Weekly – 2025 Trendline Bounce Confirmed Again📈 The S&P 500 ( VANTAGE:SP500 ) just bounced cleanly off the long-term trendline that has defined this bull market since the COVID low in 2020.
🟢 Touchpoints:
March 2020 🦠
June 2022 (inflation bottom)
October 2023 (Fed pause)
Now again in 2025
That’s four successful tests in five years. Price action suggests that this trendline remains the key support for bulls — as long as it holds, the trend remains intact.
But if it breaks in the future… buckle up.

S&P 500 | Blue Box as Margin of SafetyWhen the index returns to the blue box, it reaches a zone forged by genuine buying interest and technical alignment. In a disciplined, data‑driven approach, this area serves as our first line of defense.
Why It Matters
• Past reactions show price pauses and reversals here, revealing real demand.
• It coincides with key footprint volume clusters where buyers have stepped in.
Entry Criteria
Higher‑Time‑Frame Stability
Confirm price holds within or above the blue box before considering a position.
Lower‑Time‑Frame Confirmation
Wait for clear breakouts or higher‑lows on short‑term charts backed by rising footprint volume.
Strict Risk Control
If price breaks through without retest or volume support, stand aside and seek a clearer setup.
By treating the blue box as our margin of safety and relying on actual volume footprint data, we trade with prudence and let the market’s real signals guide our decisions.
📌I keep my charts clean and simple because I believe clarity leads to better decisions.
📌My approach is built on years of experience and a solid track record. I don’t claim to know it all but I’m confident in my ability to spot high-probability setups.
📌If you would like to learn how to use the heatmap, cumulative volume delta and volume footprint techniques that I use below to determine very accurate demand regions, you can send me a private message. I help anyone who wants it completely free of charge.
🔑I have a long list of my proven technique below:
🎯 ZENUSDT.P: Patience & Profitability | %230 Reaction from the Sniper Entry
🐶 DOGEUSDT.P: Next Move
🎨 RENDERUSDT.P: Opportunity of the Month
💎 ETHUSDT.P: Where to Retrace
🟢 BNBUSDT.P: Potential Surge
📊 BTC Dominance: Reaction Zone
🌊 WAVESUSDT.P: Demand Zone Potential
🟣 UNIUSDT.P: Long-Term Trade
🔵 XRPUSDT.P: Entry Zones
🔗 LINKUSDT.P: Follow The River
📈 BTCUSDT.P: Two Key Demand Zones
🟩 POLUSDT: Bullish Momentum
🌟 PENDLEUSDT.P: Where Opportunity Meets Precision
🔥 BTCUSDT.P: Liquidation of Highly Leveraged Longs
🌊 SOLUSDT.P: SOL's Dip - Your Opportunity
🐸 1000PEPEUSDT.P: Prime Bounce Zone Unlocked
🚀 ETHUSDT.P: Set to Explode - Don't Miss This Game Changer
🤖 IQUSDT: Smart Plan
⚡️ PONDUSDT: A Trade Not Taken Is Better Than a Losing One
💼 STMXUSDT: 2 Buying Areas
🐢 TURBOUSDT: Buy Zones and Buyer Presence
🌍 ICPUSDT.P: Massive Upside Potential | Check the Trade Update For Seeing Results
🟠 IDEXUSDT: Spot Buy Area | %26 Profit if You Trade with MSB
📌 USUALUSDT: Buyers Are Active + %70 Profit in Total
🌟 FORTHUSDT: Sniper Entry +%26 Reaction
🐳 QKCUSDT: Sniper Entry +%57 Reaction
📊 BTC.D: Retest of Key Area Highly Likely
📊 XNOUSDT %80 Reaction with a Simple Blue Box!
📊 BELUSDT Amazing %120 Reaction!
📊 Simple Red Box, Extraordinary Results
I stopped adding to the list because it's kinda tiring to add 5-10 charts in every move but you can check my profile and see that it goes on..

S&P500 room for growth?If you compare S&P500 trend from 2025 with previous years, you might either see two things:
Room for growth. In that scenario, later in the year we might see again see some upwards trend again. Instead of the current more or less flat line. Similar t o the year 2020.
Or you could compare this year with recession of some sort like the year 2022. Where we would end up in an overall loss of this year.
China could potentially escalate a war between India & Pakistan.
But I'm a bit more optimistic now. I hope they will rather now have a trade deal with the US instead of a war. Easing the tension of the trading wars. Putting this whole context together, we might actually see a small plus (like 8-10%) YoY for 2025. Or even a solid 15-20%?
What do you think?
See:

US500 bearish 12 May - 16 May 2025S&P 500 Bearish Outlook: Targeting $5,100 Amid Rising Uncertainty
As of May 12, 2025, the S&P 500 (US500) stands at 5,661, reflecting a robust recovery from its April lows. However, I anticipate a bearish shift, projecting a decline towards the $5,100 level in the near term. Several converging factors underpin this outlook:
1. Anticipated Weakness in Core CPI Data
The upcoming release of the April Core Consumer Price Index (CPI) on May 13 is poised to be a pivotal event. While the year-over-year Core CPI is forecasted at 2.8%, matching the previous month's figure, the month-over-month increase is expected to rise to 0.3%, up from 0.1% in March. This acceleration suggests persistent inflationary pressures, potentially prompting the Federal Reserve to maintain or even tighten monetary policy, thereby exerting downward pressure on equities.
2. Deteriorating Market Sentiment and Forecasts
A notable shift in market sentiment is evident, with key indicators turning bearish. A prominent S&P 500 model has signaled its first bearish outlook since February 2022, reflecting growing investor apprehension. Additionally, leading financial institutions have revised their S&P 500 targets downward:
Goldman Sachs: Reduced from 6,500 to 5,700
RBC Capital Markets: Lowered from 6,600 to 5,500
Oppenheimer: Cut from 7,100 to 5,950
Yardeni Research: Adjusted from 7,000 to 6,000
These revisions underscore the mounting concerns over economic headwinds and market volatility.
3. Sectoral Divergence: Opportunities Amidst the Downturn
While the broader market faces challenges, certain sectors may exhibit resilience or even bullish tendencies:
Healthcare: Continues to serve as a defensive sector, with companies demonstrating solid quarterly results and reaffirming full-year guidance despite tariff impacts.
Energy Infrastructure: Firms like Enbridge and TC Energy benefit from long-term structural tailwinds, including rising energy demand and global energy security priorities.
Financials and Technology: Sectors represented by ETFs such as XLK and XLF are highlighted for their strong fundamentals and growth prospects.
Conversely, consumer discretionary sectors are showing signs of strain, with negative revenue surprises and companies like Harley-Davidson withdrawing their 2025 outlooks amid tariff uncertainties.
4. Implications of the US-UK Trade Deal
Recent developments in the US-UK trade agreement further contribute to market uncertainty. While the deal includes exemptions for certain British goods, such as aerospace components and a quota of 100,000 UK-made cars annually, it also maintains a baseline 10% tariff on foreign goods. This policy introduces complexity and potential cost pressures for multinational companies operating across borders.
Moreover, the agreement has faced criticism for being one-sided, with concerns that it may not adequately protect domestic industries or address broader trade imbalances. Such apprehensions can dampen investor confidence and contribute to market volatility.
The convergence of persistent inflation, cautious monetary policy, revised market forecasts, and the complexities introduced by recent trade agreements suggest a bearish trajectory for the S&P 500, with a potential decline towards $5,100. Investors should remain vigilant, monitoring sector-specific developments and macroeconomic indicators to navigate the evolving market landscape.
Disclaimer: This analysis is for informational purposes only and does not constitute investment advice. Always conduct your own research before making investment decisions.

S&P 500 Braces for a Drop to $5,100–$5,177: Correction Coming?S&P 500 Braces for a Drop to $5,100–$5,177: Is the Correction Coming?
SP500 Reached the target of $5,680 - $5,800 and is going into correction along with Bitcoin 🤔.
Before:
After:
➖ The S&P 500 could fall to the 5100–5177 range due to the following fundamental factors:
FOMC Meeting on May 7: Expected rate hold and potentially hawkish rhetoric from Powell could amplify fears of rate hikes, hitting growth stocks.
➖ Trade War: Uncertainty in U.S.-China negotiations and risks of new tariffs threaten supply chains and corporate profits.
➖ Weak Economy: GDP contraction (-0.3% in Q1), recession fears, and weak PMI data fuel pessimism.
➖ Corporate Earnings: Disappointing guidance from key companies (e.g., Apple, Tesla) could trigger sell-offs.
➖ Sentiment on X: Bearish sentiment reflects market caution.
➖ Global Risks: Retaliatory tariffs and rising gold prices signal a flight from U.S. assets.
Assumption: If the Fed on May 7 emphasizes inflation risks and delays rate cuts, and tariff news remains negative, the S&P 500 could break support at 5500 and reach 5100–5177 within 1–2 weeks, especially amid technical selling and market panic.

The Illusion of Value: How the U.S. Market Became a Fantasy EconThe Illusion of Value: How the U.S. Market Became a Fantasy Economy
For decades, the American economy has been celebrated as the epicenter of innovation, wealth creation, and corporate success. But beneath the surface, an unsettling reality has emerged: The U.S. financial markets are increasingly driven by speculation, hype, and a distorted sense of value.
"Buy Now, Pay Later"—A Culture of Delusion
One of the most glaring symptoms of this detachment from reality is the widespread adoption of "Buy Now, Pay Later" (BNPL) services. A staggering number of American consumers have embraced debt-financed spending as a normal part of life. Credit cards are no longer the primary vehicle for financial mismanagement—BNPL systems have convinced people they can afford luxuries they fundamentally cannot.
This mentality, in turn, feeds into the stock market’s obsession with future promises over actual output. Investors have become infatuated with narratives rather than numbers, driving valuations to unrealistic highs for companies that either underdeliver or simply do nothing at all.
The MicroStrategy Paradox: Borrowing Money to Buy Bitcoin
Take MicroStrategy, for example—a company whose sole business model seems to be leveraging borrowed capital to buy Bitcoin. By traditional metrics, MicroStrategy offers no tangible product, no innovative service, no groundbreaking technology—just speculative accumulation. Yet, thanks to Bitcoin hype, its stock price is valued as if it’s a revolutionary player in the corporate world.
This irrational valuation mirrors the broader issue with American markets: Companies are being rewarded not for what they actually do, but for the financial games they play.
The Myth of Overvalued Titans: Tesla & Meta
Tesla and Meta serve as the poster children of speculative overvaluation.
- Tesla: Once hailed as an automotive disruptor, Tesla’s stock price often reflects what Elon Musk promises rather than what Tesla delivers. From self-driving software that never fully materialized to mass production goals that fell flat, Tesla’s ability to sustain its valuation relies more on Musk’s cult-like following than automotive success. Meanwhile, the gutting of regulatory oversight has allowed Tesla to push unfinished, potentially hazardous products into the market.
- Meta: Meta’s valuation has ballooned largely on the promise of virtual reality dominance. Yet, billions poured into the Metaverse have yielded little beyond overpriced VR headsets and gimmicky social spaces.
Elon Musk: The Master of Market Manipulation
Elon Musk’s influence on financial markets cannot be overstated. Through cryptic tweets, grand promises, and regulatory maneuvering, Musk has become a force powerful enough to shift markets with mere words. Whether it’s pumping Dogecoin, slashing Tesla’s safety oversight, or influencing government policy for personal gain, Musk operates in a reality where market value is dictated by his persona rather than corporate fundamentals.
The Rise of True Value Markets
While the U.S. economy indulges in financial fantasy, other global markets have started to present compelling opportunities:
- Europe: A more realistic, fundamentals-based approach to valuation is emerging. Traditional industries remain resilient, and companies must show actual profitability to attract investment.
- China: Despite regulatory challenges, China’s focus on industrial production, technological advancement, and infrastructure development gives its economy a sense of tangible progress.
- UK & Australia: Unlike the speculative U.S. markets, these economies remain grounded in earnings, productivity, and rational valuations.
Conclusion
The American financial landscape has become a speculative playground detached from reality. Companies are valued not for what they produce, but for what they promise, what they borrow, and what narratives they spin. Figures like Musk exploit market sentiment, while deregulation enables corporations to operate recklessly. As Europe, China, the UK, and Australia foster economies built on real value, the U.S. is at risk of crashing under the weight of its illusions.
SP:SPX TVC:DXY INDEX:BTCUSD TVC:GOLD NASDAQ:MSTR NASDAQ:TSLA NYSE:BLK NASDAQ:META XETR:DAX FTSE:UKX TVC:HSI SET:SQ NASDAQ:PYPL NASDAQ:AFRM NASDAQ:AAPL NASDAQ:AMZN NASDAQ:NVDA NASDAQ:COIN NASDAQ:HOOD

STOCKS | MARKET WATCH | Why Long-Term Investing Still Wins🤯 The start of 2025 was a bit of a rollercoaster for stocks.
Global markets got seriously rattled in the first few months by some sudden jitters. When President Trump announced those aggressive tariffs, it caused significant concern among investors, sending stock markets tumbling and prompting a flight to safety. Like Reuters said, April was "epic" for crazy market swings – the VIX fear index shot up to levels we hadn't seen since 2020 and 2008, and then just as quickly dropped back down. Markets went wild.
But then, by late April, the panic kind of ... disappeared. Once President Trump paused the implementation of the most severe tariffs, stocks bounced back pretty sharply. The S&P 500 recovered most of what it lost. After that nasty drop, it ended April only about 5% lower than it started the year. The Nasdaq, with all its tech stocks, pretty much ended the month where it began. So, after all that drama, major US stock markets weren't far from their all-time highs, showing how fast that "fear" can vanish.
📊 How key indexes did
S&P 500 (USA): 📉 Dipped in early April but bounced back late. Ended April around -5% for the year, after almost hitting a bear market.
Nasdaq Composite (USA): 📉 Similar story. Tanked on the tariff scare, then rallied when things calmed down, ending April pretty much flat for the year.
MSCI World (Global developed markets): 🤷♂️ Had its ups and downs along with the US markets. By the end of April, it was pretty much flat for the year – no big moves for the overall world index.
MSCI Emerging Markets: 📉 Didn't do as well as developed markets. Asian stocks, especially, took a hit early April because of trade war worries, so this index lagged, even though it recovered a bit by the end of the month.
FTSE/JSE All-Share (South Africa): 🇿🇦 The odd one out! The JSE jumped about +5% in the first three months of 2025, mainly thanks to mining stocks. It even hit a record high in March. The April craziness shook it up too, but because it did so well earlier, it was still slightly up for the year by late April.
Takeaway? Global stocks were jumpy, but they mostly recovered. By late April, most major indexes were close to where they started the year. South Africa's market was the exception, having a good first quarter that helped it weather the April storm.
⏳ Staying invested beats trying to be a stock Wizard
All this back and forth can make investors nervous. You start thinking, "Should I just sell now before it drops even more?" But history usually says that's the wrong move. Just sticking with it usually works out better than trying to guess the market's next move. BlackRock's iShares recently pointed out that "waiting for the 'right time' to invest might mean missing out on the best days," while staying invested lets you benefit from that "compounding" thing and get through the short-term bumps. Simply put, if you sit on the sidelines during big swings, you often miss the big rebound days. One study even showed that if you missed just the five best market days over 20 years, you'd end up with way less money than someone who just stayed in the market.
The legendary investor Charlie Munger put it simply: "The first rule of compounding: never interrupt it unnecessarily." Trying to jump in and out of the market around all the volatility is super tough – the biggest up days often follow right after the biggest down days. On the other hand, patient investors who just ride out the noise tend to grab more of those long-term gains. After all, with compounding, those small gains build on each other over time.
💰 The awesome power of compounding over time
Compounding basically means the sooner you invest and the longer you stay invested, the more your returns build on each other like a snowball rolling downhill. For example, the total return JSE All-Share index was up almost 23% over the last year. That kind of gain shows how just staying invested during good times can really grow your wealth. If you'd panicked and pulled out, you would have missed most of that growth. Over longer periods, like 5 to 10 years, the JSE has almost always gone up. The big lesson is that it's about "time in the market," not trying to "time the market," that really makes your returns grow and smooths out those bumps along the way.
🌍 What's driving the markets and the economy
There were a few big things happening that explain why the markets moved the way they did.
🇺🇸 US GDP Slowdown: The US economy actually shrank a bit in the first quarter of 2025. A lot of people blamed this on a big surge in imports as businesses bought stuff ahead of those potential President Trump tariffs. Even though this news spooked the stock market briefly in late April, underlying consumer spending was still looking pretty decent.
📈 US Company Profits: On the bright side, US companies reported some pretty strong profits. Analysts were expecting good growth in earnings for the S&P 500 in the first quarter, even with the economic slowdown. And it turned out even better – a lot of companies beat expectations, and overall earnings were up quite a bit from last year. This helped keep stock prices from falling too much during the pullbacks.
🇪🇺 European Spending Boost: In Europe, governments are starting to spend more. Germany, for example, proposed a huge fund for infrastructure and energy. The EU is also loosening its spending rules and increasing defense budgets. Some experts think this could actually boost Europe's economic growth a bit each year, which would mean better profits for European companies. Some even think European companies might see faster profit growth than US companies in the next few years because of this spending.
🇨🇳 Asia and Trade Wars: Asia was the weak spot. China's economy showed some signs of trouble, with a survey suggesting its manufacturing activity might have shrunk in April after a couple of months of growth. This seemed to be a direct result of the US tariffs. Asian stock markets took a hit on the tariff news, which dragged down the overall emerging markets index. Basically, tariffs and trade tensions hurt growth in Asia and its markets, which then affected returns in emerging markets globally.
✅ The bottom line
Early 2025 reminded us that markets can freak out quickly – but they can often bounce back just as fast. The swings felt scary, but history tells us that just sticking with your investments usually pays off. Major stock markets are pretty much where they were a few months ago, while economies and company earnings are still moving forward. For long-term investors, that wild week in April just reinforced an old lesson: stay invested and let compounding do its thing. As some experts say, "get invested and stay invested" because the most volatile times often have the biggest market gains. By sticking to your plan, you avoid missing those big up days when the "fear" fades and markets recover.
_________________________
SP:SPX
Sources: Recent market reports and data including the April SATRIX 2025 market newsletter “Once Again, Volatility Blinked and Fear Lost., nasdaq.com, reuters.com, ishares.com, insight.factset.com, reuters.com, iol.co.za

SPX is going to 6000 (If maintains 5565)Spx is going to 6000 level, if it maintains level of 5565.
Note: This is not a buy/sell trade call.

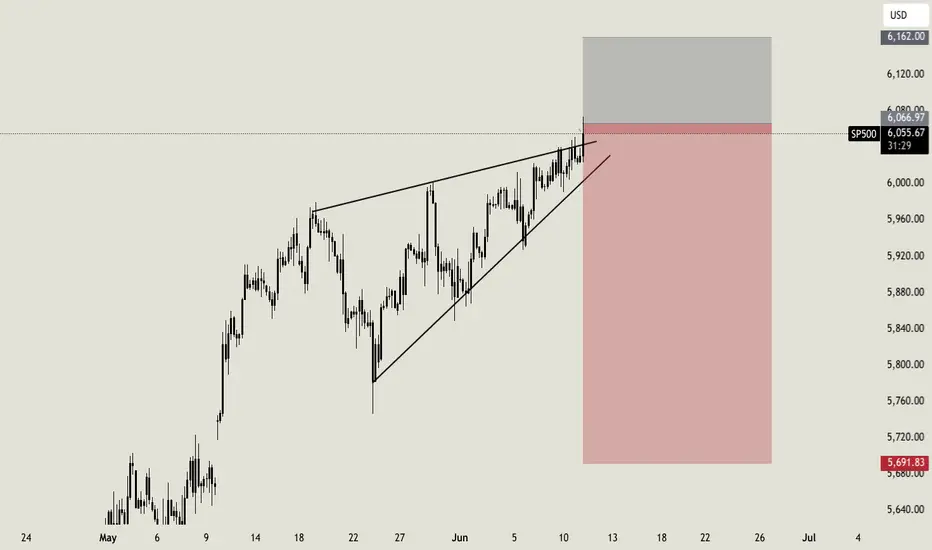
Bullish continuation?S&P500 is falling towards the support level which is an overlap support that line sup with the 61.8% Fibonacci retracement and could bounce from this level to our take profit.
Entry: 6,520.93
Why we like it:
There is an overlap support level that aligns with the 61.8% Fibonacci retracement.
Stop loss: 5,434.59
Why we like it:
There is a pullback support level that is slightly above the 50% Fibonacci retracement.
Take profit: 5,791.21
Why we lik eit:
There is a pullback resistance level that is slightly below the 78.6% Fibonacci projection.
Enjoying your TradingView experience? Review us!
Please be advised that the information presented on TradingView is provided to Vantage (‘Vantage Global Limited’, ‘we’) by a third-party provider (‘Everest Fortune Group’). Please be reminded that you are solely responsible for the trading decisions on your account. There is a very high degree of risk involved in trading. Any information and/or content is intended entirely for research, educational and informational purposes only and does not constitute investment or consultation advice or investment strategy. The information is not tailored to the investment needs of any specific person and therefore does not involve a consideration of any of the investment objectives, financial situation or needs of any viewer that may receive it. Kindly also note that past performance is not a reliable indicator of future results. Actual results may differ materially from those anticipated in forward-looking or past performance statements. We assume no liability as to the accuracy or completeness of any of the information and/or content provided herein and the Company cannot be held responsible for any omission, mistake nor for any loss or damage including without limitation to any loss of profit which may arise from reliance on any information supplied by Everest Fortune Group.

#ES1! "E-Mini S&P500" Index Market Bullish Robbery Plan🌟Hi! Hola! Ola! Bonjour! Hallo! Marhaba!🌟
Dear Money Makers & Robbers, 🤑 💰💸✈️
Based on 🔥Thief Trading style technical and fundamental analysis🔥, here is our master plan to heist the #ES1! "E-Mini S&P500" Index Market Heist. Please adhere to the strategy I've outlined in the chart, which emphasizes long entry. Our aim is to escape near the high-risk YELLOW MA Zone. It's a Risky level, overbought market, consolidation, trend reversal, trap at the level where traders and bearish robbers are stronger. 🏆💸"Take profit and treat yourself, traders. You deserve it!💪🏆🎉
Entry 📈 : "The vault is wide open! Swipe the Bullish loot at any price - the heist is on!
however I advise to Place buy limit orders within a 15 or 30 minute timeframe most recent or swing, low or high level. I Highly recommended you to put alert in your chart.
Stop Loss 🛑:
Thief SL placed at the Nearest / Swing low level Using the 3H timeframe (5440) Day/Swing trade basis.
SL is based on your risk of the trade, lot size and how many multiple orders you have to take.
🏴☠️Target 🎯: 5730
💰💵💸#ES1! "E-Mini S&P500" Index Money Heist Plan is currently experiencing a bullishness,., driven by several key factors. .☝☝☝
📰🗞️Get & Read the Fundamental, Macro Economics, COT Report, Geopolitical and News Analysis, Sentimental Outlook, Intermarket Analysis, Index-Specific Analysis, Future trend targets with Overall outlook score... go ahead to check 👉👉👉🔗🔗🌎🌏🗺
⚠️Trading Alert : News Releases and Position Management 📰🗞️🚫🚏
As a reminder, news releases can have a significant impact on market prices and volatility. To minimize potential losses and protect your running positions,
we recommend the following:
Avoid taking new trades during news releases
Use trailing stop-loss orders to protect your running positions and lock in profits
💖Supporting our robbery plan 💥Hit the Boost Button💥 will enable us to effortlessly make and steal money 💰💵. Boost the strength of our robbery team. Every day in this market make money with ease by using the Thief Trading Style.🏆💪🤝❤️🎉🚀
I'll see you soon with another heist plan, so stay tuned 🤑🐱👤🤗🤩
