S&P500 , can ascend further!The SPX is in a Bullish phase by Ascending Triangle.
🌟 Bullish signals are:
- Pivot Yearly
- Ascending Triangle
- PRZ ZONE
- break the Ascending Triangle
❗ and the Upward signals of market momentum are:
- moving Ema 200
⭐ Note if the PRZ is broken downwards with the strength of Bearish candles , this analysis of ours will be failed.
✅If this post was useful for you, like it ❤️ and if you think it is useful for your friends, be sure to send it to them.
_ _ _ _ _ _ _ _ _ _ _ _ _ _ _ _ _ _ _ _ _ _ _ _ _ _ _ _ _ _ _ _ _
🌍Thank you for seeing idea .
Have a nice day and Good luck.
Sp500index

The last hurrah is here. All aboard to 2400As projected yesterday, Intermediate wave 4 could be complete based on the early morning low on June 8. There is a slim chance Minor wave B inside of Intermediate wave 4 is the current location, but that will be invalidated if the index goes above 4300 tomorrow.
To recap. Intermediate wave 1 was 25 trading days and gained 360.62 points. Intermediate wave 2 dropped 121.2 points over 12 days for a retracement of 33.61%. Intermediate wave 3 then gained 251 points over 21 days which was a price extension of 135.99% from the starting point of Intermediate wave 1. Intermediate wave 4 was likely completed today and would have retraced 15.22% of wave 3 by only dropping 38.21 points over 3 days. I am surprised by the accuracy of the models to project such a shallow drop over very few days in Intermediate wave 4 but the historic data was spot on. I put is in Sub-millennial wave 1, Grand Supercycle wave 5, Supercycle wave 2, Cycle wave B, Primary wave C, Intermediate wave 5. I use shorthand to call it 152BC5
Intermediate wave 5 must now be less than the 21 days of Intermediate wave 3 as wave 3 cannot be the shortest wave. Based on models ending in 2BC5, strongest model agreement is on wave 5 to last 2 or 17 days, second most agreement is at 4, 5, and 18 days. The quartile movement extensions based on Intermediate wave 3’s movement (light blue lines) are 121.05%, 153.2%, and 186.17%. The first quartile of all historic movement reverses after a move to the 121.05% level which is 4352.12. The median movement reverses after a move to the 153.2% level which is 4432.81, while the third quartile is at 186.17% which is 4515.57.
Based on waves ending in BC5, largest model agreement places the length at 5 trading days in length, second most agreement is 6 and 18 days, third is 3, 4, 10, and 12 days. The quartile movement extensions (yellow level) are 122.06%, 137.71% and 153.2%. Final projections are based on waves ending in C5 where largest model agreement has the length at 4 days, second most at 6 days, third most at 5 days, fourth at 12 days. The quartile retracements (white line) 109.46%, 122.9%, and 151.06%.
There are also two major resistance lines in play. One stems from the end of Primary wave A from December 1, 2022 and aligned with the Intermediate wave B top from Primary wave B on February 2, 2023. The other trendline has been solid resistance since February 21st and the market never closed above it since then. If this second trendline proves the fatal resistance, it could be tested as late as June 26 around a level of 4352.12. If the first resistance line is the fatal level it could be around 4393.93 and achieved as soon as the day of the next Federal Reserve meeting on Wednesday.
I dramatically call this next top a fatal level in that I expect it to be the final market top for many years. This will be the end of Cycle wave B and a continuation of the Bear Market which ultimately topped on January 4, 2022. I am projecting the length of Intermediate wave 5 to last between 4 and 12 trading days. I have three key dates which could contain the top based on the historical data above. Day 4 is the next Federal Reserve rate decision on June 14th. Day 11 is June 26th where nothing major appears to be occurring which is the same on July 5 or Day 17. I do not expect the top to surpass 4410 and could possibly top out around 4393. 4393 is within 100 points from today’s close which means Intermediate wave 5 will likely be very fast. The TVC:VIX is very low right now and a huge indicator of complacency in an economy that is quickly slowing and on the immediate verge of higher inflation and/or recession. A break above the second mentioned resistance trendline may get the bulls fired up but I am 95% certain it is a false breakout and bull trap.
My initial calls for the bottom are around December 2024 somewhere between 2200-2400. I have been projecting this entire run up and final bottom since July of last year with pretty decent accuracy. I am using math, statistics and history to project forward market movement. I have figured this next drop could revolve around China taking Taiwan and disrupting the world’s microchip supply. Not sure if this happens next week but it could still be an issue that further escalates the selling over the next 12 months. There is a chance the US economy is heavily impacted now that students must continue paying their student loan debt and thus not spending money on luxury items or other facets of their daily lives. There is also a chance of Russia doing something exotic in Ukraine to attempt to upend the conflict. And as always the other black swan event most people have not seen coming. Metals will likely become more expensive and most companies selling luxury goods that are not necessary will get crushed (I am thinking NYSE:DIS and NYSE:DRI here). Casinos and gambling websites could have issues sometime next year when money starts to get very tight and people can not afford to make the gambles they will likely take in the beginning. Some companies will outright fail and go bankrupt while others will be forced to slash prices to remain relevant once the world comes out of this recession. Don’t panic, invest wisely.

QQQ: I might be wrong (Inverted Chart)I have been a staunch bear since about March. Since the lows expected a nice bounce but that we would resume
the downtrend at some point. Nothing has convinced me that this market would not do anything besides have another
period of pullbacks, until I inverted the QQQ today. From this perspective, I cannot help but see the very real possibility
of a double top at the very least. At that point though, there is no reason we couldn't keep going and make new highs.
The macro economic conditions are not ideal in the slightest but this might be the kind of bull that is largely absent retail
and will say that way until we actually start to top. A bull, minus retail, is what this looks like. You are not having investors
capitulate easily at all. Buyers have been positioned large and they plan on staying there for a while. Very hard to say.
This is by far the hardest market to judge, that I personally have participated in. I am thinking about taking some long positions
in certain companies, maybe even the Qs but I will be doing so cautiously.

One more down day and then...Strong chance Intermediate wave 4 ends tomorrow if Minor waves A and B are already completed. There is an off chance the marked wave A and B in yellow letters are only Minute waves 1 and 2 inside of wave A, however, the historical data was pretty adamant on Intermediate wave 4 only lasting around 2-4 days which makes the current chart setup very likely. Another key level comes into play that I original wrote off when the models first projected the bottom of Intermediate wave 4. The strongest models indicated the total Intermediate wave 4 retracement would only be 15.06% of Intermediate wave 3’s entire move. That level equates to 4261.48. The index is pretty much there already. However, I believe we have just completed Minute wave 2 to the upside inside of the final Minor wave C. Confirmation of this position will likely occur with a significant drop within the first 2 hours of trading tomorrow and could see a gap down on the premarket economic data.
Based on the historical data, all models and datasets point to Minor wave C lasting 0-2, and most likely only one day. Day 1 is officially tomorrow and will contain the likely market bottom that won’t be breached for 1-2 months. Based on waves ending in C4C, the likely bottom for Minor wave C will be at the 114.61% retracement of Minor wave A’s movement, or 120.8%, or 137.50%. Based on waves ending in 4C, the median retracement levels will be 113.25%, 126.76% or 174.83%. Through the middle of all these levels lies a horizontal trendline which has provided strong resistance during the course of Primary wave C, however, it was broken through on June 2 and could provide support for tomorrow’s likely bottom. The final bottom does not appear to be below 4236.01 and may only be as low as 4254. If we gap down at the open it would likely gap below 4254 which could place bottom around 4240. I do not foresee the original projections down around 4210 in play. Once again, the open holds the key to the day.
I plan to analyze again after tomorrow and project the final market top for 2023-2026 by this weekend.

Last Hurrah of the Bull, or the Next Leg Up? Day 3S&P 500 INDEX MODEL TRADING PLANS for WED. 06/07
The precarious rally of the last month has been baffling many, with the lack of the breadth in the rally was concentrated in just a handful of big-tech names. With the major news cycles in the rear view mirror, that red hot bull could be losing steam. If the rally does not dissipate this week, then it could be indicative of yet another leg up that could obliterate the shorts.
As we first stated to start this week, if you are a bull, it may be prudent to take some profits off the table; if you are a bear, you may begin looking for entries.
Positional Trading Models: Our positional models indicate opening a short on a break below 4275 with a hard stop at 4307.
By definition, positional trading models may carry the positions overnight and over multiple days, and hence assume trading an instrument that trades beyond the regular session, with the trailing stops - if any - being active in the overnight session.
Aggressive/Intraday Models: Our aggressive, intraday models indicate the trading plans below for today.
Aggressive, Intraday Trading Plans for WED. 06/07:
For today, our aggressive intraday models indicate going long on a break above 4291, 4280, or 4268 with a 9-point trailing stop, and going short on a break below 4288, 4277, 4265, or 4250 with a 9-point trailing stop.
Models indicate explicit short exits on a break above 4255. Models also indicate a break-even hard stop once a trade gets into a 4-point profit level. Models indicate taking these signals from 11:16am ET or later.
By definition the intraday models do not hold any positions overnight - the models exit any open position at the close of the last bar (3:59pm bar or 4:00pm bar, depending on your platform's bar timing convention).
To avoid getting whipsawed, use at least a 5-minute closing or a higher time frame (a 1-minute if you know what you are doing) - depending on your risk tolerance and trading style - to determine the signals.
(WHAT IS THE CREDIBILITY and the PERFORMANCE OF OUR MODEL TRADING PLANS over the LAST WEEK, LAST MONTH, LAST YEAR? Please check for yourself how our pre-published model trades have performed so far! Seeing is believing!)
NOTES - HOW TO INTERPRET/USE THESE TRADING PLANS:
(i) The trading levels identified are derived from our A.I. Powered Quant Models. Depending on the market conditions, these may or may not correspond to any specific indicator(s).
(ii) These trading plans may be used to trade in any instrument that tracks the S&P 500 Index (e.g., ETFs such as SPY, derivatives such as futures and options on futures, and SPX options), triggered by the price levels in the Index. The results of these indicated trades would vary widely depending on the timeframe you use (tick chart, 1 minute, or 5 minute, or 15 minute or 60 minute etc.), the quality of your broker's execution, any slippages, your trading commissions and many other factors.
(iii) These are NOT trading recommendations for any individual(s) and may or may not be suitable to your own financial objectives and risk tolerance - USE these ONLY as educational tools to inform and educate your own trading decisions, at your own risk.
#spx, #spx500, #spy, #sp500, #esmini, #indextrading, #daytrading, #models, #tradingplans, #outlook, #economy, #bear, #yields, #stocks, #futures, #inflation, #recession, #fomc, #fed, #fedspeak, #regionalbanks, #debtceiling, #china, #softlanding

CORRECTION previous accumulation count SPY (Going much higher!!)This idea is a correction to my previous count for the SPY since the break out of the accumulation range. I chose the "close" method for the point & figure chart and lost data as a consequence. The correct method is "high/low" which is shown in this count.
Chart setup:
- Daily, Traditional, 3 box reversal, High/Low (1 pt scale).
The SPY is going much higher before any potential bear market.
Good luck

Short SP (eng)Any phase of the market, no matter how long it lasts, ends
A hell of a long and exhausting trade
The time has finally come.
Opened Short of 05.05.2023 18.59 at 4283
Previous Long of 06.01.2023 closed at +9.83%.
Let's see what surprises the market is preparing for us this time

US500 - distribution zone?US500 - distribution zone?
These are the Keylevels to watch in the next hours.
I want to short US500 under the support line, this neckline looks good for an entry.
Also, this zone looks more and more like a distribution zone.

SPY SHORT 06/06/2023SPY SHORT 06/06/2023
Currently at extreme high and broke the supply zone.
We also formed a bearish divergence.
We also have a nPOC at 4276.6 at the same level we have our Equilibrium. Targeting 4276.6 for Take Profit

Last Hurrah of the Bull, or the Next Leg Up? Day 2S&P 500 INDEX MODEL TRADING PLANS for TUE. 06/06
The precarious rally of the last month has been baffling many, with the lack of the breadth of the rally while it still managed to keep going up on the run up in just a handful of big-tech names. With the major news cycles in the rear view mirror, the move up could be losing steam but if not then it could be indicative of yet another leg up that could obliterate the shorts.
If you are a bull, it may be prudent to take some profits off the table; if you a bear, caution is warranted before establishing any new shorts.
Positional Trading Models: Our positional models indicate staying flat for today. No specific positional trading plans are indicated.
By definition, positional trading models may carry the positions overnight and over multiple days, and hence assume trading an instrument that trades beyond the regular session, with the trailing stops - if any - being active in the overnight session.
Aggressive/Intraday Models: Our aggressive, intraday models indicate the trading plans below for today.
Aggressive, Intraday Trading Plans for TUE. 06/06:
For today, our aggressive intraday models indicate the same trading plans as yesterday: going long on a break above 4291 or 4268 with a 9-point trailing stop, and going short on a break below 4300, 4288, 4278, or 4264 with a 9-point trailing stop.
Models indicate explicit short exits on a break above 4303 or 4281. Models also indicate a break-even hard stop once a trade gets into a 4-point profit level. Models indicate taking these signals from 11:01am ET or later.
By definition the intraday models do not hold any positions overnight - the models exit any open position at the close of the last bar (3:59pm bar or 4:00pm bar, depending on your platform's bar timing convention).
To avoid getting whipsawed, use at least a 5-minute closing or a higher time frame (a 1-minute if you know what you are doing) - depending on your risk tolerance and trading style - to determine the signals.
(WHAT IS THE CREDIBILITY and the PERFORMANCE OF OUR MODEL TRADING PLANS over the LAST WEEK, LAST MONTH, LAST YEAR? Please check for yourself how our pre-published model trades have performed so far! Seeing is believing!)
NOTES - HOW TO INTERPRET/USE THESE TRADING PLANS:
(i) The trading levels identified are derived from our A.I. Powered Quant Models. Depending on the market conditions, these may or may not correspond to any specific indicator(s).
(ii) These trading plans may be used to trade in any instrument that tracks the S&P 500 Index (e.g., ETFs such as SPY, derivatives such as futures and options on futures, and SPX options), triggered by the price levels in the Index. The results of these indicated trades would vary widely depending on the timeframe you use (tick chart, 1 minute, or 5 minute, or 15 minute or 60 minute etc.), the quality of your broker's execution, any slippages, your trading commissions and many other factors.
(iii) These are NOT trading recommendations for any individual(s) and may or may not be suitable to your own financial objectives and risk tolerance - USE these ONLY as educational tools to inform and educate your own trading decisions, at your own risk.
#spx, #spx500, #spy, #sp500, #esmini, #indextrading, #daytrading, #models, #tradingplans, #outlook, #economy, #bear, #yields, #stocks, #futures, #inflation, #recession, #fomc, #fed, #fedspeak, #regionalbanks, #debtceiling, #china, #softlanding

SPY S&P 500 etf price after the Debt Ceiling DealSPY, the S&P 500 index etf, perfectly touched the resistance predicted in the last article:
Now I`m waiting for a retracement and considering the following puts:
2023-8-18 expiration date
$408 strike price
$4.50
Of course, it`s not trading advice!
Looking forward to read your opinion about it!

SPX: is 4.300 a point of reversal?There are two major events which marked the developments on the US markets during the previous week. The first one (and probably most important) is that the debt-ceiling agreement was accomplished and approved by the US Congress. It was also signed by the US President on Saturday. The second development was related to much better-than-expected job figures for the US, where 339K new jobs were added in May, compared to 190K expected by the market. These two important information shaped the sentiment of investors, where S&P 500 reached levels from August last year, with its highest weekly level at 4.289, reached on Friday.
Charts are pointing that the S&P500 is currently chasing a peak from August last year, when the index reached level of 4.320. The US economy seems resilient to monetary moves, which is expressed in high earnings. This might further support the index, still RSI is pointing that potential reversal point might be soon reached. There is still space for a move to the upside, however, it should not be expected that August 2022 might be breached. Instead, the index might revert just a bit to the downside, potentially toward 4.250 or lower.

Last Hurrah of the Bull, or the Next Leg Up?S&P 500 INDEX MODEL TRADING PLANS for MON. 06/05
The precarious rally of the last month has been baffling many, with the lack of the breadth of the rally while it still managed to keep going up on the run up in just a handful of big-tech names. With the major news cycles in the rear view mirror, the move up could be losing steam but if not then it could be indicative of yet another leg up that could obliterate the shorts.
If you are a bull, it may be prudent to take some profits off the table; if you a bear, caution is warranted before establishing any new shorts.
Positional Trading Models: Our positional models indicate staying flat for today. No specific positional trading plans are indicated.
By definition, positional trading models may carry the positions overnight and over multiple days, and hence assume trading an instrument that trades beyond the regular session, with the trailing stops - if any - being active in the overnight session.
Aggressive/Intraday Models: Our aggressive, intraday models indicate the trading plans below for today.
Aggressive, Intraday Trading Plans for MON. 06/05:
For today, our aggressive intraday models indicate going long on a break above 4291 or 4268 with a 9-point trailing stop, and going short on a break below 4300, 4288, 4278, or 4264 with a 9-point trailing stop.
Models indicate explicit short exits on a break above 4303 or 4281. Models also indicate a break-even hard stop once a trade gets into a 4-point profit level. Models indicate taking these signals from 10:16am ET or later.

Latest Market Top Possibly In, Expect Some Red This WeekNext leg will be down, whether it continues down tomorrow or briefly moves up is to be seen. IF Intermediate wave 3 ended, it lasted less than the computer modeled 25 days as I forecasted. This would further mean Intermediate wave 5 must be less than or equal to the length of Intermediate wave 3 which was 20 days per the close on Friday.
The models indicate Intermediate wave 4 could be quick and not too deep. Based on waves ending in 2BC4, wave 4 could last 2-12 days with strongest agreement on 2 days. The drop could be as shallow as a 13.73% or 15.06% retracements which are the light blue levels on the chart. That distance and duration seems too shallow initially. The next set of models are based on waves ending in BC4. The strongest agreement for duration remains at 2 days, with second strongest at 12 days followed by 4 and 10 days. The quartile retracement levels are 23.9%, 46.49% and 55.05%--the yellow levels on the chart. Based on waves ending in C4, the strongest agreement on duration as it 2 trading days again, second at 12 days, third at 4 days. Retracement quartiles are the white lines in the chart and correspond to 27.2%, 42.48%, and 55.05%.
An additional consideration for the bottom is an intersection of the lines from the models and the support trendline from March 13. This line was broken for a single day at the probable end of Minute wave 4 inside of Minor wave 3 in Intermediate wave 3. A 2 day drop seems too quick while more than 10 could be too long. IF Intermediate wave 3 ending from Friday holds. The bottom of Intermediate wave 4 could be completed sometime this week or at the beginning of next week. I am currently placing the bottom to occur this Friday possibly around 4187-4210. This would be a shallow and slow drop considering the volatility of the past year. There is strong support around 4172-4177 if a quick drop occurs within 2 days but that target fades by day 3 (Wednesday).
Intermediate wave 4 is setting up to be short lived and could be followed by a short Intermediate wave 5 as well. Early projections place the final market top over the next 4-6 years later this month around 4400, although we could fall just shy of 4400. Still think the Fed, PPI, and CPI can catapult the market up after our quick jaunt down with Intermediate wave 4. A logical black swan for the top is still a Taiwan invasion that rocks all industries relying on microchips or parts from Taiwan. This would likely delay the AI future and all companies heavily invested in it. Next analysis to follow when Intermediate wave 4 appears to have wrapped.

SPY going up based on point and figure count of accumulationThis idea is based on Wyckoff's method for calculating price targets using the point & figure method to count the difference in columns between beginning and end of accumulation prices and projecting it from the middle point of the accumulation range.
All other info is on the chart!

SP500: Technical Rebound.... is comingFrom a technical point of view, the trend on intraday chart is bearish, but at the same time, after the completion of wave 5, I expect a very interesting technical rebound (wave 4 re-test).
Trade with care!
Like if my analysis is useful.
Cheers!

My personal analysis is logical to SPXThe price is upward, which indicates that the trend is upward, so we will search for buying, and I have placed the buying or selling points, in the event that the price breaks the level that was talked about, in order to know more about what the price might do, and I analyzed it in a technical and rational way .
In the case of buying, we will wait for our order block to ease and fill the gaps, as well as the acquisition of liquidity, but in the case of selling, we will wait for the bottom to be broken, to confirm that the new trend has been formed and that we will become in a downward trend, and what confirms this to us is that the blood has come with the bottom that was created by If the price is broken, we will look to sell, and there is another support below it, and that support seems to be strong, so we will take the first target there, and we will wait for the price and we will wait for the price’s reaction to it. If we notice that it wants to change the direction, we will close all our deals. The long term, because if that level is broken, we will have a strong downside trend, because we will break strong support, which simply turns into resistance.

S&P500 Visits an Important Weekly Resistance at $4300S&P 500 has experienced a breakout and subsequent pullback on a key level in the daily timeframe, leading to an important weekly resistance. We observed a significant sell-off pressure in the past, and it is crucial to closely monitor the price reaction within this highlighted zone to determine future possibilities.

Pivoting to Jobs, Inflation, and Interest Rates?S&P 500 INDEX MODEL TRADING PLANS for FRI. 06/02
We started last trading week with our trading plans on Monday titled: "Debt Ceiling Deadline Likely to Whipsaw the Markets", and these words: "Expect the approaching debt ceiling deadline to attract both bulls and bears to heightened speculation, resulting in some whipsaw movements until the deadline passes and the dust settles".
With the Senate passing the debt ceiling bill, the curtains are now drawn on that drama. With the much hotter than expected NFP numbers, the markets could soon be pivoting to a focus on the macroeconomic factors again. Currently, our directional models indicate no bias and are in an indeterminate state.
Positional Trading Models: Following the trading plans published yesterday, our positional models went short at 4225.83 with a hard stop at 4242. If the stop is hit, the models indicate staying flat for the rest of the session.
By definition, positional trading models may carry the positions overnight and over multiple days, and hence assume trading an instrument that trades beyond the regular session, with the trailing stops - if any - being active in the overnight session.
Aggressive/Intraday Models: Our aggressive, intraday models indicate the trading plans below for today.
Aggressive, Intraday Trading Plans for FRI. 06/02:
For today, our aggressive intraday models indicate going long on a break above 4250, 4231, 4206, or 4197 with a 9-point trailing stop, and going short on a break below 4247, 4227, 4194, or 4184 with a 9-point trailing stop.
Models indicate explicit short exits on a break above 4189. Models also indicate a break-even hard stop once a trade gets into a 4-point profit level. Models indicate taking these signals from 09:46am ET or later.
By definition the intraday models do not hold any positions overnight - the models exit any open position at the close of the last bar (3:59pm bar or 4:00pm bar, depending on your platform's bar timing convention).
To avoid getting whipsawed, use at least a 5-minute closing or a higher time frame (a 1-minute if you know what you are doing) - depending on your risk tolerance and trading style - to determine the signals.
(WHAT IS THE CREDIBILITY and the PERFORMANCE OF OUR MODEL TRADING PLANS over the LAST WEEK, LAST MONTH, LAST YEAR? Please check for yourself how our pre-published model trades have performed so far! Seeing is believing!)
NOTES - HOW TO INTERPRET/USE THESE TRADING PLANS:
(i) The trading levels identified are derived from our A.I. Powered Quant Models. Depending on the market conditions, these may or may not correspond to any specific indicator(s).
(ii) These trading plans may be used to trade in any instrument that tracks the S&P 500 Index (e.g., ETFs such as SPY, derivatives such as futures and options on futures, and SPX options), triggered by the price levels in the Index. The results of these indicated trades would vary widely depending on the timeframe you use (tick chart, 1 minute, or 5 minute, or 15 minute or 60 minute etc.), the quality of your broker's execution, any slippages, your trading commissions and many other factors.
(iii) These are NOT trading recommendations for any individual(s) and may or may not be suitable to your own financial objectives and risk tolerance - USE these ONLY as educational tools to inform and educate your own trading decisions, at your own risk.
#spx, #spx500, #spy, #sp500, #esmini, #indextrading, #daytrading, #models, #tradingplans, #outlook, #economy, #bear, #yields, #stocks, #futures, #inflation, #recession, #fomc, #fed, #fedspeak, #regionalbanks, #debtceiling, #china, #nfp, #jobs

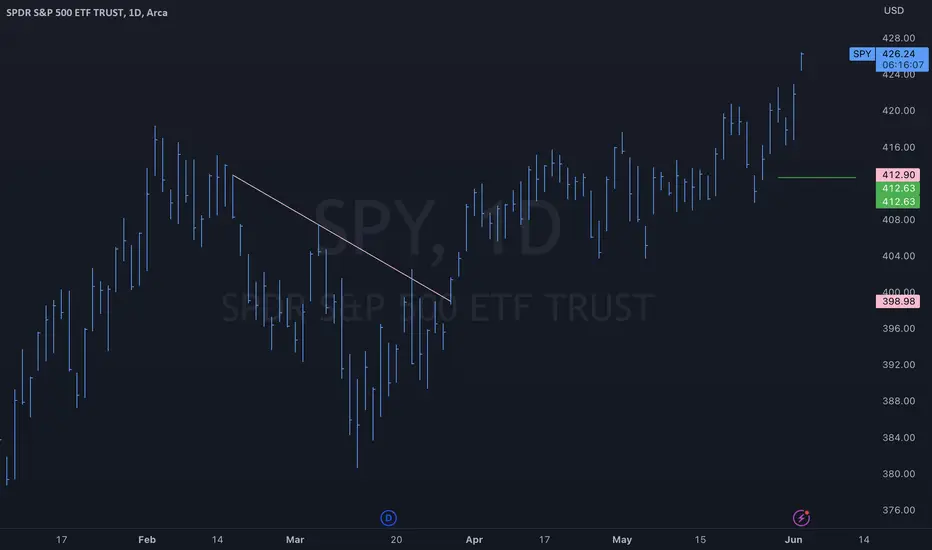
$SPY Inverse Head & Shoulders AMEX:SPY Inverse Head & Shoulders hit my target price today. Time to take some of the table. The green line is support.
Debt Ceiling Deal Euphoria - RekindledS&P 500 INDEX MODEL TRADING PLANS for THU. 06/01
We started this trading week yesterday with these words: "Now that the Debt Ceiling drama is apparently over ("apparently" is the keyword there), can the markets continue to be intoxicated on the nVidia-A.I. exuberance and continue the bullish leg or get back to the macro-economic fundamentals of inflation, valuation, china-slowdown (bad news good news here, with hopes of China stimulus?) etc.? A couple of sessions into this shortened week shall reveal. Till then, caution might be warranted on the part of the bulls".
We started last trading week with our trading plans on Monday titled: "Debt Ceiling Deadline Likely to Whipsaw the Markets", and these words: "Expect the approaching debt ceiling deadline to attract both bulls and bears to heightened speculation, resulting in some whipsaw movements until the deadline passes and the dust settles".
The dust might be settling this week or early next week. The direction in which it settles would determine the next directional bias in the markets. Currently, our directional models indicate no bias and are in an indeterminate state.
Positional Trading Models: Following the trading plans published earlier in the week, our positional models went short on the close yesterday, at 4179.84, with a 52-point trailing stop. With the session's low recorded at 4171.64, the current trigger of the stop is at 4231.84. If this is hit, the models indicate going short again on a break below 4228 with a hard stop at 4242.
By definition, positional trading models may carry the positions overnight and over multiple days, and hence assume trading an instrument that trades beyond the regular session, with the trailing stops - if any - being active in the overnight session.
Aggressive/Intraday Models: Our aggressive, intraday models indicate the trading plans below for today.
Aggressive, Intraday Trading Plans for THU. 06/01:
For today, our aggressive intraday models indicate going long on a break above 4222, 4198, 4187, or 4156 with a 9-point trailing stop, and going short on a break below 4125, 4194, 4184, or 4150 with a 9-point trailing stop.
Models indicate explicit exits for the day. Models also indicate a break-even hard stop once a trade gets into a 4-point profit level. Models indicate taking these signals from 01:46pm ET or later.
By definition the intraday models do not hold any positions overnight - the models exit any open position at the close of the last bar (3:59pm bar or 4:00pm bar, depending on your platform's bar timing convention).
To avoid getting whipsawed, use at least a 5-minute closing or a higher time frame (a 1-minute if you know what you are doing) - depending on your risk tolerance and trading style - to determine the signals.
(WHAT IS THE CREDIBILITY and the PERFORMANCE OF OUR MODEL TRADING PLANS over the LAST WEEK, LAST MONTH, LAST YEAR? Please check for yourself how our pre-published model trades have performed so far! Seeing is believing!)
NOTES - HOW TO INTERPRET/USE THESE TRADING PLANS:
(i) The trading levels identified are derived from our A.I. Powered Quant Models. Depending on the market conditions, these may or may not correspond to any specific indicator(s).
(ii) These trading plans may be used to trade in any instrument that tracks the S&P 500 Index (e.g., ETFs such as SPY, derivatives such as futures and options on futures, and SPX options), triggered by the price levels in the Index. The results of these indicated trades would vary widely depending on the timeframe you use (tick chart, 1 minute, or 5 minute, or 15 minute or 60 minute etc.), the quality of your broker's execution, any slippages, your trading commissions and many other factors.
(iii) These are NOT trading recommendations for any individual(s) and may or may not be suitable to your own financial objectives and risk tolerance - USE these ONLY as educational tools to inform and educate your own trading decisions, at your own risk.
#spx, #spx500, #spy, #sp500, #esmini, #indextrading, #daytrading, #models, #tradingplans, #outlook, #economy, #bear, #yields, #stocks, #futures, #inflation, #recession, #fomc, #fed, #fedspeak, #regionalbanks, #debtceiling, #china

SELL CONTINUATION ON S&P 500Hey Traders,
This is the setup that spot the bearish continuation for those that missed the first trade opportunity on S&P 500.
Watch out for the pullback to the supply zone.

SELL TRADE SETUP ON S&P 500Hey Traders,
Check this analysis out on S&P 500.
The pair is at the last phase of the ascending wedge pattern and a nice fall from grace could be well anticipated for.
Keep a close tab on it
