Sp500long
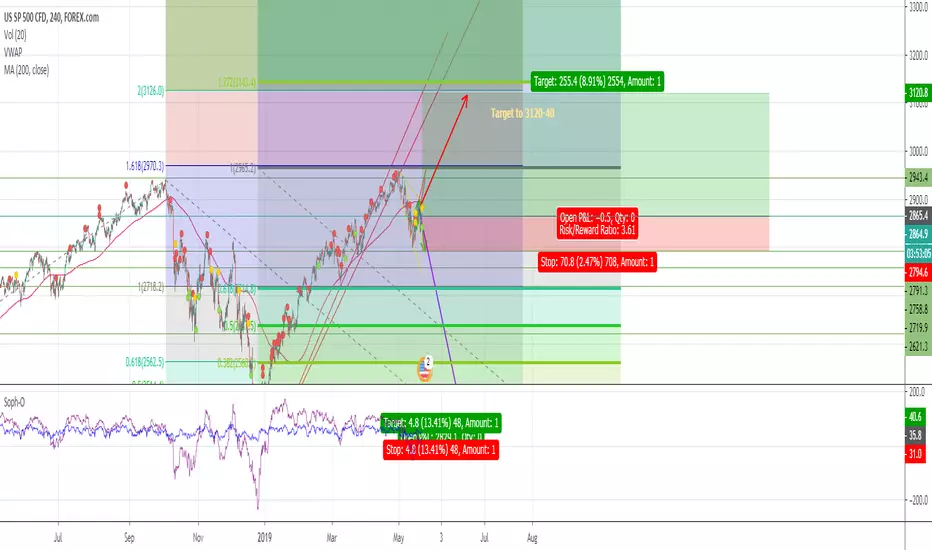
S&P500 - BULLISHS&P 500 looks very bullish.
Target 1: 3550
Blue triangle indicates the current range.
Green box is buy.
Red box is sell.
Blue line indicates potential support/resistance .
Green line indicates t/p.
This is a log chart.
This chart is made using fib channels.
This is not financial advice. All charts shown on my page, including this one, are just for fun.
If you enjoy my ideas please give this post a like and follow my page if you would like to see future posts! :)

SP500 SPY ETF supply and demand analysis and forecastSP500 QQQ ETF supply and demand analysis and forecast for 22nd April 2019. SP500 SPY ETF is trying to break weekly supply at all time highs around 293.
There is a clear long term weekly and monthly uptrend with all time highs previously eliminated and brand new demand zones created on bigger timeframes like the one on the weekly timeframe around 281.
In an uptrend, supply levels are eliminated and demand levels are created and respected.NASDAQ QQQ ETF has already broken all time highs, expecting to see similar price action on QQQ and other american indexes like Dow Jones and Russell 2000 indexes.The bigger the impulse created by new imbalances of demand the better. There is no reason to go short counter-trend on SP500 SPY ETF when everything is heading north and new demand levels are being created. Trading with the trend is always higher odds.

S&P500 - Target 3100 I'm still bearish, but I believe price needs to move a little higher before the bears appear. A nice bull trap to break the all time high, before a reversal to the 1800 handle.
Calculating the mid point of the wave and using symmetry, the target should be around the 3100 level. Coming from another angle, I used another method to get close to the same result.
So the chart shows, both methods have a market top around 3000-3100. I have also drawn in the Elliot waves, which align with the mid point (wave 3). There has been no weekly or monthly sell pivot, and
with MACD indicator is confirming a continuation on the recent move up. Price still has more work to be done at higher prices.

SPX SP 500 LONG But possible Trendchange to come
Hello to all who follow my charts.
Today has been an interesting day.
Of course, the S & P 500 was still long and continued up the long trendline
But today we experienced a reversal day and that always does not bode well for the respective trend direction.
The day started normally, then went much higher in the end but to go deeper from the market. A reversal just.
Often, such a reversal day announces a turnaround.
So please be careful with long positions currently.
We have to see tomorrow what happens.
If SP 500 continues to move up the trend line, negate the Reversel signal or begin to tip over the trend lines.
We will have to take a close look.
Currently, the long scenario is definitely at risk.
----------------
--This information is not a recommendation to buy or sell. It is to be used for educational purposes only .Alllways do your own research---
----------------

#SP500 On the way to another summit?As can be seen in the graph above, resistance has been breached and as you know we have a simple rule if support or resistance breaks it is very good to enter the market in this case we recommend buying with a target price of 2940 At this price, the sp500 will have a real test and we will see whether it will pass it successfully or that it has created a double top pattern
Buy sp500:
Entre Price: 2845
Stop loss: 2790
Take Profit: 2940

S&P 500 e-mini futures buy opportuntiesS&P 500 e-mini futures ES is offering buy opportunities with weekly demand level around $12737 in control. It took two weeks for new weekly demand to be formed after eliminating very badly structured weekly supply around $2820. There is nothing to stop price from rallying to S&P500 e-emini futures upper weekly supply zone around 2907.
No shorts are allowed, only longs at new areas of demand. If you are trading other trading strategies or even options, you can use this S&P500 e-mini futures analysis as an extra point to support your longs. We do not use any kind of indicators, we do not need indicators to plan a trade using supply and demand imbalances but if you use them, this analysis can help you.
You can use options to plan your trades, plain vanilla short term or longer term longs calls or bullish spreads to buy S&P500 e-mini futures. No shorts are allowed. Bullish bias.

SPX LONG S&P 500 Taken out The Resistance on Daily ViewHello to all who watch my charts.
Contrary to the opinion of many here is in my view S & P 500 a Long Setup.
As you can see we had it at the beginning of March
a short trend which I marked with the orange trend lines.
Now, however, the index has risen above all short resistance and has both major resistance levels
which I marked purple. In the near future no direct resistance is to be seen.
Next is at around 2870
That's why I see these Index in a long trend.
To be cautios here , its needed that SPX fall below
2800 and
2786
at end of day chart
If that wil happen the long setup is gone.
----------------
--This information is not a recommendation to buy or sell. It is to be used for educational purposes only .Alllways do your own research---
-----------------


Which side will the #sp500 choose?For the past 14 days, the price of the S & P500 has been stuck between 2767 and 2813. We believe that because of the wait for Trump and China, will they reach an agreement or not? If the Chinese and the Americans reach this agreement, it is good for sp500 and if not is bad, All this in terms of Fundamental Analysis, In terms of technical analysis we see in the graph above that we are really close to serious resistance, in case the sp500 will succeed in breaking the resistance the increase in the index will be serious, Since we are at the bottom of the last 14 day range and the trend is uptrend we recommend buying with a lot of caution
Buy SP500:
Stop loss: 2760
Take Profit: 2910

SP500 FUTURO ES LONGMantenemos la idea de continuidad alcista con la ruptura del viernes pasado, hasta alcanzar el beneficio 1 a 1, para desplazar el stop loss y consolidad beneficios.
www.yatrading.com
www.yatrading.es

SP500 a punto de hacer una ruptura de banderin bajista hola a todos la ultima vez di mi anaiisis sobre la caida de un HCH bajista la cual la detuvieron con una beartrap momentanea y buscando romper la resistencia anterior la cual no pudieron en los dias de esta forma se puede interpretar por un lado como un triple techo si observan bien la grafica y al mismo tiempo muestra un banderin bajista esto va traer muchas consecuencias a todo el mercado bursatil y todos sus indices de momento por ondas elliot en la caida de se hizo una onda elliot 1 en forma de ABC y despues correccion alcista extendida para hacer una onda elliot 2 een la cual esperabamos antes y llego casi a los 2800 puntos ahora si se llega a dar la ruptura que deberia de darse entonces tendriamos una caida como una onda elliot 3 por los 2429 puntos o los 2346 puntos recomiendo hacer salidas escalonadas es lo mas recomendable para los proximos dias para la onda 4 seria en la zona de los 2455 puntos y como onda 5 en los 2250 puntos para terminar de una gran onda 3
dejen un me gusta tambien pueden seguir y hacer donaciones por medio de criptomonedas
visitame en el grupo
t.me
donaciones
BTC: 1GsiYi5qjgGN6N4t8QhRYVnLwokaqKrLbj
ETH: 0x6a38ad5d1940f3e932e05ff9ab1467a262eab931
LTC: LZaW11HNzzVKoYWCpDydaKpjcsiBtUpQRw

Target reached : Long for some retracements until invalidationThere are in my opinion quite a few reasons to go long (potential sharp countertrend rally and pullback) before the global downtrend resumes, but we're still never too certain. Let's see what happens in the coming days. Let's hope no black swans will kill the markets just after the holidays.

buy the dip at 2325 on ma 50 monthly adust your trailing stopas we get stopped with few profit on the trailing stop in the last trade on sp500
this time he touched deeply the ma50 monthly and is a big big support before end of years after down around 20%
so i expect a more bif rebound and got more profit that your last trade.
i proceed the same : buy at 2325 and make a stop loss when he reach 2350 at my entry point +5 pips for fun (psychological profit)
and every 10 pts i will up my stop loss of 10 pts also until he reach if he reach lol 24xx
i hope on this trade to take at least 50 (500) pts
not if he down again direct at 2300 and a bit less i will add 1 lot
i will comment in almost real time the trade

Short Fib 23,6% now. Next short target 1900points OR retracementWhen S&P500 breaks the current level of ~2300 area, chart can drop to ~1900 levels!! But, there can also be a retracement and price will rise up again, even to ~3000 area. All depends of sentiment in the market. Fibonacci only shows what will happen when price bottom or price top gets broken, not if these levels will become broken. But IF they get broken, Fibonacci predicts which price level will be reached.
February 8, 2018 I published: "February March April I expect an horizontal move at S&P500 . After the horizontal movement we can expect a climb to 3000 points. This is just normal pattern. S&P500 has a cycle of 2/3 months. After a big short an even big long is coming of an equal percentage. OR, THE TREND REVERCES AND WE GO DOWN !" ..... Now it's December and the horizontal line came to an end. It is interesting what is going to happen now!
Will price retrace and go further long to 3000 points? or will it decline further and break through to 2000 area?
Also I invest in Crypto currencies and I trade CFD's. When you want to invest in crypto, I advise you to buy 'real coins' because on long term that will give you far more profit than speculate the chart with CFD's. I have bought Bitcoin , Bitcoin Cash , Ethereum , XRP-Ripple, ReddCoin, FeatherCoin, Adcoin ( ACC ), Bunny Token and Stellar. I still believe in crypto for the long- term!
-------------------------------------------------------------------------------------------------------------------------------------------
My strategy
My main strategy is called 'cycle-trading'. After years of learning and practicing after I bought a teaching-package from a visionair, I found a way of how to trade successful with CFD's on the stock-market. Every stock is following an certain cycle which repeats itself. So, movements are often appearing in the same percentage, aswel long as short. This cycles appear at all levels; when you analyse the chart at 1 month, 1 week, 1 day, 1 hour. (others I don't use). This is the case, because all in life is build by the fibonacci sequence. When you analyse the chart, you'll also see the stock market is behaving itself as the fibonacci sequence.
How do I decide to open a position or not? First I analyse:
- Fibonacci pattern
- Sentiment on the market
- Own created indicators
- Moving-averages and Bollinger-Bands
Trading means investing. Sometimes you lose more than you win in the beginning of a period!
Don't forget to follow me, so you get updated when I post new analysis.
Thank you for following and Succes with trading !
Richard from Rich.Exclusive.Trading

Its time to go BULLy on US market. Long time investition.OH YEAH! Its going to get hot. S&P index will gonna rise again after small pause. Goal is somewhere near 3200, but don't be greedy.
Analyses based on Elliott Wave Theory.

SP500 continua su caida y sera de forma abismalde momento anteriormente se esperaba los 2 camino o rompia al alza con un HCH alcista para hacer un expaded flat correction o era una bulltrap para continuar la caida ahora se ah visto un HCH bajista que daria a una onda 3 en elliot asi que puede en darle con confianza apostar a la caida esto no lo va a parar nadie y debe hacer su correccion como se debe

ES Higher Towards 2850With Trump and Xi meeting at the G20 in Argentina, will we see a trade resolution that will spark a run higher for the year end?


S&P500 - Period of sideways consolidation in a secular bullrun. SP500 index- Secular bullrun since 2008. Marked mostly by periods of green UpTrend lines. Punctated by short periods of consolidation in purple rectangles.

MA 20 days touched. When breaks 2806, possible retracementMoving Average 20 days is touched. When it breaks 2806 points, possible retracement to 2759. Stop loss at 2820 when short order opens.
February 8, 2018 I published: "February March April I expect an horizontal move at S&P500. After the horizontal movement we can expect a climb to 3000 points. This is just normal pattern. S&P500 has a cycle of 2/3 months. After a big short an even big long is coming of an equal percentage. OR, THE TREND REVERCES AND WE GO DOWN !" ..... Now it's August so the horizontal line is longer than expected but as you can see the grey squares were set like they are already at the beginning of this year. Exactly now in the corner of the grey square, the chart is starting to climb! STILL BULLISH!
So, I still expect a long to more than 3000 points, when the price passes 2.880,00. Ofcourse, we will experience retracements in the mean time, like this one.
I invest in Crypto currencies and I trade CFD's. When you want to invest in crypto, I advise you to buy 'real coins' because on long term that will give you far more profit than speculate the chart with CFD's. I have bought Bitcoin, Bitcoin Cash, Ethereum, XRP-Ripple, ReddCoin, FeatherCoin, Adcoin ( ACC ), Bunny Token and looking for others every day! Bunny Token gave me good profit so far! I bought these in Pre-sale. I expect this is going to become huge!
Interesting coins, which I am looking to buy:
- EOS
- QASH
- Bitcoin-Gold
Do you have some good tips for crypto coins? let me know!
-------------------------------------------------------------------------------------------------------------------------------------------
My strategy
My main strategy is called 'cycle-trading'. After years of learning and practicing after I bought a teaching-package from a visionair, I found a way of how to trade successful with CFD's on the stock-market. Every stock is following an certain cycle which repeats itself. So, movements are often appearing in the same percentage, aswel long as short. This cycles appear at all levels; when you analyse the chart at 1 month, 1 week, 1 day, 1 hour. (others I don't use). This is the case, because all in life is build by the fibonacci sequence. When you analyse the chart, you'll also see the stock market is behaving itself as the fibonacci sequence.
How do I decide to open a position or not? First I analyse:
- Fibonacci pattern
- Sentiment on the market
- Own created indicators
- Moving-averages and Bollinger-Bands
Trading means investing. Sometimes you lose more than you win in the beginning of a period!
Don't forget to follow me, so you get updated when I post new analysis. Also read my account to be informed about what I do.
Thank you for following and Succes with trading !
Richard from Rich.Exclusive.Trading

S&P 500 Forming head and shoulders.S&P 500 Forming head and shoulders and is expected to have another leg up within the new few months to a peak of $3000 marked in yellow. Before we see the reversal and start to fall to the target areas we have shown. S&P 500 has been on a Major bull run since 2012 and is now expecting to curve the momentum.

S&P500 bullish RSI devergence on the daily chart.NB. Long term upterm on daily log chart, and bullish RSI divergence marked by red and green lines.
