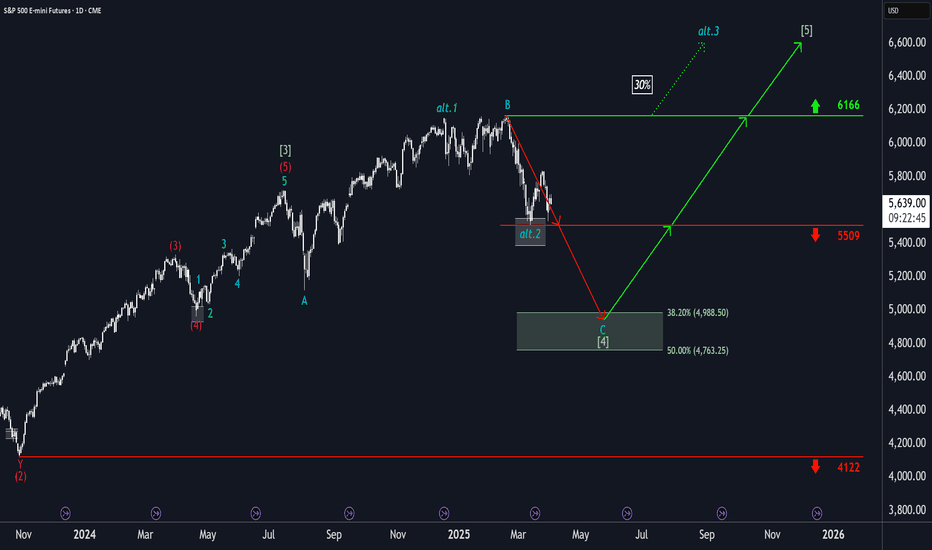
S&P500: Persistent SupportThe S&P 500 continued its recovery following its reaction to the support at 5509 points. However, in our primary scenario, we expect the index to fall below this mark to ultimately complete wave in green within our color-matched Target Zone (coordinates: 4988 points – 4763 points). Within this range, there are entry opportunities for long positions, which could be hedged with a stop 1% below the Zone’s lower boundary. Once the corrective movement has reached its low, the final upward movement of the green wave structure should commence. In the process, the index should gain significantly and reach the high of wave above the resistance at 6166 points. If this mark is surpassed prematurely, our alternative scenario with a 30% probability will come into play.
Sp500prediction
S&P500: Days of DecisionHovering near the 6,000 points mark, the S&P 500 enters the second half of the week at a critical juncture. The next few trading sessions will determine whether the index will push directly to new record highs or first undergo a more extended correction. In our primary scenario, the S&P should continue selling off to settle the turquoise wave 2’s low within the corresponding long Target Zone between 5,667 and 5,389 points. Only from there should the next turquoise impulse wave 3 take over, driving the index to new all-time highs beyond the resistance at 6,365 points. If the S&P immediately resumes its upward trajectory, it might break past 6,365 points without delay. In this 38% likely alternative scenario, the index would bypass the turquoise Target Zone and significantly extend the green impulse wave alt. . Primarily, we consider the green wave as already complete.
S&P500: Strong SurgeOn Friday, a strong surge propelled the S&P500 upward, so the index is beginning the new week at distinctly higher levels. Still, in our primary scenario, we anticipate a significant sell-off during the turquoise wave 2, which should drive the S&P down into our turquoise Target Zone between 5616 and 5368 points. In this range, the turquoise impulsive wave 3 should start and deliver a robust upward movement beyond the resistance at 6169 points. However, there is a 36% chance that the index will reverse upward prematurely and surpass the resistance at 6169 points earlier during an alternative blue five-wave structure.
S&P500: More Upward Potential!We still ascribe more upward potential to the S&P’s turquoise wave B – up to the resistance at 6088 points. At this level, we expect a transition into the same-colored wave C, which should push the index down into our green Target Zone between 5110 and 4921 points. Within this Zone, the larger wave should find its final low, which should provide potential entry points for long positions. A stop-loss can be set 1% below this Zone for risk management. However, if the index surpasses the 6088 points mark directly, our alternative scenario (probability: 38%) will come into play: it suggests that the wave low is already in place.
S&P500 : The completion of the Diagonal patternIn240 minutes chart of the uptrend from the range of 3511 to 3833 is in the form of 3 waves which confirms the scenario of the formation of the Diagonal pattern.
Currently, to get the the confirmation of the downtrend,the price should not cross the range of 3841,because the 3rd wave should not be shorter than the other waves.
By crossing the price from this range,this scenario will be violated.
Thee confirmation for this pattern will be received by the formation of 5 descending waves,and by crossing the price from the range of 3660.
According to monitored position, personally,I set the short order.
By considering the RSI you can also see the convergence
S&P 500-Ending Diagonal patternIn some cases we can't offer long-term analysis,we have to take short term targets in to our consideration.In presented chart everything is clear , according to the Diagonal pattern the probability of down trend formation up to the determined line is existing
SPX SP 500 LONG But possible Trendchange to come
Hello to all who follow my charts.
Today has been an interesting day.
Of course, the S & P 500 was still long and continued up the long trendline
But today we experienced a reversal day and that always does not bode well for the respective trend direction.
The day started normally, then went much higher in the end but to go deeper from the market. A reversal just.
Often, such a reversal day announces a turnaround.
So please be careful with long positions currently.
We have to see tomorrow what happens.
If SP 500 continues to move up the trend line, negate the Reversel signal or begin to tip over the trend lines.
We will have to take a close look.
Currently, the long scenario is definitely at risk.
----------------
--This information is not a recommendation to buy or sell. It is to be used for educational purposes only .Alllways do your own research---
----------------


